Distribution Oscillography in Lateral Protection
By Balaji Santhanam, Director, Hubbell Incorporated
By Balaji Santhanam, Director, Hubbell Incorporated

Distribution oscillography captures high-resolution fault waveforms, GPS time stamps, load profiles, and sequences of events at lateral devices, giving OT engineers precise visibility into feeder disturbances, DER backfeed, and protection miscoordination before outages escalate.
Distribution oscillography is no longer a post-event reporting function. At the lateral edge, waveform capture becomes an operational control input that shapes how protection engineers interpret disturbance origin, relay sequence, and restoration timing. When laterals remain uninstrumented, feeder-level telemetry masks localized electrical behavior that directly influences protection settings.
Most distribution faults originate on laterals. That structural fact means missing oscillographic evidence at those points creates blind zones in event reconstruction. Restoration may appear successful while the initiating condition remains misunderstood. Over time, coordination margins erode without detection.
In DER dense territories, reverse power flow and harmonic distortion alter current signatures and voltage collapse profiles. Sub-cycle voltage and current capture with GPS time alignment across devices eliminates inference and forces protection decisions to be grounded in measured behavior.
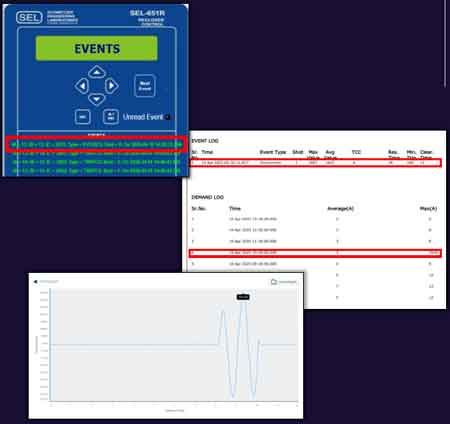
Distribution oscillography deployed at lateral reclosers and sectionalizers records transient waveforms during faults, load transitions, and abnormal switching. Time-aligned records expose whether a lateral fault initiated upstream tripping or whether upstream switching imposed downstream stress.
Traditional feeder head monitoring cannot resolve these dynamics. Oscillographic evidence strengthens integration with Fault Analysis in Power System workflows by enabling direct waveform correlation rather than event-code comparison. Engineers see pickup behavior, clearing intervals, and grading margins under real operating conditions.
Consider a high impedance lateral fault during red flag conditions. Intermittent arcing produces irregular current spikes. Without oscillography, this may appear as a nuisance to upstream operations. Pickup thresholds are widened to reduce repeat trips.

That local adjustment increases exposure across the feeder. If a subsequent downstream fault occurs under relaxed settings, the clearing time extends. Thermal stress rises. Under wildfire mitigation protocols, delayed isolation poses regulatory and liability risks. The cascade originates in waveform ignorance.
Utilities embedding oscillographic review into protection governance have reported reductions exceeding 10 percent in miscoordination-related reclose events. Even modest reductions materially affect SAIDI and crew deployment cost.
Oscillographic evidence also enhances automated event interpretation in AI Fault Detection environments by providing waveform-level ground truth.
Laterals far outnumber feeder head devices. Instrumenting every lateral introduces communications and fleet management pressure. Cellular IoT and hybrid architectures reduce per-device costs, but thousands of oscillographic endpoints require disciplined event-capture thresholds.
Integration with ADMS ensures oscillographic records influence switching logic and outage restoration models rather than remaining isolated diagnostic files. The engineering tradeoff lies between waveform depth and bandwidth saturation. Excessive capture thresholds overwhelm control center workflows. Insufficient thresholds conceal critical transient behavior.
This is not simply a connectivity problem. It is a governance problem.
Waveform interpretation is influenced by model assumptions. DER penetration introduces inverter ramp rates, harmonic injection, and bidirectional flow patterns that resemble fault signatures. Misclassification risk increases when legacy waveform expectations dominate interpretation.
Distribution oscillography must therefore be paired with disciplined validation using Grid Modeling to compare captured events against simulated transient behavior. Without model alignment, identical waveforms can trigger divergent responses across districts.
At the lateral device level, integration with Lateral Fault Detection frameworks ensures oscillographic capture informs threshold refinement rather than operating as passive storage.
During peak solar export, laterals may backfeed the feeder. A temporary fault under reverse-power conditions can invert the expected current direction. Directional elements may misinterpret the event without waveform confirmation.
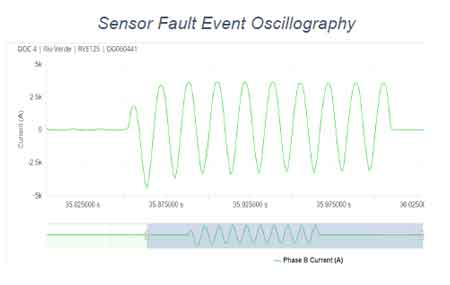
Distribution oscillography allows operators to visualize phase relationships and current magnitude in the event window. Without this visibility, patrol crews may be dispatched to the wrong segment, increasing restoration time and operational cost.
Oscillographic value depends on consistent firmware behavior across devices. Divergent firmware revisions can alter capture resolution and timestamp accuracy, undermining cross-device comparisons. Secure remote firmware governance and synchronized time sources are mandatory.
Waveform data feeds directly into Electrical Fault Detection and Predictive Maintenance for Utilities strategies by exposing abnormal inrush patterns, load ramp anomalies, and repeated transient stress before failure manifests.
The decisive reality is this: if lateral waveform data is absent or ignored, protection setting decisions are guesswork presented as precision.
Think you know Asset Intelligence & Predictive Maintenance? Take our quick, interactive quiz and test your knowledge in minutes.
Advantages To Instructor-Led Training – Instructor-Led Course, Customized Training, Multiple Locations, Economical, CEU Credits, Course Discounts.
Request For QuotationWhether you would prefer Live Online or In-Person instruction, our electrical training courses can be tailored to meet your company's specific requirements and delivered to your employees in one location or at various locations.