East-West Transmission Project Ontario connects Thunder Bay to Wawa, facing OEB bidding, Hydro One vs NextBridge, First Nations consultation, environmental assessment, Pukaskwa National Park route, and reliability needs for Northwestern Ontario industry and communities.
Key Points
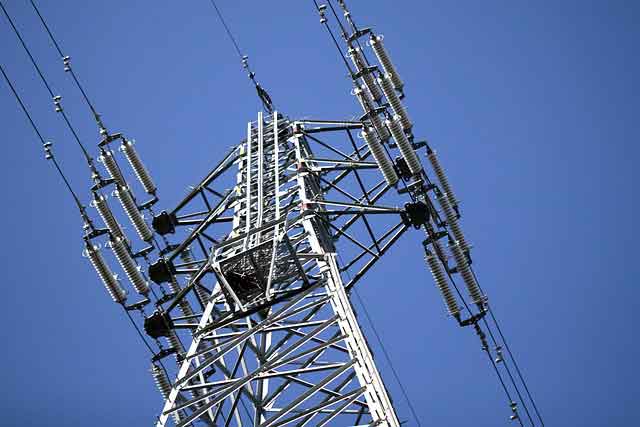
A 450 km Thunder Bay-Wawa power line proposal facing OEB bidding, Hydro One competition, and First Nations consultation.
✅ Competing bids: Hydro One vs NextBridge under OEB rules
✅ First Nations cite duty to consult and environmental review gaps
✅ Route debate: Pukaskwa Park vs bypass; jobs and reliability at stake
Leaders of six First Nations are urging the Ontario government to "clean up" the bureaucratic process that determines who will build an "urgently needed" high-capacity power transmission line to service northern Ontario.
The proposed 450 kilometre East-West Transmission Project is set to stretch from Thunder Bay to Wawa, providing much-needed electricity to northern Ontario. NextBridge Infrastructure, in partnership with Bamkushwada Limited Partnership (BLP) — an entity the First Nations created in order to become co-owners and active participants in the economic development of the line — have been the main proponents of the project since 2012 and were awarded the right to construct.
In 2018, Hydro One appealed to the previous Liberal government with a proposal to build the transmission line with lower maintenance costs. On Dec. 20, the Ontario Energy Board (OEB) issued a decision that said it will issue the contract to construct the project to the company with the lowest bid, even as a Manitoba Hydro line delay followed a board recommendation in a comparable case.
The transmission regime in Ontario allows competing bids at the beginning of a project to designate a transmitter, and then again at the end of the project to award leave to construct.
As a result, the Hydro One was permitted to submit a competing bid, five years after it was first proposed. The chiefs of the six First Nations say that will delay the project by two years, impede their land and violate their rights. The former Liberal government under which the project was initiated "left the door open" for competition to enter this late in the construction, according to the community leaders.
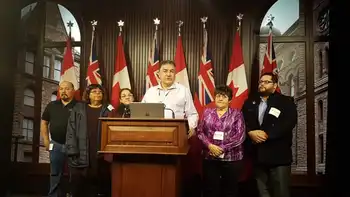
"The former government created this mess and Hydro One has taken advantage of this loophole," Fort William First Nation Chief Peter Collins said in a Queen's Park news conference on Thursday. "Hydro One is an interloper coming in at the last minute, trying taking over the project and all the hard work that has been done, without doing the work it needs to do."
Mess will explode, says chief
According to Collins, the Ontario Energy Board is likely to choose Hydro One's late submission in February, "causing this mess to explode." The electricity and distribution utility has not completed any of the legal requirements demanded by a project of this magnitude, Collins said, including extensive consultations with First Nations, such as oral traditional evidence hearings that inform regulators, and thorough environment assessments. He speculated that by ignoring these two things, even though in B.C. Ottawa did not oppose a Site C work halt pending a treaty rights challenge, Hydro One's bid will be the lowest cost.
"Hydro One's interference is a big problem," said Collins. He was flanked by the leaders of the Pic Mobert First Nation, Opwaaganasiniing (also known as the Red Rock Indian Band), Michipicoten, Biigtigong Nishnaabeg — or Pic River First Nation — and Pays Plat First Nation.
Collins also highlighted that Hydro One's proposed route for the transmission line will go through Pukaskwa National Park on which there are Aboriginal title claims, and noted that an opponent of the Site C dam has been sharing concerns with northerners, underscoring the need for meaningful engagement. NextBridge's proposal, Collins said, will go around the park.
If Hydro One is awarded the construction project, at risk, too, are as many as 1,000 job opportunities in northern Ontario (including the Ring of Fire) that are expected from NextBridge's proposal, as well as the "many millions" in contracting opportunities for the communities, Collins said.
"That companies such as Hydro One can do this and dissolve all that has been developed by NextBridge and our [partnership] and all the opportunities we have created will signal to ... everyone in Ontario that Ontario's not open for business, at least fair business," Collins said.
Ontario Energy Minister 'disappointed' by OEB's decision
In an email statement to National Observer, Energy Minister Greg Rickford's press secretary said the government acknowledged the concerns of the First Nations leaders, and is "disappointed that the OEB continues to stall on this important project."
"The East-West Tie project is a priority for Ontario because it is needed to provide a reliable and adequate supply of electricity to northwestern Ontario to support economic growth," she wrote.
In October, Rickford wrote to the OEB outlining his expectation that a prompt decision would be made through an efficient and fair process.
Despite the minister’s request, the OEB delayed a decision on this project in December — as in B.C., a utilities watchdog has pressed for answers on Site C dam stability — pushing the service date back to at least 2021. In 2017, NextBridge said that, pending OEB approval, it would start construction in 2018, with completion scheduled for 2020.
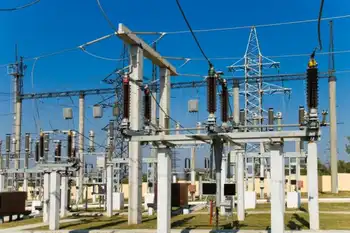
Without the transmission line, the community faces a higher likelihood of power outages and less reliable electricity overall.
"Our government takes the duty to consult seriously and it is committed to ensuring that all Indigenous communities are properly consulted and kept informed regardless of the result of the OEB process," Rickford's office's statement said.
In a letter sent to Premier Doug Ford, Rickford and to Environment Minister Rod Phillips, all members of the Bamkushwada Limited Partnership said they will be compelled to appeal the OEB's decision if the right to construct is given to Hydro One.
The entire situation, they wrote in their letter, is "an undeniable mess" that requires government intervention.
"If the Ontario government can correct this looming outcome, it is incumbent on the Ontario government to do so," they wrote, urging the government to "take all legal means to prevent the OEB from rendering an unconstitutional and unjust decision."
"Our First Nations and the north have waited five long years for this transmission project," Collins said. "Enough is enough."
Related News