Germany Energiewende Lessons highlight climate policy tradeoffs, as renewables, wind and solar face grid constraints, coal phase-out delays, rising electricity prices, and public opposition, informing Canada on diversification, hydro, oil and gas, and balanced transition.
Key Points
Insights from Germany's renewable shift on costs, grid limits, and emissions to guide Canada's balanced energy policy.
✅ Evidence: high power prices, delayed coal exit, limited grid buildout
✅ Land, materials, and wildlife impacts challenge wind and solar scale-up
✅ Diversification: hydro, nuclear, gas, and storage balance reliability
News that Greta Thunberg is visiting Alberta should be welcomed by all Canadians.
The teenaged Swedish environmentalist has focused global attention on the climate change debate like never before. So as she tours our province, where selling renewable energy could be Alberta's next big thing, what better time for a reality check than to look at a country that is furthest ahead in already adapting steps that Greta is advocating.
That country is Germany. And it’s not a pretty sight.
Germany embraced the shift toward renewable energy before anyone else, and did so with gusto. The result?
Germany’s largest newsmagazine Der Spiegel published an article on May 3 of this year entitled “A Botched Job in Germany.” The cover showed broken wind turbines and half-finished transition towers against a dark silhouette of Berlin.
Germany’s renewable energy transition, Energiewende, is a bust. After spending and committing a total of US$580 billion to it from 2000 to 2025.
Why is that? Because it’s been a nightmare of foolish dreams based on hope rather than fact, resulting in stalled projects and dreadfully poor returns.
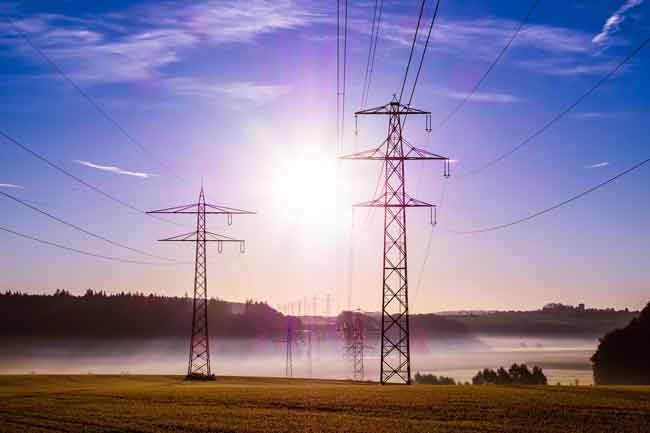
Last year Germany admitted it had to delay its phase-out of coal and would not meet its 2020 greenhouse gas emissions reduction commitment. Only eight per cent of the transmission lines needed to support this new approach to powering Germany have been built.
Opposition to renewables is growing due to electricity prices rising to the point they are now among the highest in the world. Wind energy projects in Germany are now facing the same opposition that pipelines are here in Canada.
Opposition to renewables in Germany, reports Forbes, is coming from people who live in rural or suburban areas, in opposition to the “urbane, cosmopolitan elites who fetishize their solar roofs and Teslas as a sign of virtue.” Sound familiar?
So, if renewables cannot successfully power Germany, one of the richest and most technologically advanced countries in the world, who can do it better?
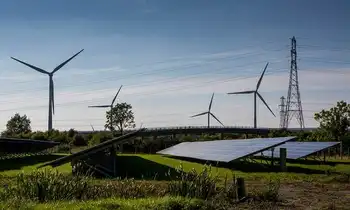
The biggest problem with using wind and solar power on a large scale is that the physics just don’t work. They need too much land and equipment to produce sufficient amounts of electricity.
Solar farms take 450 times more land than nuclear power plants to produce the same amount of electricity. Wind farms take 700 times more land than natural gas wells.
The amount of metal required to build these sites is enormous, requiring new mines. Wind farms are killing hundreds of endangered birds.
No amount of marketing or spin can change the poor physics of resource-intensive and land-intensive renewables.
But, wait. Isn’t Norway, Greta’s neighbour, dumping its energy investments and moving into alternative energy like wind farms in a big way?
No, not really. Fact is only 0.8 per cent of Norway’s power comes from wind turbines. The country is blessed with a lot of hydroelectric power, but that’s a historical strength owing to the country’s geography, nothing new.
And yet we’re being told the US$1-trillion Oslo-based Government Pension Fund Global is moving out of the energy sector to instead invest in wind, solar and other alternative energy technologies. According to 350.org activist Nicolo Wojewoda this is “yet another nail in the coffin of the coal, oil, and gas industry.”
Well, no.
Norway’s pension fund is indeed investing in new energy forms, but not while pulling out of traditional investments in oil and gas. Rather, as any prudent fund manager will, they are diversifying by making modest investments in emerging industries such as Alberta's renewable energy surge that will likely pay off down the road while maintaining existing investments, spreading their investments around to reduce risk. Unfortunately for climate alarmists, the reality is far more nuanced and not nearly as explosive as they’d like us to think.
Yet, that’s enough for them to spin this tale to argue Canada should exit oil and gas investment and put all of our money into wind and solar, even as Canada remains a solar power laggard according to experts.
That is not to say renewable energy projects like wind and solar don’t have a place. They do, and we must continue to innovate and research lower-polluting ways to power our societies on the path to zero-emissions electricity by 2035 in Canada.
But like it actually is in Norway, investment in renewables should supplement — not replace — fossil fuel energy systems if we aim for zero-emission electricity in Canada by 2035 without undermining reliability. We need both.
And that’s the message that Greta should hear when she arrives in Canada.
Rick Peterson is the Edmonton-based founder and Beth Bailey is a Calgary-based supporter of Suits and Boots, a national not-for-profit group of investment industry professionals that supports resource sector workers and their families.
Related News