U.S. on track for one million EVs: DOE

By Reuters


NFPA 70b Training - Electrical Maintenance

Our customized live online or in‑person group training can be delivered to your staff at your location.

  • Live Online
  • 12 hours Instructor-led
  • Group Training Available
Regular Price:
$599
Coupon Price:
$499
Reserve Your Seat Today
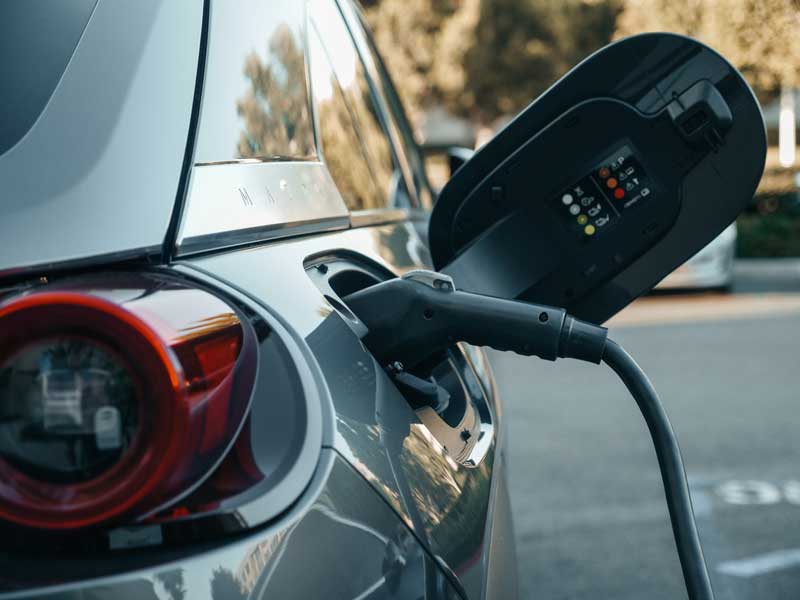
President Barack Obama's goal of having 1 million plug-in vehicles on U.S. roads by 2015 is on its way to being met, a Department of Energy official said.

"It's looking good," said Assistant Energy Secretary David Sandalow when asked by reporters on the chances of meeting the goal set by Obama.

"If you look at the plans of the major automotive manufacturers, there's a clear pathway to a million vehicles," Sandalow said.

Sandalow spoke to reporters after his keynote address to the Society of Automotive Engineers in Detroit.

Obama's goal of 1 million plug-in electric and hybrid cars by 2015 was a campaign pledge that he has restated since becoming president in January 2009. The goal was widely seen as well beyond optimistic forecasts for expansion of the alternative vehicles at the time, and there is skepticism that it can be met.

"The pace of innovation in this industry is extraordinary, and the interest around the world is extraordinary," he said. "But, partly it depends on American entrepreneurship and innovation. That's always served us very well in the past and I think it will do so in the future."

The DOE will soon announce how it will handle cuts to its energy efficiency and renewable energy program. He said he was not ready to say how much of those cuts will come in the automotive sector.

The cuts will not slow the Obama administration's effort on energy efficiency, he said.

"We will march forward aggressively to promote clean energy and we've got the budget to do it," Sandalow said.

Related News

Ontario plunging into energy storage as electricity supply crunch looms

Ontario Energy Storage Procurement accelerates grid flexibility as IESO seeks lithium batteries, pumped storage, compressed air, and flywheels to balance renewables, support EV charging, and complement gas peakers during Pickering refits and rising electricity demand.


Key Points

Ontario's plan to procure 2,500 MW of storage to firm renewables, aid EV charging, and add flexible grid capacity.

✅ 2,500 MW storage plus 1,500 MW gas for 2025-2027 reliability

✅ Mix: lithium batteries, pumped storage, compressed air, flywheels

✅ Enables VPPs via EVs, demand response, and hybrid solar-storage


Ontario is staring down an electricity supply crunch and amid a rush to secure more power, it is plunging into the world of energy storage — a relatively unknown solution for the grid that experts say could also change energy use at home.

Beyond the sprawling nuclear plants and waterfalls that generate most of the province’s electricity sit the batteries, the underground caverns storing compressed air to generate electricity, and the spinning flywheels waiting to store energy at times of low demand and inject it back into the system when needed.

The province’s energy needs are quickly rising, with the proliferation of electric vehicles and growing Canada-U.S. collaboration on EV adoption, and increasing manufacturing demand for electricity on the horizon just as a large nuclear plant that supplies 14 per cent of Ontario’s electricity is set to be retired and other units are being refurbished.

The government is seeking to extend the life of the Pickering Nuclear Generating Station, planning an import agreement for power with Quebec, rolling out conservation programs, and — controversially — relying on more natural gas to fill the looming gap between demand and supply, amid Northern Ontario sustainability debates.

Officials with the Independent Electricity System Operator say a key advantage of natural gas generation is that it can quickly ramp up and down to meet changes in demand. Energy storage can provide that same flexibility, those in the industry say.

Energy Minister Todd Smith has directed the IESO to secure 1,500 megawatts of new natural gas capacity between 2025 and 2027, along with 2,500 megawatts of clean technology such as energy storage that can be deployed quickly, which together would be enough to power the city of Toronto.

It’s a far cry from the 54 megawatts of energy storage in use in Ontario’s grid right now.

Smith said in an interview that it’s the largest active procurement for energy storage in North America.

“The one thing that we want to ensure that we do is continue to add clean generation as much as possible, and affordable and clean generation that’s reliable,” he said.

Rupp Carriveau, director of the Environmental Energy Institute at the University of Windsor, said the timing is good.

“The space is there, the technology is there, and the willingness among private industry to respond is all there,” he said. “I know of a lot of companies that have been rubbing their hands together, looking at this potential to construct storage capacity.”

Justin Rangooni, the executive director of Energy Storage Canada, said because of the relatively tight timelines, the 2,500 megawatts is likely to be mostly lithium batteries. But there are many other ways to store energy, other than a simple battery.

“As we get to future procurements and as years pass, you’ll start to see possibly pump storage, compressed air, thermal storage, different battery chemistry,” he said.

Pump storage involves using electricity during off-peak periods to pump water into a reservoir and slowly releasing it to run a turbine and generate electricity when it’s needed. Compressed air works similarly, and old salt caverns in Goderich, Ont., are being used to store the compressed air.

In thermal storage, electricity is used to heat water when demand is low and when it’s needed, water stored in tanks can be used as heat or hot water.

Flywheels are large spinning tops that can store kinetic energy, which can be used to power a turbine and produce electricity. A flywheel facility in Minto, Ont., also installed solar panels on its roof and became the first solar storage hybrid facility in Ontario, said a top IESO official.

Katherine Sparkes, the IESO’s director of innovation, research and development, said it’s exciting, from a grid perspective.

“As we kind of look to the future and we think about gas phase out and electrification, one of the big challenges that all power systems across North America and around the world are looking at is: how do you accommodate increasing amounts of variable, renewable resources and just make better use of your grid assets,” she said.

“Hybrids, storage generation pairings, gives you that opportunity to deal with the variability of renewables, so to store electricity when the sun isn’t shining, or the wind isn’t blowing, and use it when you need it to.”

The small amount of storage already in the system provides more fine tuning of the electricity system, whereas 2,500 megawatts will be a more “foundational” part of the toolkit, said Sparkes.

But what’s currently on the grid is far from the only storage in the province. Many commercial and industrial consumers, such as large manufacturing facilities or downtown office buildings, are using storage to manage their electricity usage, relying on battery energy when prices are high.

The IESO sees that as an opportunity and has changed market rules to allow those customers to sell electricity back to the grid when needed.

As well, the IESO has its eye on the thousands of mobile batteries in electric vehicles, a trend seen in California, that shuttle people around the province every day but sit unused for much of the time.

“If we can enable those batteries to work together in aggregation, or work with other types of technologies like solar or smart building systems in a configuration, like a group of technologies, that becomes a virtual power plant,” Sparkes said.

Peak Power, a company that seeks to “make power plants obsolete,” is running a pilot project with electric vehicles in three downtown Toronto office buildings in which the car batteries can provide electricity to reduce the facility’s overall demand during peak periods using vehicle-to-building charging with bidirectional chargers.

In that model, one vehicle can earn $8,000 per year, said cofounder and chief operating officer Matthew Sachs.

“Battery energy storage will change the energy industry in the same way and for the same reasons that refrigeration changed the milk industry,” he said.

“As you had refrigeration, you could store your commodity and that changed the distribution channels of it. So I believe that energy storage is going to radically change the distribution channels of energy.”

If every home has a solar panel, an electric vehicle and a residential battery, it becomes a generating station, a decentralization that’s not only more environmentally friendly, but also relies less on “monopolized utilities,” Sachs said.

In the next decade, energy demand from electric vehicles is projected to skyrocket, making vehicle-to-grid integration increasingly relevant, and Sachs said the grid can’t grow enough to accommodate a peak demand of hundreds of thousands of vehicles being plugged in to charge at the end of the workday commute. Authorities need to be looking at more incentives such as time-of-use pricing and price signals to ensure the demand is evened out, he said.

“It’s a big risk as much as it’s a big opportunity,” he said. “If we do it wrong, it will cost us billions to fix. If we do it right, it can save us billions.”

Jack Gibbons, the chair of the Ontario Clean Air Alliance, said the provincial and federal governments need to fund and install bidirectional chargers in order to fully take advantage of electric vehicles.

“This is a huge missed opportunity,” he said.


Related News

View more

Coronavirus impacts dismantling of Germany's Philippsburg nuclear plant

Philippsburg Demolition Delay: EnBW postpones controlled cooling-tower blasts amid the coronavirus pandemic, affecting decommissioning timelines in Baden-Wurttemberg and grid expansion for a transformer station to route renewable power and secure supply in southern Germany.


Key Points

EnBW's COVID-19 delay of Philippsburg cooling-tower blasts, affecting decommissioning and grid plans.

✅ Controlled detonation shifted to mid-May at earliest

✅ Demolition links to transformer station for north-south grid

✅ Supports security of supply in southern Germany


German energy company EnBW said the coronavirus outbreak has impacted plans to dismantle its Philippsburg nuclear power plant in Baden-Wurttemberg, southwest Germany, amid plans to phase out coal and nuclear nationally.

The controlled detonation of Phillipsburg's cooling towers will now take place in mid-May at the earliest, subject to coordination as Germany debates whether to reconsider its nuclear phaseout in light of supply needs.

However, EnBW said the exact demolition date depends on many factors - including the further development in the coronavirus pandemic and ongoing climate policy debates about energy choices.

Philippsburg 2, a 1402MWe pressurised water reactor unit permanently shut down on 31 December 2019, as part of Germany's broader effort to shut down its remaining reactors over time.

At the end of 2019, the Ministry of the Environment gave basic approval for decommissioning and dismantling of unit 2 of the Philippsburg nuclear power plant, inluding explosive demolition of the colling towers. Since then EnBW has worked intensively on getting all the necessary formal steps on the way and performing technical and logistical preparatory work, even as discussions about a potential nuclear resurgence continue nationwide.

“The demolition of the cooling towers is directly related to future security of supply in southern Germany. We therefore feel obliged to drive this project forward," said Jörg Michels head of the EnBW nuclear power division.

The timely removal of the cooling towers is important as the area currently occupied by nuclear plant components is needed for a transformer station for long-distance power lines, an issue underscored during the energy crisis when Germany temporarily extended nuclear power to bolster supply. These will transport electricity from renewable sources in the north to industrial centres in the south.

As of early 2020, there six nuclear reactors in operation in Germany, even as the country turned its back on nuclear in subsequent years. According to research institute Fraunhofer ISE, nuclear power provided about 14% of Germany's net electricity in 2019, less than half of the figure for 2000.


Related News

View more

Wasteful air conditioning adds $200 to summer energy bills, reveals BC Hydro

BC Hydro Air Conditioning Efficiency Tips help cut energy bills as HVAC use rises. Avoid inefficient portable AC units, set thermostats near 25 C, use fans and window shading, and turn systems off when unoccupied.


Key Points

BC Hydro's guidelines to lower summer power bills by optimizing A/C settings, fans, shading, and usage habits at home.

✅ Set thermostats to 25 C; switch off A/C when away

✅ Prefer fans and window shading; close doors/windows in heat

✅ Avoid multiple portable A/C units; choose efficient HVAC


BC Hydro is scolding British Columbians for their ineffective, wasteful and costly use of home air conditioners.

In what the electric utility calls “not-so-savvy” behaviour, it says many people are over-spending on air conditioning units that are poorly installed or used incorrectly.

"The majority of British Columbians will spend more time at home this summer because of the COVID-19 pandemic," BC Hydro says in a news release about an August survey of customers.

"With A/C use on the rise, there is evidence British Columbians are not cooling down efficiently, leading to higher summer electricity bills, as extreme heat boosts U.S. bills too this summer."

BC Hydro estimates some customers are shelling out $200 more on their summer energy bills than they need to during a record-breaking 2021 demand year for electricity.

The pandemic is compounding the demand for cool, comfortable air at home. Roughly two in five British Columbians between the ages of 25 and 50 are working from home five days a week.

However, it’s not just COVID-19 that is putting a strain on energy consumption and monthly bills, with drought affecting generation as well today.

About 90 per cent of people who use an air conditioner set it to a temperature below the recommended 25 Celsius, according to BC Hydro.

In fact, one in three people have set their A/C to the determinedly unseasonable temperature of 19 C.

Another 30 per cent are using more than one portable air conditioning unit, which the utility says is considered the most inefficient model on the market, and questions remain about crypto mining electricity use in B.C. today.

The use of air conditioners is steadily increasing in B.C. and has more than tripled since 2001, according to BC Hydro, with all-time high demand also reported in B.C. during recent heat waves. The demand for climate control is particularly high among condo-dwellers since apartments tend to trap heat and stay warmer.

This may explain why one in 10 residents of the Lower Mainland has three portable air conditioning units, and elsewhere Calgary's frigid February surge according to Enmax.

In addition, 30 per cent of people keep the air conditioning on for the sake of their pets while no one is home.

BC Hydro makes these recommendations to save energy and money on monthly bills while still keeping homes cooled during summer’s hottest days, and it also offers a winter payment plan to help manage costs:

Cool homes to 25 C in summer months when home; air conditioning should be turned off when homes are unoccupied.
In place of air conditioning, running a fan for nine hours a day over the summer costs $7.
Shading windows with drapes and blinds can help insulate a home by keeping out 65 per cent of the heat.
If the temperature outside a home is warmer than inside, keep doors and windows closed to keep cooler air inside.
Use a microwave, crockpot or toaster oven to avoid the extra heat produced by larger appliances, such as an oven, when cooking. Hang clothes to dry instead of using a dryer on hot days.


Related News

View more

Which of the cleaner states imports dirty electricity?

Hourly Electricity Emissions Tracking maps grid balancing areas, embodied emissions, and imports/exports, revealing carbon intensity shifts across PJM, ERCOT, and California ISO, and clarifying renewable energy versus coal impacts on health and climate.


Key Points

An hourly method tracing generation, flows, and embodied emissions to quantify carbon intensity across US balancing areas.

✅ Hourly traces of imports/exports and generation mix

✅ Consumption-based carbon intensity by balancing area

✅ Policy insights for renewables, coal, health costs


In the United States, electricity generation accounts for nearly 30% of our carbon emissions. Some states have responded to that by setting aggressive renewable energy standards; others are hoping to see coal propped up even as its economics get worse. Complicating matters further is the fact that many regional grids are integrated, and as America goes electric the stakes grow, meaning power generated in one location may be exported and used in a different state entirely.

Tracking these electricity exports is critical for understanding how to lower our national carbon emissions. In addition, power from a dirty source like coal has health and environment impacts where it's produced, and the costs of these aren't always paid by the parties using the electricity. Unfortunately, getting reliable figures on how electricity is produced and where it's used is challenging, even for consumers trying to find where their electricity comes from in the first place, leaving some of the best estimates with a time resolution of only a month.

Now, three Stanford researchers—Jacques A. de Chalendar, John Taggart, and Sally M. Benson—have greatly improved on that standard, and they have managed to track power generation and use on an hourly basis. The researchers found that, of the 66 grid balancing areas within the United States, only three have carbon emissions equivalent to our national average, and they have found that imports and exports of electricity have both seasonal and daily changes. de Chalendar et al. discovered that the net results can be substantial, with imported electricity increasing California's emissions/power by 20%.

Hour by hour
To figure out the US energy trading landscape, the researchers obtained 2016 data for grid features called balancing areas. The continental US has 66 of these, providing much better spatial resolution on the data than the larger grid subdivisions. This doesn't cover everything—several balancing areas in Canada and Mexico are tied in to the US grid—and some of these balancing areas are much larger than others. The PJM grid, serving Pennsylvania, New Jersey, and Maryland, for example, is more than twice as large as Texas' ERCOT, in a state that produces and consumes the most electricity in the US.

Despite these limitations, it's possible to get hourly figures on how much electricity was generated, what was used to produce it, and whether it was used locally or exported to another balancing area. Information on the generating sources allowed the researchers to attach an emissions figure to each unit of electricity produced. Coal, for example, produces double the emissions of natural gas, which in turn produces more than an order of magnitude more carbon dioxide than the manufacturing of solar, wind, or hydro facilities. These figures were turned into what the authors call "embodied emissions" that can be traced to where they're eventually used.

Similar figures were also generated for sulfur dioxide and nitrogen oxides. Released by the burning of fossil fuels, these can both influence the global climate and produce local health problems.

Huge variation
The results were striking. "The consumption-based carbon intensity of electricity varies by almost an order of magnitude across the different regions in the US electricity system," the authors conclude. The low is the Bonneville Power grid region, which is largely supplied by hydropower; it has typical emissions below 100kg of carbon dioxide per megawatt-hour. The highest emissions come in the Ohio Valley Electric region, where emissions clear 900kg/MW-hr. Only three regional grids match the overall grid emissions intensity, although that includes the very large PJM (where capacity auction payouts recently fell), ERCOT, and Southern Co balancing areas.

Most of the low-emissions power that's exported comes from the Pacific Northwest's abundant hydropower, while the Rocky Mountains area exports electricity with the highest associated emissions. That leads to some striking asymmetries. Local generation in the hydro-rich Idaho Power Company has embodied emissions of only 71kg/MW-hr, while its imports, coming primarily from Rocky Mountain states, have a carbon content of 625kg/MW-hr.

The reliance on hydropower also makes the asymmetry seasonal. Local generation is highest in the spring as snow melts, but imports become a larger source outside this time of year. As solar and wind can also have pronounced seasonal shifts, similar changes will likely be seen as these become larger contributors to many of these regional grids. Similar things occur daily, as both demand and solar production (and, to a lesser extent, wind) have distinct daily profiles.

The Golden State
California's CISO provides another instructive case. Imports represent less than 30% of its total electric use in 2016, yet California electricity imports provided 40% of its embodied emissions. Some of these, however, come internally from California, provided by the Los Angeles Department of Water and Power. The state itself, however, has only had limited tracking of imported emissions, lumping many of its sources as "other," and has been exporting its energy policies to Western states in ways that shape regional markets.

Overall, the 2016 inventory provides a narrow picture of the US grid, as plenty of trends are rapidly changing our country's emissions profile, including the rise of renewables and the widespread adoption of efficiency measures and other utility trends in 2017 that continue to evolve. The method developed here can, however, allow for annual updates, providing us with a much better picture of trends. That could be quite valuable to track things like how the rapid rise in solar power is altering the daily production of clean power.

More significantly, it provides a basis for more informed policymaking. States that wish to promote low-emissions power can use the information here to either alter the source of their imports or to encourage the sites where they're produced to adopt more renewable power. And those states that are exporting electricity produced primarily through fossil fuels could ensure that the locations where the power is used pay a price that includes the health costs of its production.


Related News

View more

The German economy used to be the envy of the world. What happened?

Germany's Economic Downturn reflects an energy crisis, deindustrialization risks, export weakness, and manufacturing stress, amid Russia gas loss, IMF and EU recession forecasts, and debates over electricity price caps and green transition.


Key Points

An economic contraction from energy price shocks, export weakness, and bottlenecks in manufacturing and digitization.

✅ Energy shock after loss of cheap Russian gas

✅ Exports slump amid China slowdown and weak demand

✅ Policy gridlock on power price cap and permits


Germany went from envy of the world to the worst-performing major developed economy. What happened?

For most of this century, Germany racked up one economic success after another, dominating global markets for high-end products like luxury cars and industrial machinery, selling so much to the rest of the world that half the economy ran on exports.

Jobs were plentiful, the government’s financial coffers grew as other European countries drowned in debt, and books were written about what other countries could learn from Germany.

No longer. Now, Germany is the world’s worst-performing major developed economy, with both the International Monetary Fund and European Union expecting it to shrink this year.

It follows Russia’s invasion of Ukraine and the loss of Moscow’s cheap Russian gas that underpinned industry — an unprecedented shock to Germany’s energy-intensive industries, long the manufacturing powerhouse of Europe.

The sudden underperformance by Europe’s largest economy has set off a wave of criticism, handwringing and debate about the way forward.

Germany risks “deindustrialization” as high energy costs and government inaction on other chronic problems threaten to send new factories and high-paying jobs elsewhere, said Christian Kullmann, CEO of major German chemical company Evonik Industries AG.

From his 21st-floor office in the west German town of Essen, Kullmann points out the symbols of earlier success across the historic Ruhr Valley industrial region: smokestacks from metal plants, giant heaps of waste from now-shuttered coal mines, a massive BP oil refinery and Evonik’s sprawling chemical production facility.

These days, the former mining region, where coal dust once blackened hanging laundry, is a symbol of the energy transition, as the power sector’s balancing act continues with wind turbines and green space.

The loss of cheap Russian natural gas needed to power factories “painfully damaged the business model of the German economy,” Kullmann told The Associated Press. “We’re in a situation where we’re being strongly affected — damaged — by external factors.”

After Russia cut off most of its gas to the European Union, spurring an energy crisis in the 27-nation bloc that had sourced 40% of the fuel from Moscow, the German government asked Evonik to turn to coal by keeping its 1960s coal-fired power plant running a few months longer.

The company is shifting away from the plant — whose 40-story smokestack fuels production of plastics and other goods — to two gas-fired generators that can later run on hydrogen amid plans to become carbon neutral by 2030 and following the nuclear phase-out of recent years.

One hotly debated solution: a government-funded cap on industrial electricity prices to get the economy through the renewable energy transition, amid an energy crisis that even saw a temporary nuclear extension to stabilize supply.

The proposal from Vice Chancellor Robert Habeck of the Greens Party has faced resistance from Chancellor Olaf Scholz, a Social Democrat, and pro-business coalition partner the Free Democrats. Environmentalists say it would only prolong reliance on fossil fuels, while others advocate a nuclear option to meet climate goals.

Kullmann is for it: “It was mistaken political decisions that primarily developed and influenced these high energy costs. And it can’t now be that German industry, German workers should be stuck with the bill.”

The price of gas is roughly double what it was in 2021, with a senior official arguing nuclear would do little to solve that gas issue, hurting companies that need it to keep glass or metal red-hot and molten 24 hours a day to make glass, paper and metal coatings used in buildings and cars.

A second blow came as key trade partner China experiences a slowdown after several decades of strong economic growth.

These outside shocks have exposed cracks in Germany’s foundation that were ignored during years of success, including lagging use of digital technology in government and business and a lengthy process to get badly needed renewable energy projects approved.


Related News

View more

U.S. residential electricity bills increased 5% in 2022, after adjusting for inflation

U.S. Residential Electricity Bills rose on stronger demand, inflation, and fuel costs, with higher retail prices, kWh consumption, and extreme weather driving 2022 spikes; forecasts point to stable summer usage and slight price increases.


Key Points

They are average household power costs shaped by prices, kWh use, weather, and upstream fuel costs.

✅ 2022 bills up 13% nominal, 5% real vs. 2021

✅ Retail price rose 11%; consumption up 2% to 907 kWh

✅ Fuel costs to plants up 34%, pressuring rates


In nominal terms, the average monthly electricity bill for residential customers in the United States increased 13% from 2021 to 2022, rising from $121 a month to $137 a month. After adjusting for inflation—which reached 8% in 2022, a 40-year high—electricity bills increased 5%. Last year had the largest annual increase in average residential electricity spending since we began calculating it in 1984. The increase was driven by a combination of more extreme temperatures, which increased U.S. consumption of electricity for both heating and cooling, and higher fuel costs for power plants, which drove up retail electricity prices nationwide.

Residential electricity customers’ monthly electricity bills are based on the amount of electricity consumed and the retail electricity price. Average U.S. monthly electricity consumption per residential customer increased from 886 kilowatthours (kWh) in 2021 to 907 kWh in 2022, even as U.S. electricity sales have declined over the past seven years. Both a colder winter and a hotter summer contributed to the 2% increase in average monthly electricity consumption per residential customer in 2022 because customers used more space heating during the winter and more air conditioning during the summer, with some states, such as Pennsylvania, facing sharp winter rate increases.

Although we don’t directly collect retail electricity prices, we do collect revenues from electricity providers that allow us to determine prices by dividing by consumption, and industry reports show major utilities spending more on electricity delivery than on power production. In 2022, the average U.S. residential retail electricity price was 15.12 cents/kWh, an 11% increase from 13.66 cents/kWh in 2021. After adjusting for inflation, U.S. residential electricity prices went up by 2.5%.

Higher fuel costs for power plants drove the increase in residential retail electricity prices. The cost of fossil fuels—including natural gas prices, coal, and petroleum—delivered to U.S. power plants increased 34%, from $3.82 per million British thermal units (MMBtu) in 2021 to $5.13/MMBtu in 2022. The higher fuel costs were passed along to residential customers and contributed to higher retail electricity prices, and Germany power prices nearly doubled over a year in a related trend.

In the first three months of 2023, the average U.S. residential monthly electricity bill was $133, or 5% higher than for the same time last year, according to data from our Electric Power Monthly. The increase was driven by a 13% increase in the average U.S. residential retail electricity price, which was partly offset by a 7% decrease in average monthly electricity consumption per residential customer, and industry outlooks also see U.S. power demand sliding 1% on milder weather. This summer, we expect that typical household electricity bills will be similar to last year’s, with customers paying about 2% more on average. The slight increase in electricity costs forecast for this summer stems from higher retail electricity prices but similar consumption levels as last summer.


Related News

View more

Sign Up for Electricity Forum’s Newsletter

Stay informed with our FREE Newsletter — get the latest news, breakthrough technologies, and expert insights, delivered straight to your inbox.

Electricity Today T&D Magazine Subscribe for FREE

Stay informed with the latest T&D policies and technologies.
  • Timely insights from industry experts
  • Practical solutions T&D engineers
  • Free access to every issue

Download the 2025 Electrical Training Catalog

Explore 50+ live, expert-led electrical training courses –

  • Interactive
  • Flexible
  • CEU-cerified