CEA: Canada needs to invest now

By Canadian Electricity Association CEA


Substation Relay Protection Training

Our customized live online or in‑person group training can be delivered to your staff at your location.

  • Live Online
  • 12 hours Instructor-led
  • Group Training Available
Regular Price:
$699
Coupon Price:
$599
Reserve Your Seat Today
OTTAWA, Ontario – Recently, the Canadian Electricity Association CEA released a white paper urging decision makers to ensure electricity forms the backbone of a pan-Canadian energy strategy.

While CEA is encouraged by the striking of a working group led by Alberta Premier Alison Redford, Newfoundland and Labrador Premier Kathy Dunderdale, and Manitoba Premier Greg Selinger and that some progress toward building on the 2007 action plan has been established, CEA is disappointed that more defined action could not be achieved, particularly with respect to electricity as it is essential to the Canadian economy.

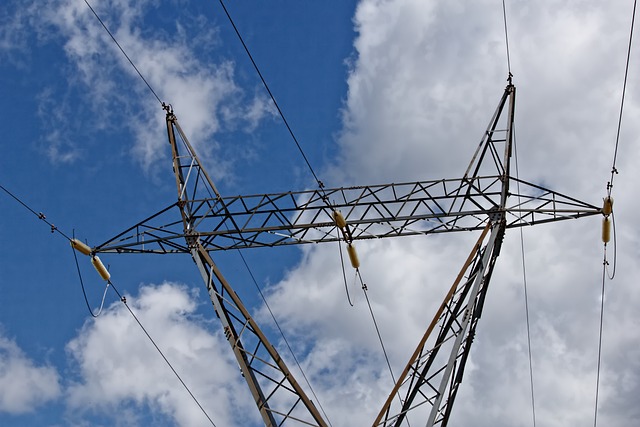
A recent Senate Report, "Now or Never" confirmed that electricity is an essential part of the energy strategy. “Canada needs to invest significantly in refurbished and new electricity infrastructure in order to maintain system reliability” said Jim Burpee, President and CEO of CEA.

“A pan-Canadian approach on energy would support harmonized standards for system efficiency, the progress of the smart grid, and the development of electric vehicle infrastructure as we transition to a low-carbon economy.”

CanadaÂ’s electricity system was built 30 to 60 years ago, and must now be renewed in order to maintain system reliability and the capacity to support economic development. With billions of dollars of investment at stake, and hundreds of thousands of jobs on the line, CEA is calling on the Premiers and their provincial energy ministers to work towards a pan-Canadian energy strategy that is sensitive to jurisdiction but also understands that investing in our electricity system for the next generation creates the backbone for economic growth and prosperity across the country.

Related News

Atlantica - Regulatory Reform To Bring Greener Power To Atlantic Canada

Atlantic Canada Energy Regulatory Reform accelerates smart grids, renewables, hydrogen, and small modular reactors to meet climate targets, enabling interprovincial transmission, EV charging, and decarbonization toward a net-zero grid by 2035 with agile, collaborative policies.


Key Points

A policy shift enabling smart grids, clean energy, and transmission upgrades to decarbonize Atlantic Canada by 2035.

✅ Agile rules for smart grids, EV load, and peak demand balancing

✅ Interprovincial transmission: Maritime Link, NB-PEI, Atlantic Loop

✅ Supports hydrogen, SMRs, and renewables to cut GHG emissions


Atlantica Centre for Energy Senior Policy Consultant Neil Jacobsen says the future of Atlantic Canada’s electricity grid depends on agile regulations, supported by targeted research such as the $2M Atlantic grid study, that match the pace at which renewable technologies are being developed in the race to meet Canada’s climate goals.

In an interview, Jacobsen stressed the need for a more modernized energy regulatory framework, so the Atlantic Provinces can collaborate to quickly develop and adopt cleaner energy.

To this end, Atlantica released a paper that makes the case for responsive smart grid technology, the adaptation of alternative forms of clean energy, the adaptation of hydrogen as an energy source, petroleum price regulation in Atlantic Canada and small modular reactors.

Jacobsen said regulations need to match Canada’s urgency around reducing greenhouse gas emissions by 40 to 45 percent by 2030, achieving a net-neutral national power grid by 2035 and ultimately a net-zero grid by 2050 in Canada – and the goal that 50 percent of Canadian vehicle sales being electric by 2030.

“It’s an evolution of policy and regulations to adapt to a very aggressive timeline of aggressive climate change and decarbonization targets,” said Jacobsen.

“These are transformational energy and environmental commitments, so the path forward really requires the ability to introduce and adapt and move forward with new clean renewable energy technologies.”

Jacobsen said Atlantica’s recommendations are not a criticism of existing regulations– but an acknowledgment that they need to evolve.

He noted newer, clearer regulations will make way for new energy sources – particularly a region that has the countries highest rates of dependency on fossil fuels and growing climate risks, with Atlantic grids under threat from more intense storms.

“We have a long way to go, but at the same time, we have a lot to celebrate. Atlantic Canada is leading the country in reducing greenhouse gas emissions,” said Jacobsen.

“There are new ways of producing energy that requires us to be able to be much more responsive and this is an opportunity to create a higher level of alignment here, in Atlantic Canada.”

Jacobsen said Atlantica is looking to aid interprovincial cooperation in providing power, echoing calls for a western Canadian grid elsewhere, through projects like the 500-megawatt, 170-kilometre Maritime Link that transports power from the Muskrat Falls hydroelectric dam in Labrador, through Newfoundland and across the Cabot Strait, to Nova Scotia – or NB Power’s export of electricity to P.E.I., via sub-sea cables crossing the Northumberland Strait.

He noted streamlined regulations may allow for more potential wider-scale partnerships, like the proposed Atlantic Loop project, aligning with macrogrid investments that would involve upgrading transmission capacity on the East Coast to allow hydroelectric power from Labrador and Quebec to displace coal use in the region.

Atlantic Canada has led the way with adaption new renewable technologies, noted Jacobsen, referring to nuclear startups Moltex Energy and ARC Nuclear Canada’s efforts to develop small modular nuclear reactor technology in New Brunswick, as well as the potential of adopting hydrogen fuel technology and Nova Scotia’s strides in developing offshore renewable energy.

“I don’t think we have any choice other than to be forceful and aggressive in driving forward a renewable energy agenda.”

Jacobsen said cooperation between the Atlantic provinces is crucial because of how challenging it is to meet energy demand with heavy seasonal and daily variations in energy demand in the region – something smart grid technology could address.

Smart Grid Atlantic is a four-year research and demonstration program testing technologies that provide cleaner local power, support a smarter electricity infrastructure across the region, more renewable power, more information and control over power use and more reliable electricity.

“It can be challenging for utilities to meet those cyclical demands, especially as grids are increasingly exposed to harsh weather across Canada. Smart girds add knowledge of the flow of electrons in a way that can help even out those electricity demands – and quite frankly, those demands will only increase when you look at the electrification of the transportation sector,” he said.

Jacobsen said Atlantica’s paper and call for modernized regulations are only the beginning of a conversation.


Related News

View more

Purdue: As Ransomware Attacks Increase, New Algorithm May Help Prevent Power Blackouts

Infrastructure Security Algorithm prioritizes cyber defense for power grids and critical infrastructure, mitigating ransomware, blackout risks, and cascading failures by guiding utilities, regulators, and cyber insurers on optimal security investment allocation.


Key Points

An algorithm that optimizes security spending to cut ransomware and blackout risks across critical infrastructure.

✅ Guides utilities on optimal security allocation

✅ Uses incentives to correct human risk biases

✅ Prioritizes assets to prevent cascading outages


Millions of people could suddenly lose electricity if a ransomware attack just slightly tweaked energy flow onto the U.S. power grid, as past US utility intrusions have shown.

No single power utility company has enough resources to protect the entire grid, but maybe all 3,000 of the grid's utilities could fill in the most crucial security gaps if there were a map showing where to prioritize their security investments.

Purdue University researchers have developed an algorithm to create that map. Using this tool, regulatory authorities or cyber insurance companies could establish a framework for protecting the U.S. power grid that guides the security investments of power utility companies to parts of the grid at greatest risk of causing a blackout if hacked.

Power grids are a type of critical infrastructure, which is any network - whether physical like water systems or virtual like health care record keeping - considered essential to a country's function and safety. The biggest ransomware attacks in history have happened in the past year, affecting most sectors of critical infrastructure in the U.S. such as grain distribution systems in the food and agriculture sector and the Colonial Pipeline, which carries fuel throughout the East Coast, prompting increased military preparation for grid hacks in the U.S.

With this trend in mind, Purdue researchers evaluated the algorithm in the context of various types of critical infrastructure in addition to the power sector, including electricity-sector IoT devices that interface with grid operations. The goal is that the algorithm would help secure any large and complex infrastructure system against cyberattacks.

"Multiple companies own different parts of infrastructure. When ransomware hits, it affects lots of different pieces of technology owned by different providers, so that's what makes ransomware a problem at the state, national and even global level," said Saurabh Bagchi, a professor in the Elmore Family School of Electrical and Computer Engineering and Center for Education and Research in Information Assurance and Security at Purdue. "When you are investing security money on large-scale infrastructures, bad investment decisions can mean your power grid goes out, or your telecommunications network goes out for a few days."

Protecting infrastructure from hacks by improving security investment decisions

The researchers tested the algorithm in simulations of previously reported hacks to four infrastructure systems: a smart grid, industrial control system, e-commerce platform and web-based telecommunications network. They found that use of this algorithm results in the most optimal allocation of security investments for reducing the impact of a cyberattack.

The team's findings appear in a paper presented at this year's IEEE Symposium on Security and Privacy, the premier conference in the area of computer security. The team comprises Purdue professors Shreyas Sundaram and Timothy Cason and former PhD students Mustafa Abdallah and Daniel Woods.

"No one has an infinite security budget. You must decide how much to invest in each of your assets so that you gain a bump in the security of the overall system," Bagchi said.

The power grid, for example, is so interconnected that the security decisions of one power utility company can greatly impact the operations of other electrical plants. If the computers controlling one area's generators don't have adequate security protection, as seen when Russian hackers accessed control rooms at U.S. utilities, then a hack to those computers would disrupt energy flow to another area's generators, forcing them to shut down.

Since not all of the grid's utilities have the same security budget, it can be hard to ensure that critical points of entry to the grid's controls get the most investment in security protection.

The algorithm that Purdue researchers developed would incentivize each security decision maker to allocate security investments in a way that limits the cumulative damage a ransomware attack could cause. An attack on a single generator, for instance, would have less impact than an attack on the controls for a network of generators, which sophisticated grid-disruption malware can target at scale, rather than for the protection of a single generator.

Building an algorithm that considers the effects of human behavior

Bagchi's research shows how to increase cybersecurity in ways that address the interconnected nature of critical infrastructure but don't require an overhaul of the entire infrastructure system to be implemented.

As director of Purdue's Center for Resilient Infrastructures, Systems, and Processes, Bagchi has worked with the U.S. Department of Defense, Northrop Grumman Corp., Intel Corp., Adobe Inc., Google LLC and IBM Corp. on adopting solutions from his research. Bagchi's work has revealed the advantages of establishing an automatic response to attacks, and analyses like Symantec's Dragonfly report highlight energy-sector risks, leading to key innovations against ransomware threats, such as more effective ways to make decisions about backing up data.

There's a compelling reason why incentivizing good security decisions would work, Bagchi said. He and his team designed the algorithm based on findings from the field of behavioral economics, which studies how people make decisions with money.

"Before our work, not much computer security research had been done on how behaviors and biases affect the best defense mechanisms in a system. That's partly because humans are terrible at evaluating risk and an algorithm doesn't have any human biases," Bagchi said. "But for any system of reasonable complexity, decisions about security investments are almost always made with humans in the loop. For our algorithm, we explicitly consider the fact that different participants in an infrastructure system have different biases."

To develop the algorithm, Bagchi's team started by playing a game. They ran a series of experiments analyzing how groups of students chose to protect fake assets with fake investments. As in past studies in behavioral economics, they found that most study participants guessed poorly which assets were the most valuable and should be protected from security attacks. Most study participants also tended to spread out their investments instead of allocating them to one asset even when they were told which asset is the most vulnerable to an attack.

Using these findings, the researchers designed an algorithm that could work two ways: Either security decision makers pay a tax or fine when they make decisions that are less than optimal for the overall security of the system, or security decision makers receive a payment for investing in the most optimal manner.

"Right now, fines are levied as a reactive measure if there is a security incident. Fines or taxes don't have any relationship to the security investments or data of the different operators in critical infrastructure," Bagchi said.

In the researchers' simulations of real-world infrastructure systems, the algorithm successfully minimized the likelihood of losing assets to an attack that would decrease the overall security of the infrastructure system.

Bagchi's research group is working to make the algorithm more scalable and able to adapt to an attacker who may make multiple attempts to hack into a system. The researchers' work on the algorithm is funded by the National Science Foundation, the Wabash Heartland Innovation Network and the Army Research Lab.

Cybersecurity is an area of focus through Purdue's Next Moves, a set of initiatives that works to address some of the greatest technology challenges facing the U.S. Purdue's cybersecurity experts offer insights and assistance to improve the protection of power plants, electrical grids and other critical infrastructure.


Related News

View more

Hydro One CEO's $4.5M salary won't be reduced to help cut electricity costs

Hydro One CEO Salary shapes debate on Ontario electricity costs, executive compensation, sunshine list transparency, and public disclosure rules, as officials argue pay is not driving planned hydro rate cuts for consumers.


Key Points

Hydro One CEO pay disclosed in public filings, central to debates on Ontario electricity rates and transparency.

✅ 2016 compensation: $4.5M (salary + bonuses)

✅ Excluded from Ontario's sunshine list after privatization

✅ Government says pay won't affect planned hydro rate cuts


The $4.5 million in pay received by Hydro One's CEO is not a factor in the government's plan to cut electricity costs for consumers, an Ontario cabinet minister said Thursday amid opposition concerns about the executive's compensation and wider sector pressures such as Manitoba Hydro's rising debt in other provinces.

Treasury Board President Liz Sandals made her comments on the eve of the release of the province's so-called sunshine list.

The annual disclosure of public-sector salaries over $100,000 will be released Friday, but Hydro One salaries such as that of company boss Mayo Schmidt won't be on it.Though the government still owns most of Hydro One — 30 per cent has been sold — the company is required to follow the financial disclosure rules of publicly traded companies, which means disclosing the salaries of its CEO, CFO and next three highest-paid executives, and financial results such as a Q2 profit decline in filings.

New filings show that Schmidt was paid $4.5 million in 2016 — an $850,000 salary plus bonuses — and those top five executives were paid a total of about $11.7 million. 

"Clearly that's a very large amount," said Sandals. Sandals wouldn't say whether or not she thought the pay was appropriate at a time when the government is trying to reduce system costs and cut people's hydro bills.

Mayo Schmidt, President & CEO of Hydro One Limited and Hydro One Inc. (Hydro One )

But she suggested the CEO's salary was not a factor in efforts to bring down hydro prices, even as Hydro One shares fell after a leadership shakeup in a later period. "The CEO salary is not part of the equation of will 'we be able to make the cut,"' she said. "Regardless of what those salaries are, we will make a 25-per-cent-off cut." The cut coming this summer is actually an average of 17 per cent -- the 25-per-cent figure factors in an earlier eight-per-cent rebate.

NDP Leader Andrea Horwath, who has proposed to make hydro public again in Ontario, said the executive salaries are relevant to cutting hydro costs.

"All of this is cost of operating the electricity system, it's part of the operating of Hydro One and so of course those increased salaries are going to impact the cost of our electricity," she said.

Schmidt was appointed Aug. 31, 2015, and in the last four months of that year earned $1.3 million, but the former CEO was paid $745,000 in 2014. About 3,800 workers were paid over $100,000 that year, none of whom will be on the sunshine list this year.

Progressive Conservative energy critic Todd Smith has a private member's bill that would put Hydro One salaries back on the list, amid investor concerns about Hydro One that cite too many unknowns.

"The Wynne Liberals don't want the people of Ontario to know that their rates have helped create a new millionaire's club at Hydro One," Smith said. "Hydro One is still under the majority ownership of the public, but Premier Kathleen Wynne has removed these salaries from the public's watchful eye."

The previous sunshine list showed 115,431 people were earning more than $100,000 — an increase of nearly 4,000 people despite the fact 3,774 Hydro One workers were not on the list for the first time.

Tom Mitchell, the former CEO at Ontario Power Generation who resigned last summer, topped the 2015 list at $1.59 million.


Related News

View more

Climate change: Greenhouse gas concentrations again break records

Rising Greenhouse Gas Concentrations drive climate change, with CO2, methane, and nitrous oxide surging; WMO data show higher radiative forcing, elevated pre-industrial baselines, and persistent atmospheric concentrations despite Paris Agreement emissions pledges.


Key Points

Increasing atmospheric CO2, methane, and nitrous oxide levels that raise radiative forcing and drive warming.

✅ WMO data show CO2 at 407.8 ppm in 2018, above decade average

✅ Methane and nitrous oxide surged, elevating total radiative forcing

✅ Concentrations differ from emissions; sinks absorb about half


The World Meteorological Organization (WMO) says the increase in CO2 was just above the average rise recorded over the last decade.

Levels of other warming gases, such as methane and nitrous oxide, have also surged by above average amounts.

Since 1990 there's been an increase of 43% in the warming effect on the climate of long lived greenhouse gases.

The WMO report looks at concentrations of warming gases in the atmosphere rather than just emissions.

The difference between the two is that emissions refer to the amount of gases that go up into the atmosphere from the use of fossil fuels, such as burning coal for coal-fired electricity generation and from deforestation.

Concentrations are what's left in the air after a complex series of interactions between the atmosphere, the oceans, the forests and the land. About a quarter of all carbon emissions are absorbed by the seas, and a similar amount by land and trees, while technologies like carbon capture are being explored to remove CO2.

Using data from monitoring stations in the Arctic and all over the world, researchers say that in 2018 concentrations of CO2 reached 407.8 parts per million (ppm), up from 405.5ppm a year previously.

This increase was above the average for the last 10 years and is 147% of the "pre-industrial" level in 1750.

The WMO also records concentrations of other warming gases, including methane and nitrous oxide, and some countries have reported declines in certain potent gases, as noted in US greenhouse gas controls reports, though global levels remain elevated. About 40% of the methane emitted into the air comes from natural sources, such as wetlands, with 60% from human activities, including cattle farming, rice cultivation and landfill dumps.

Methane is now at 259% of the pre-industrial level and the increase seen over the past year was higher than both the previous annual rate and the average over the past 10 years.

Nitrous oxide is emitted from natural and human sources, including from the oceans and from fertiliser-use in farming. According to the WMO, it is now at 123% of the levels that existed in 1750.

Last year's increase in concentrations of the gas, which can also harm the ozone layer, was bigger than the previous 12 months and higher than the average of the past decade.

What concerns scientists is the overall warming impact of all these increasing concentrations. Known as total radiative forcing, this effect has increased by 43% since 1990, and is not showing any indication of stopping.

There is no sign of a slowdown, let alone a decline, in greenhouse gases concentration in the atmosphere despite all the commitments under the Paris agreement on climate change and the ongoing global energy transition efforts," said WMO Secretary-General Petteri Taalas.

"We need to translate the commitments into action and increase the level of ambition for the sake of the future welfare of mankind," he added.

"It is worth recalling that the last time the Earth experienced a comparable concentration of CO2 was three to five million years ago. Back then, the temperature was 2-3C warmer, sea level was 10-20m higher than now," said Mr Taalas.

The UN Environment Programme will report shortly on the gap between what actions countries are taking to cut carbon, for example where Australia's emissions rose 2% recently, and what needs to be done to keep under the temperature targets agreed in the Paris climate pact.

Preliminary findings from this study, published during the UN Secretary General's special climate summit last September, indicated that emissions continued to rise during 2018, although global emissions flatlined in 2019 according to the IEA.

Both reports will help inform delegates from almost 200 countries who will meet in Madrid next week for COP25, following COP24 in Katowice the previous year, the annual round of international climate talks.


Related News

View more

Could selling renewable energy be Alberta's next big thing?

Alberta Renewable Energy Procurement is surging as corporate PPAs drive wind and solar growth, with the Pembina Institute and the Business Renewables Centre linking buyers and developers in Alberta's energy-only market near Medicine Hat.


Key Points

A market-led approach where corporations use PPAs to secure wind and solar power from Alberta projects.

✅ Corporate PPAs de-risk projects and lock in clean power.

✅ Alberta's energy-only market enables efficient transactions.

✅ Skilled workforce supports wind, solar, legal, and financing.


Alberta has big potential when it comes to providing renewable energy, advocates say.

The Pembina Institute says the practice of corporations committing to buy renewable energy is just taking off in Canada, and Alberta has both the energy sector and the skilled workforce to provide it.

Earlier this week, a company owned by U.S. billionaire Warren Buffett announced a large new wind farm near Medicine Hat. It has a buyer for the power.

Sara Hastings-Simon, director of the Pembina's Business Renewables Centre, says this is part of a trend.

"We're talking about the practice of corporate institutions purchasing renewables to meet their own electricity demand. And this is a really well-established driver for renewable energy development in the U.S.," she said. "You may be hearing headlines like Google, Apple and others that are buying renewables and we're helping to bring this practice to Canada."

The Business Renewables Centre (BRC) is a not-for-profit working to accelerate corporate and institutional procurement of renewables in Canada. The group held its inaugural all members event in Calgary on Thursday.

Hastings-Simon says shareholders and investors are encouraging more use of solar and wind power in Canada.

"We have over 10 gigawatts of renewable energy projects in the pipeline that are ready for buyers. And so we see multinational companies coming to Canada to start to procure here, as well as Canadian companies understanding that this is an opportunity for them as well," Hastings-Simon said.

"It's really exciting to see business interests driving renewable energy development."

Sara Hastings-Simon is the director of the Pembina Institute's Business Renewables Centre, which seeks to build up Alberta's renewable energy industry. (Mike Symington/CBC)

Hastings-Simon says renewable procurement could help dispel the narrative that it's all about oil and gas in Alberta by highlighting Alberta as a powerhouse for both green energy and fossil fuels in Canada.

She says the practice started with a handful of tech companies in the U.S. and has become more mainstream there, even as Canada remains a solar laggard to some observers, with more and more large companies wanting to reduce their energy footprint.

He says his U.S.-based organization has been working for years to speed up and expand the renewables market for companies that want to address their own sustainability.

"We try and make that a little bit easier by building out a community that can help to really reinforce each other, share lessons learned, best practices and then drive for transactions to have actual material impact worldwide," he said.

"We're really excited to be working with the Pembina group and the BRC Canada team," he said. "We feel our best value for this is just to support them with our experiences and lessons. They've been basically doing the same thing for many years helping to grow and grow and cultivate the market."


Porter says Alberta's market is more than ready.

"There are some precedent transactions already so people know it can work," he said. "The way Alberta is structured, being an energy-only market is useful. And I think that there is a strong ecosystem of both budget developers and service providers … that can really help these transactions get over the line."

As procurement ramps up, Hastings-Simon says Alberta already has the skilled workers needed to fill renewable energy jobs across the province.

"We have a lot of the knowledge that's needed, and that's everybody from the construction down through the legal and financing — all those pieces of building big projects," she said. "We are seeing increasing interest in people that want to become involved in that industry, and so there is increasing demand for training in things like solar power installation and wind technicians."

Hastings-Simon predicts an increase in demand for both the services and the workers.

"As this industry ramps up, we're going to need to have more workers that are active in those areas," she said. "So I think we can see a very nice increase — both the demand and the number of folks that are able to work in this field."


Related News

View more

Which of the cleaner states imports dirty electricity?

Hourly Electricity Emissions Tracking maps grid balancing areas, embodied emissions, and imports/exports, revealing carbon intensity shifts across PJM, ERCOT, and California ISO, and clarifying renewable energy versus coal impacts on health and climate.


Key Points

An hourly method tracing generation, flows, and embodied emissions to quantify carbon intensity across US balancing areas.

✅ Hourly traces of imports/exports and generation mix

✅ Consumption-based carbon intensity by balancing area

✅ Policy insights for renewables, coal, health costs


In the United States, electricity generation accounts for nearly 30% of our carbon emissions. Some states have responded to that by setting aggressive renewable energy standards; others are hoping to see coal propped up even as its economics get worse. Complicating matters further is the fact that many regional grids are integrated, and as America goes electric the stakes grow, meaning power generated in one location may be exported and used in a different state entirely.

Tracking these electricity exports is critical for understanding how to lower our national carbon emissions. In addition, power from a dirty source like coal has health and environment impacts where it's produced, and the costs of these aren't always paid by the parties using the electricity. Unfortunately, getting reliable figures on how electricity is produced and where it's used is challenging, even for consumers trying to find where their electricity comes from in the first place, leaving some of the best estimates with a time resolution of only a month.

Now, three Stanford researchers—Jacques A. de Chalendar, John Taggart, and Sally M. Benson—have greatly improved on that standard, and they have managed to track power generation and use on an hourly basis. The researchers found that, of the 66 grid balancing areas within the United States, only three have carbon emissions equivalent to our national average, and they have found that imports and exports of electricity have both seasonal and daily changes. de Chalendar et al. discovered that the net results can be substantial, with imported electricity increasing California's emissions/power by 20%.

Hour by hour
To figure out the US energy trading landscape, the researchers obtained 2016 data for grid features called balancing areas. The continental US has 66 of these, providing much better spatial resolution on the data than the larger grid subdivisions. This doesn't cover everything—several balancing areas in Canada and Mexico are tied in to the US grid—and some of these balancing areas are much larger than others. The PJM grid, serving Pennsylvania, New Jersey, and Maryland, for example, is more than twice as large as Texas' ERCOT, in a state that produces and consumes the most electricity in the US.

Despite these limitations, it's possible to get hourly figures on how much electricity was generated, what was used to produce it, and whether it was used locally or exported to another balancing area. Information on the generating sources allowed the researchers to attach an emissions figure to each unit of electricity produced. Coal, for example, produces double the emissions of natural gas, which in turn produces more than an order of magnitude more carbon dioxide than the manufacturing of solar, wind, or hydro facilities. These figures were turned into what the authors call "embodied emissions" that can be traced to where they're eventually used.

Similar figures were also generated for sulfur dioxide and nitrogen oxides. Released by the burning of fossil fuels, these can both influence the global climate and produce local health problems.

Huge variation
The results were striking. "The consumption-based carbon intensity of electricity varies by almost an order of magnitude across the different regions in the US electricity system," the authors conclude. The low is the Bonneville Power grid region, which is largely supplied by hydropower; it has typical emissions below 100kg of carbon dioxide per megawatt-hour. The highest emissions come in the Ohio Valley Electric region, where emissions clear 900kg/MW-hr. Only three regional grids match the overall grid emissions intensity, although that includes the very large PJM (where capacity auction payouts recently fell), ERCOT, and Southern Co balancing areas.

Most of the low-emissions power that's exported comes from the Pacific Northwest's abundant hydropower, while the Rocky Mountains area exports electricity with the highest associated emissions. That leads to some striking asymmetries. Local generation in the hydro-rich Idaho Power Company has embodied emissions of only 71kg/MW-hr, while its imports, coming primarily from Rocky Mountain states, have a carbon content of 625kg/MW-hr.

The reliance on hydropower also makes the asymmetry seasonal. Local generation is highest in the spring as snow melts, but imports become a larger source outside this time of year. As solar and wind can also have pronounced seasonal shifts, similar changes will likely be seen as these become larger contributors to many of these regional grids. Similar things occur daily, as both demand and solar production (and, to a lesser extent, wind) have distinct daily profiles.

The Golden State
California's CISO provides another instructive case. Imports represent less than 30% of its total electric use in 2016, yet California electricity imports provided 40% of its embodied emissions. Some of these, however, come internally from California, provided by the Los Angeles Department of Water and Power. The state itself, however, has only had limited tracking of imported emissions, lumping many of its sources as "other," and has been exporting its energy policies to Western states in ways that shape regional markets.

Overall, the 2016 inventory provides a narrow picture of the US grid, as plenty of trends are rapidly changing our country's emissions profile, including the rise of renewables and the widespread adoption of efficiency measures and other utility trends in 2017 that continue to evolve. The method developed here can, however, allow for annual updates, providing us with a much better picture of trends. That could be quite valuable to track things like how the rapid rise in solar power is altering the daily production of clean power.

More significantly, it provides a basis for more informed policymaking. States that wish to promote low-emissions power can use the information here to either alter the source of their imports or to encourage the sites where they're produced to adopt more renewable power. And those states that are exporting electricity produced primarily through fossil fuels could ensure that the locations where the power is used pay a price that includes the health costs of its production.


Related News

View more

Sign Up for Electricity Forum’s Newsletter

Stay informed with our FREE Newsletter — get the latest news, breakthrough technologies, and expert insights, delivered straight to your inbox.

Electricity Today T&D Magazine Subscribe for FREE

Stay informed with the latest T&D policies and technologies.
  • Timely insights from industry experts
  • Practical solutions T&D engineers
  • Free access to every issue

Download the 2025 Electrical Training Catalog

Explore 50+ live, expert-led electrical training courses –

  • Interactive
  • Flexible
  • CEU-cerified