Ontario electricity emissions forecast highlights rising grid CO2 as nuclear refurbishments and the Pickering closure drive more natural gas, limited renewables, and delayed Quebec hydro imports, pending advances in storage and transmission upgrades.
Key Points
A projection that Ontario's grid CO2 will rise as nuclear units refurbish or retire, increasing natural gas use.
✅ Nuclear refurbs and Pickering shutdown cut zero-carbon baseload
✅ Gas plants fill capacity gaps, boosting GHG emissions
✅ Quebec hydro imports face cost, transmission, and timing limits
Ontario's energy grid is among the cleanest in North America — but the province’s nuclear plans mean that some of our progress will be reversed over the next decade.
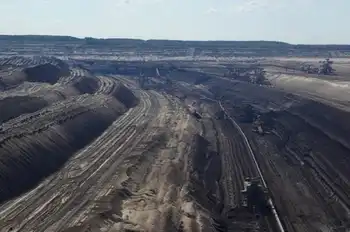
What was once Canada’s largest single source of greenhouse-gas emissions is now a solar-power plant. The Nanticoke Generating Station, a coal-fired power plant in Haldimand County, was decommissioned in stages from 2010 to 2013 — and even before the last remaining structures were demolished earlier this year, Ontario Power Generation had replaced its nearly 4,000 megawatts with a 44-megawatt solar project in partnership with the Six Nations of the Grand River Development Corporation and the Mississaugas of the Credit First Nation.
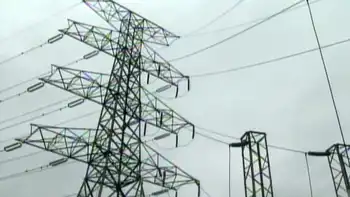
But neither wind nor solar has done much to replace coal in Ontario’s hydro sector, a sign of how slowly Ontario is embracing clean power in practice across the province. At Nanticoke, the solar panels make up less than 2 per cent of the capacity that once flowed out to southern Ontario over high-voltage transmission lines. In cleaning up its electricity system, the province relied primarily on nuclear power — but the need to extend the nuclear system’s lifespan will end up making our electricity dirtier again.
“We’ve made some pretty great strides since 2005 with the fuel mix,” says Terry Young, vice-president of corporate communications at the Independent Electricity System Operator, the provincial agency whose job it is to balance supply and demand in Ontario’s electricity sector. “There have been big changes since 2005, but, yes, we will see an increase because of the closure of Pickering and the refurbs coming.”
“The refurbs” is industry-speak for the major rebuilds of both the Darlington and Bruce nuclear-power stations. The two are both in the early stages of major overhauls intended to extend their operating lives into the 2060s: in the coming years, they’ll be taken offline and rebuilt. (The Pickering nuclear plant will not be refurbished and will shut down in 2024.)
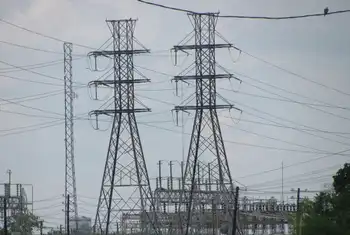
The catch is that, as the province loses its nuclear capacity in increments, Ontario will be short of electricity in the coming years and the IESO will need to find capacity elsewhere to make sure the lights stay on. And that could mean burning a lot more natural gas — and creating more greenhouse-gas emissions.
According to the IESO’s planning assumptions, electricity will be responsible for 11 megatonnes of greenhouse-gas emissions annually by 2035 (last year, it was three megatonnes). That’s the “reference case” scenario: if conservation and efficiency policies shave off some electricity demand, we could get it down to something like nine megatonnes. But if demand is higher than expected, it could be as high as 13 megatonnes — more than quadruple Ontario’s 2018 emissions.
Even in the worst-case scenario, the province’s emissions from electricity would still be less than half of what they were in 2005, before the province began phasing out its coal generation. But it’s still a reversal of a trend that both Liberals and Progressive Conservatives have boasted about — the Liberals to justify their energy policies, the PCs to justify their hostility to a federal carbon tax.
Young emphasized that technology can change and that the IESO’s planning assumptions are just that: projections based on the information available today. A revolution in electricity storage could make it possible to store the province’s cleaner power sources overnight for use during the day, but that’s still only in the realm of speculation — and the natural-gas infrastructure exists in the real world, today.
Ontario Power Generation — the Crown corporation that operates many of the province’s power plants, including Pickering and Darlington — recently bought four gas plants, two of them outright (two it already owned in part). All were nearly complete or already operational, so the purchase itself won’t change the province’s emissions prospects. Rather, OPG is simply looking to maintain its share of the electricity market after the Pickering shutdown.
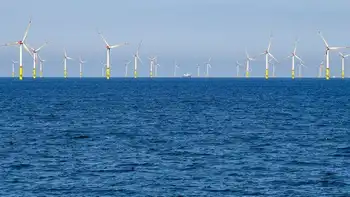
“It will allow us to maintain our scale, with the upcoming end of Pickering’s commercial operations, so that we can continue our role as the driver of Ontario’s lower carbon future,” Neal Kelly, OPG’s director of media, issues, and management, told TVO.org via email. “Further, there is a growing need for flexible gas fired generation to support intermittent wind and solar generation.”
The shift to more gas-fired generation has been coming for a while, and critics say that Ontario has missed an opportunity to replace the lost Pickering capacity with something cleaner. MPP Mike Schreiner, leader of the Green party, has argued for years that Ontario should have pursued an agreement with Quebec to import clean hydroelectricity.
“To me, it’s a cost-effective solution, and it’s a zero-emissions solution,” Schreiner says. “Regardless of your position on sources of electricity, I think everyone could agree that waterpower from Quebec is going to be less expensive.”
Quebec is eager to sell Ontario its surplus hydro power, but not everyone agrees that importing power would be cheaper. A study published by the Ontario Chamber of Commerce (and commissioned by Ontario Power Generation) calls the claim a “myth” and states that upgrading electric-transmission wires between Ontario and Quebec would cost $1.2 billion and take 10 years, while some estimates suggest fully greening Ontario's grid would cost far more overall.
With Quebec imports seemingly a non-starter and major changes to Ontario’s nuclear fleet already underway, there’s only one path left for this province’s greenhouse-gas emissions: upwards.
Related News