Ontario Global Adjustment and ICI balance hydro rates, renewable cost shift, and peak demand. Class A and Class B customers face demand response decisions amid pandemic occupancy uncertainty and volatile GA charges through 2022.
Key Points
A pricing model where GA costs and ICI peak allocation shape Class A/B bills, driven by renewables cost shifts.
✅ Renewable cost shift trims GA; larger Class A savings expected.
✅ Class A peak strategy returns; occupancy uncertainty persists.
✅ Class B faces volatile GA; limited levers beyond efficiency.
Ontario’s large commercial electricity customers can approach the looming annual decision about their billing structure for the 12 months beginning July 1 with the assurance of long-term relief on a portion of their costs, amid changes coming for electricity consumers that could affect planning. That’s to be weighed against uncertainties around energy demand and whether a locked-in cost allocation formula that looked favourable in pre-pandemic times will remain so until June 30, 2022.
“The biggest unknown is we just don’t know when the people are coming back,” Jon Douglas, director of sustainability with Menkes Property Management Services, reflected during a webinar sponsored by the Building Owners and Managers Association (BOMA) of Greater Toronto last week. “The occupancy in our office buildings this fall, and going into the new year, could really impact the outcome of the decision.”
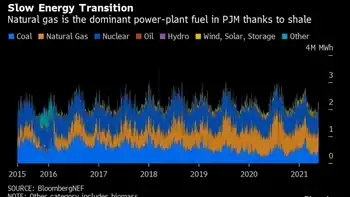
After a year of operational upheaval and more modifications to provincial electricity pricing policies, BOMA Toronto’s regularly scheduled workshop ahead of the June 15 deadline for eligible customers to opt into the Industrial Conservation Initiative (ICI) program had a lot of ground to cover. Notably, beginning in January, all commercial customers have seen a reduction in the global adjustment (GA) component of their monthly hydro bills after the Ontario government shifted costs associated with contracted non-hydroelectric renewable supply to reduce the burden on industrial ratepayers from electricity rates to the general provincial account — a move that trims approximately $258 million per month from the total GA charged to industrial and commercial customers. However, they won’t garner the full benefit of that until 2022 since they’re currently repaying about $333 million in GA costs that were deferred in April, May and June of 2020.
Renewable cost shift pares the global adjustment
For now, Ontario government officials estimate the renewable cost shift equates to a 12 per cent discount relative to 2020 prices, even as typical bills may rise about 2% as fixed pricing ends in some cases. Once last year’s GA deferral is repaid at the end of 2021, they project the average Class A customer participating in the ICI program should realize a 16 per cent saving on the total hydro bill, while Class B customers paying the GA on a volumetric per kilowatt-hour (kWh) basis will see a slightly more moderate 15 per cent decrease.
“This is the biggest change to electricity pricing that’s happened since the introduction of ICI,” Tim Christie, director of electricity policy, economics and system planning for Ontario’s Ministry of Energy, Northern Development and Mines, told online workshop attendees. “The government is funding the out-of-market costs of renewables. It does tail off into the 2030s as those contracts (for wind, solar and biomass generation) expire, but over the next eight-ish years, it’s pretty steady at around just over $3 billion per year.”
Extrapolating from 2020 costs, he pegged average electricity costs at roughly 9.1 cents/kWh for Class A commercial customers and 13.2 cents/kWh for Class B, a point of concern for Ontario manufacturers facing high rates as well. However, energy management specialists suggest actual 2021 numbers haven’t proved that out.
“In commercial buildings, we’re averaging 10 to 12 cents for Class A in 2021, and we’re seeing more than that for about 14, 15 cents for Class B,” reported Scott Rouse, managing partner with the consulting firm, Energy@Work.
GA costs for Class B customers dropped nearly 30 per cent in the first four months of 2021 compared to the last four months of 2020, when they averaged 11.8 cents/kWh. Thus far, though, there have been significant month-to-month fluctuations, with a low of 5.04 cents/kWh in February and a high of 10.9 cents/kWh in April contributing to the four-month average of 8.3 cents/kWh.
“In 2020, system-wide GA very often averaged more than $1 billion per month,” Rouse said. “This February it dropped to $500 million, which was really quite surprising. So it is a very volatile cost.”
Although welcome, the renewable cost shift does alter the payback on energy-saving investments, particularly for demand response mechanisms like energy storage. When combined with pandemic-related uncertainty and a series of policy and program reversals alongside calls to clean up Ontario’s hydro policy in recent years, the industry’s appetite for some more capital-intensive technologies appears to be flagging.
“Volatility puts a pause on some of the innovation,” said Terry Flynn, general manager with BentallGreenOak and chair of BOMA Toronto’s energy committee. “It could be a leading edge, but it might be a bleeding edge that won’t bear any fruit because the way the commodity costs are structured will change.”
“There’s kind of a wait-and-see approach on some of these bigger investments,” Douglas concurred.
Industrial Conservation Initiative underpins commercial class divide
Turning to the ICI, Class A customers — defined as those with average monthly energy demand of at least 1 megawatt (MW) — encountered some unexpected changes to the program rules during 2020. Meanwhile, Class B customers — encompassing the vast share of commercial properties smaller than about 350,000 square feet — confront the persistent reality of electricity cost allocation that offloads the burden from larger players onto them.
Through the ICI, participating Class A customers pay a share of the global adjustment that’s prorated to their energy use during the five hours of the period from May 1 to April 30 when the highest overall system demand is recorded. This gives Class A customers the opportunity to lock in a favourable factor for calculating their share of monthly system-wide global adjustment costs if they can successful project and curtail energy loads during those five hours of peak demand. On the flipside, Class B customers pay the remainder of those system-wide costs, on a straightforward per-kWh basis, once Class A payments have been reconciled.
“Class B has sometimes been regarded as the forgotten middle child of the customer classes in Ontario where all the shifted costs in the system kind of pile up,” acknowledged Mark Olsheski, vice president, energy and environment, with Sussex Strategy Group. “Likewise, there can be big unpredictable and uncontrollable swings in the global adjustment rate from month to month and, outside of pure energy efficiency, there really is precious little opportunity or empowerment for a Class B customer to take actions to lower their bills.”
Nevertheless, COVID-19 presents a few extra hiccups for Class A customers this year. Conventionally, late May is when they receive notification of the cost allocation factor that would be used to determine their GA for the upcoming July 1 to June 30 period. This year, though, all current ICI participants will retain the factor they secured by responding to the five hours of peak demand during the 12 months from May 1, 2019 to April 30, 2020 after the Ontario government placed a temporary halt on the peak demand response aspect of the program last summer. Regardless, eligible ICI participants must formally opt into the program by June 15 or they will be billed as Class B customers.
Peak chasing resumes for summer 2021
Since peak demand hours conventionally occur from June to September, Class A customers will once again be studying forecasts intently and preparing to respond via Peak Perks as the heat wave season sets in. That should help alleviate some of the system stresses that arose last summer — prompting policy-makers to reject lobbying for a continued pause on peak demand response.
“The policy rationale was to allow consumers to focus on their operations when recovering from COVID as opposed to reducing peaks. The other issue was that we did not expect the peaks to be high last summer given COVID shutdowns,” Christie recounted. “But due to some hot weather, more people at home and also the lack of ICI response, we saw peaks we haven’t seen in many, many years come up last summer. So the peak hiatus has ended and this summer we’ll be back to responding to ICI as per normal.”
Among Class A customers, owners/managers of office and retail facilities generally have the most to lose from a billing formula tied to the energy demand of more densely occupied buildings in the summer of 2019. However, they could be much more competitively positioned for 2022-23 if their buildings remain below full occupancy and energy demand stays lower than usual this summer.
“Where we can improve is the IESO (Independent Electricity System Operator) and the LDCs (local distribution companies) need to help customers get their real-time data, especially in light of the phantom demand issue, interpret their bills and their Class A versus B scenarios much more easily and comprehensively,” urged Lee Hodgkinson, vice president, technical services, sustainability and ESG, with Dream Unlimited. “ I look for APIs (application programming interface) and direct data flow from the LDCs to the building owners so that we can access that data really easily.”
Given Class A’s historic advantages, few eligible ICI participants are expected to migrate out to Class B. From a sustainability perspective, there’s perhaps more cause to question how the ICI’s 1-MW threshold encourages strategies to move in the other direction.
“You could jack up demand in some buildings and get them into Class A basically by firing up the chillers on the weekend and then pouring cooling outside to get rid of it,” Douglas noted. “That has nothing to do with climate change strategy or sustainability, but it’s a cost- saving strategy, and, sometimes, when you look at the math, it’s hundreds of thousands of dollars you can save.”
Brian Hewson, vice president, consumer protection and industry performance with the Ontario Energy Board (OEB), confirmed the OEB is currently scrutinizing the discrepancy that leaves Class B as the only consumer group with no flexibility to curtail energy load during higher-priced periods, and will be providing advice to the Ministry of Energy. In the interim, that status does, at least, simplify tactics.
“Just reduce your kWh and it doesn’t matter what time of day because you’re paying that fixed rate for 24 hours a day. So if you can curb your demand at night, you get a big bang for your dollar,” Rouse advised.
“We do talk about rates a lot, but if you’re not using it, you’re not paying for it,” Flynn agreed. “A lot of our focus is still on really to try to reduce the number of kilowatts that we use. That seems to be the best thing to do.”
Related News