L.A.'s wind farm to generate energy for 56,000 homes

By Los Angeles Times


Substation Relay Protection Training

Our customized live online or in‑person group training can be delivered to your staff at your location.

  • Live Online
  • 12 hours Instructor-led
  • Group Training Available
Regular Price:
$699
Coupon Price:
$599
Reserve Your Seat Today
Los Angeles city leaders broke ground on a $425 million wind farm in the rugged Tehachapi Mountains that promises to generate enough energy to power 56,000 homes.

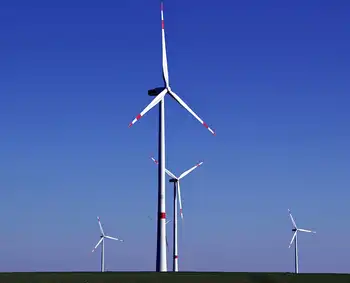
The 8,000-acre Pine Tree Wind Project, about 14 miles north of the High Desert community of Mojave, will have 80 wind turbine generators, each 400 feet tall, and be the largest city-owned wind farm in the nation when completed in about a year's time.

"We've said for some time that L.A. needs to be the greenest city in America," Mayor Antonio Villaraigosa said at the groundbreaking ceremony attended by about 150 people. "We are committed to giving kids a brighter future than the one handed to us."

The Pine Tree 120-megawatt wind farm will reduce carbon emissions equivalent to taking 35,000 cars off the road and bring Los Angeles' renewable energy to 13 percent of its total power production, officials said.

The mayor also announced plans for the adjacent Pine Canyon wind farm that will be built on 12,000 acres and generate 150 megawatts of energy, enough to power another 70,000 homes.

The mayor has set a goal for the Department of Water and Power to increase its use of renewable energy to 20 percent by 2010.

"We are creating electricity out of thin air," City Council President Eric Garcetti said. "We are creating green jobs and green energy with a sensitivity to the topography in Kern County. Pine Tree represents a new era of renewable energy for Angelenos."

The Pine Tree project entails erecting the wind turbines and construction of a high-voltage transmission line and the Barren Ridge electrical substation.

First approved in 2003, Pine Tree has been touted as a unique initiative for a public utility that would promote clean air by reducing the city's reliance on polluting power sources.

Originally scheduled to go online in 2004, the project was delayed by problems, including litigation, local opposition, and issues with environmental permitting.

The height of the turbines was lowered to address concerns of nearby military installations, such as Edwards Air Force Base, that did not want the structures to interfere with their airspace, officials said.

Environmental clearances have been obtained to proceed, and officials at the event said the project has the support of environmental groups, including the Natural Resources Defense Council, Sierra Club, and Union of Concerned Scientists.

"All this will be done with minimal encroachment on the environment," said Nick Patsaouras, president of the Board of Water and Power Commissioners.

But about a dozen protesters showed up at the event and silently held signs that said, "Save the Desert from Mayor Villaraigosa" and "Generate Power at Source of Need."

April Sall, preserve manager of The Wildlands Conservancy, said the group supports renewable energy, but not when transmission lines will bring harm to the environment.

"Energy has to be generated at the source of need, meaning in the urban centers and metropolitan areas so there's no need for transmission lines. It would be cheaper for ratepayers and cause less environmental damage," Sall said.

"The concern with the transmission lines is that they bisect natural areas and cause problems with migration and habitats of birds and other species."

In response, Villaraigosa cited the backing of the other environmental groups.

"I think it's important that we hear from all the parties. The Natural Resources Defense Council and others have all said this is a great and green project," the mayor said before taking a helicopter tour of the project site.

Related News

Western Canada drought impacting hydropower production as reservoirs run low

Western Canada Hydropower Drought strains British Columbia and Manitoba as reservoirs hit historic lows, cutting hydroelectric output and prompting power imports, natural gas peaking, and grid resilience planning amid climate change risks this winter.


Key Points

Climate-driven reservoir lows cut hydro in B.C. and Manitoba, prompting imports and backup gas to maintain reliability.

✅ Reservoirs at multi-year lows cut hydro generation capacity

✅ BC Hydro and Manitoba Hydro import electricity for reliability

✅ Natural gas turbines used; climate change elevates drought risk


Severe drought conditions in Western Canada are compelling two hydroelectricity-dependent provinces, British Columbia and Manitoba, to import power from other regions. These provinces, known for their reliance on hydroelectric power, are facing reduced electricity production due to low water levels in reservoirs this autumn and winter as energy-intensive customers encounter temporary connection limits.

While there is no immediate threat of power outages in either province, experts indicate that climate change is leading to more frequent and severe droughts. This trend places increasing pressure on hydroelectric power producers in the future, spurring interest in upgrading existing dams as part of adaptation strategies.

In British Columbia, several regions are experiencing "extreme" drought conditions as classified by the federal government. BC Hydro spokesperson Kyle Donaldson referred to these conditions as "historic," and a first call for power highlights the strain, noting that the corporation's large reservoirs in the north and southeast are at their lowest levels in many years.

To mitigate this, BC Hydro has been conserving water by utilizing less affected reservoirs and importing additional power from Alberta and various western U.S. states. Donaldson confirmed that these measures would persist in the upcoming months.

Manitoba is also facing challenges with below-normal levels in reservoirs and rivers. Since October, Manitoba Hydro has occasionally relied on its natural gas turbines to supplement hydroelectric production as electrical demand could double over the next two decades, a measure usually reserved for peak winter demand.

Bruce Owen, a spokesperson for Manitoba Hydro, reassured that there is no imminent risk of a power shortage. The corporation can import electricity from other regions, similar to how it exports clean energy in high-water years.

However, the cost implications are significant. Manitoba Hydro anticipates a financial loss for the current fiscal year, with more red ink tied to emerging generation needs, the second in a decade, with the previous one in 2021. That year, drought conditions led to a significant reduction in the company's power production capabilities, resulting in a $248-million loss.

The 2021 drought also affected hydropower production in the United States. The U.S. Department of Energy reported a 16% reduction in overall generation, with notable decreases at major facilities like Nevada's Hoover Dam, where production dropped by 25%.

Drought has long been a major concern for hydroelectricity producers, and they plan their operations with this risk in mind. Manitoba's record drought in 1940-41, for example, is a benchmark for Manitoba Hydro's operational planning to ensure sufficient electricity supply even in extreme low-water conditions.

Climate change, however, is increasing the frequency of such rare events, highlighting the need for more robust backup systems such as new turbine investments to enhance reliability. Blake Shaffer, an associate professor of economics at the University of Calgary specializing in electricity markets, emphasized the importance of hydroelectric systems incorporating the worsening drought forecasts due to climate change into their energy production planning.


Related News

View more

Garbage Truck Crash Knocks Down Power Poles in Little Haiti

Little Haiti Garbage Truck Power Outage in Miami after mechanical arms snagged power lines, snapping power poles; FPL crews, police, and businesses faced traffic delays, safety risks, and rapid restoration efforts across the neighborhood.


Key Points

A Miami incident where a garbage truck snagged power lines, toppling poles and causing outages and traffic delays.

✅ Mechanical arms caught overhead lines; three power poles snapped

✅ FPL dispatched, police directed traffic; restoration prioritized

✅ Dozens of businesses affected; afternoon rush hour congestion


On January 16, 2025, a significant incident unfolded in Miami's Little Haiti neighborhood when a garbage truck collided with power lines, causing three power poles to collapse and resulting in widespread power outages and traffic disruptions.

Incident Details

Around 1:30 p.m., a garbage truck traveling west on Northeast 82nd Street toward Interstate 95 became entangled with overhead power lines. The truck's mechanical arms caught the lines, leading to the snapping of three power poles and plunging the area into darkness, a scenario echoed by urban incidents like a manhole fire that left thousands without power. Witnesses reported a loud boom followed by an immediate power outage. One local business owner described the event, stating, "There was a loud boom, and suddenly the power went out."

Impact on the Community

The incident caused significant disruptions in the Little Haiti area. At least a dozen businesses were affected by the power outage, and in wider Florida events restoration can take weeks depending on damage, leading to operational halts and potential financial losses. The timing of the crash, during the afternoon rush hour, exacerbated traffic congestion as commuters were forced to navigate through the area, and similar disruptions occur when strong winds knock out power, further complicating the situation.

Response and Recovery Efforts

In response to the incident, Miami police directed traffic to alleviate congestion and ensure public safety. Florida Power & Light (FPL) crews, known for their major outage response, were promptly dispatched to the scene to assess the damage and begin restoration efforts. The priority was to safely remove the damaged power poles and restore electricity to the affected area. FPL's swift action was crucial in minimizing the duration of the power outage and restoring normalcy to the community.

Safety Considerations

This incident underscores the importance of safety protocols for vehicles operating in areas with overhead power lines. Garbage trucks, due to their design and operational mechanisms, are particularly susceptible to such accidents, and in broader disasters some regions require a power grid rebuild to recover, highlighting the stakes. It is imperative for operators to be vigilant and adhere to safety guidelines to prevent similar occurrences.

Community Resilience

Despite the challenges posed by the incident, the Little Haiti community demonstrated resilience. Local businesses and residents cooperated with authorities, while utilities elsewhere have restored power to thousands after major events, and the prompt response from emergency services highlighted the community's strength in the face of adversity.


Related News

View more

Texas Utilities back out of deal to create smart home electricity networks

Smart Meter Texas real-time pricing faces rollback as utilities limit on-demand reads, impacting demand response, home area networks, ERCOT wholesale tracking, and thermostat automation, reducing efficiency gains promised through deregulation and smart meter investments.


Key Points

A plan linking smart meters to ERCOT prices, enabling near real-time usage alignment and automated demand response.

✅ Twice-hourly reads miss 15-minute ERCOT price spikes.

✅ Less than 1% of 7.3M meters use HAN real-time features.

✅ Limits hinder automation for HVAC, EV charging, and pool pumps.


Utilities made a promise several years ago when they built Smart Meter Texas that they’d come up with a way for consumers to monitor their electricity use in real time. But now they’re backing out of the deal with the approval of state regulators, leaving in the lurch retail power companies that are building their business model on the promise of real time pricing and denying consumers another option for managing their electricity costs.

Texas utilities collected higher rates to finance the building of a statewide smart meter network that would allow customers to track their electricity use and the quickly changing prices on wholesale power markets almost as they happened. Some retailers are building electricity plans around this promise, providing customers with in-home devices that would eventually track pricing minute-by-minute and allow them to automatically turn down or shut off air conditioners, pool pumps and energy sucking appliances when prices spiked on hot summer afternoons and turn them back on when they prices fell again.

The idea is to help save consumers money by allowing them to shift their electricity consumption to periods when power is cheaper, typically nights and weekends, even as utility revenue in a free-power era remains a debated topic.

“We’re throwing away a large part of (what) ratepayers paid for,” said John Werner, CEO of GridPlus Texas, one of the companies offering consumers a real-time pricing plan that is scheduled to begin testing next month. “They made the smart meters dumb meters.”

When Smart Meter Texas was launched a decade ago by a consortium of the state’s biggest utilities, it was considered an important part of deregulation. The competitive market for electricity held the promise that consumers would eventually have the technology to control their electricity use through a home area network and cut their power bills.

Regulators and legislators also were enticed by the possibility of making the electric system more efficient and relieving pressure on the power grid as consumers responded to high prices and cut consumption when temperatures soared, with ongoing discussions about Texas grid reliability informing policy choices.

One study found that smart meters coupled with smart real time consumption monitors could reduce electricity use between 3 percent and 5 percent, according to Call Me Power, a website sponsored by the European electricity price shopping service Selectra.

But utilities complained that the home area network devices were expensive to install and not used very often, and, with flat electricity demand weighing on growth, they questioned further investment. CenterPoint manager Esther Floyd Kent filed an affidavit with the commission in May that it costs the utility about $30,000 annually to support the network devices, plus maintenance.

Over a six-year period, CenterPoint paid $124,500, or about $20,000 a year, to maintain the system. As of April, there were only 4,067 network devices in CenterPoint’s service area, meaning the utility pays about $30.70 each year to maintain each device.

Centerpoint last year generated $9.6 billion in revenues and earned a $1.8 billion profit, according to its financial filings. CenterPoint officials did not respond to requests for comment.

Other utilities that are part of the Smart Meter consortium also complained to the Public Utility Commission that, up to now, the system hasn’t developed. All told, Texas has 7.3 million meters connected to Smart Meter Texas, but less than 1 percent are using the networking functions to track real-time prices and consumption, according to the testimony of Donny R. Helm, director of technology strategy and architecture for the state’s largest utility Oncor Electric Delivery Co. in Dallas.

The isssue was resolved recently through a settlement agreement that limits on-demand readings to twice an hour that Smart Meter Texas must provide customers. The price of power changes every 15 minutes, so a twice an hour reading may miss some price spikes.

The Public Utility Commission signed off on the deal, and so did several other groups including several retail electricity providers and the Office of Public Utility Counsel which represents residential customers and small businesses.

Michele Gregg, spokeswoman for the Public Utility Counsel, testified in December that the consumer advocate supported the change because widespread use of the networks never materialized. Catherine Webking, an Austin lawyer who represents the Texas Energy Association for Marketers, a group of retail electric providers, said she believes the deal was a reasonable resolution of providing the benefits of Smart Meter Texas while not incurring too much cost.

But Griddy, an electricity provider that offers customers the opportunity to pay wholesale power prices, which also issued a plea to customers during a price surge, said the state hasn’t given the smart-meter networks a chance and could miss out on its potential. Griddy was counting on the continued adoption of real time pricing as the next step for customers wanting to control their electricity costs.

Right now, Griddy sends out price alerts from the grid operator Electric Reliability Council of Texas so businesses like hotels can run washers and dryers when electricity prices are cheapest. But the company was counting on a smart-meter program that would allow customers to track wholesale prices and manage consumption themselves, making Griddy’s offerings attractive to more people.

Wholesale prices are generally cheaper than retail prices, but they can fluctuate widely, especially when the Texas power grid faces another crisis during extreme weather. Last year, wholesale prices averaged less than 3 cents per kilowatt hour, much lower than than retail rates that now are running above 11 cents, but they can spike at times of high demand to as much as $9 a kilowatt hour.

What customers want is to be able to use energy when it’s cheapest, said Greg Craig, Griddy’s CEO, and they want to do it automatically. They want to be able to program their thermostat so that if the price rises they can shut off their air conditioning and if the price falls, they can charge their electric-powered vehicle.

Griddy customers may still save money even without real time data, he said. But they won’t be able to see their usage in real time or see how much they’re spending.

“The big utilities have big investments in the existing way and going to real time and more transparency isn’t really in their best interest,” said Craig.


Related News

View more

Solar PV and wind power in the US continue to grow amid favourable government plans

US Renewable Power Outlook 2030 projects surging capacity, solar PV and wind growth, grid modernization, and favorable tax credits, detailing market trends, CAGR, transmission expansion, and policy drivers shaping clean energy generation and consumption.


Key Points

A forecast of US power capacity, generation, and consumption, highlighting solar, wind, tax credits, and grid modernization.

✅ Targets 48.4% renewable capacity share by 2030

✅ Strong growth in solar PV and onshore wind installations

✅ Investment and tax credits drive grid and transmission upgrades


GlobalData’s latest report, ‘United States Power Market Outlook to 2030, Update 2021 – Market Trends, Regulations, and Competitive Landscape’ discusses the power market structure of the United States and provides historical and forecast numbers for capacity, generation and consumption up to 2030. Detailed analysis of the country’s power market regulatory structure, competitive landscape and a list of major power plants are provided. The report also gives a snapshot of the power sector in the country on broad parameters of macroeconomics, supply security, generation infrastructure, transmission and distribution infrastructure, about a quarter of U.S. electricity from renewables in recent years, electricity import and export scenario, degree of competition, regulatory scenario, and future potential. An analysis of the deals in the country’s power sector is also included in the report.

Renewable power held a 19% share of the US’s total power capacity in 2020, and in that year renewables became the second-most prevalent source in the U.S. electricity mix by generation; this share is expected to increase significantly to 48.4% by 2030. Favourable policies introduced by the US Government will continue to drive the country’s renewable sector, particularly solar photovoltaics (PV) and wind power, with wind now the most-used renewable source in the U.S. generation mix. Installed renewable capacity* increased from 16.5GW in 2000 to 239.2GW in 2020, growing at a compound annual growth rate (CAGR) of 14.3%. By 2030, the cumulative renewable capacity is expected to rise to 884.6GW, growing at a CAGR of 14% from 2020 to 2030. Despite increase in prices of renewable equipment, such as solar modules, in 2021, the US renewable sector will show strong growth during the 2021 to 2030 period as this increase in equipment prices are short term due to supply chain disruptions caused by the Covid-19 pandemic.

The expansion of renewable power capacity during the 2000 to 2020 period has been possible due to the introduction of federal schemes, such as Production Tax Credits, Investment Tax Credits and Manufacturing Tax Credits. These have massively aided renewable installations by bringing down the cost of renewable power generation and making it at par with power generated from conventional sources. Over the last few years, the cost of solar PV and wind power installations has declined sharply, and by 2023 wind, solar, and batteries made up most of the utility-scale pipeline across the US, highlighting investor confidence. Since 2010, the cost of utility-scale solar PV projects decreased by around 82% while onshore wind installations decreased by around 39%. This has supported the rapid expansion of the renewable market. However, the price of solar equipment has risen due to an increase in raw material prices and supply shortages. This may slightly delay the financing of some solar projects that are already in the pipeline.

The US will continue to add significant renewable capacity additions during the forecast period as industry outlooks point to record solar and storage installations over the coming years, to meet its target of reaching 80% clean energy by 2030. In November 2021, President Biden signed a $1tr Infrastructure Bill, within which $73bn is designated to renewables. This includes not just renewable capacity building, but also strengthening the country’s power grid and laying new high voltage transmission lines, both of which will be key to driving solar and wind power capacity additions as wind power surges in the U.S. electricity mix nationwide.

The US was one of the worst hit countries in the world due to the Covid-19 pandemic in 2020. With respect to the power sector, the electricity consumption in the country declined by 2.5% in 2020 as compared to 2019, even as renewable electricity surpassed coal in 2022 in the generation mix, highlighting continued structural change. Power plants that were under construction faced delays due to unavailability of components due to supply chain disruptions and unavailability of labour due to travel restrictions.

According to the US Energy Information Administration, 61 power projects, having a total capacity of 2.4GWm which were under construction during March and April 2020 were delayed because of the Covid-19 pandemic. Among renewable power technologies, solar PV and wind power projects were the most badly affected due to the pandemic.

In March and April 2020, 53 solar PV projects, having a total capacity of 1.3GW, and wind power projects, having a total capacity of 1.2GW, were delayed due to the Covid-19 pandemic. Moreover, several states suspended renewable energy auctions due to the pandemic.

For instance, New York State Energy Research and Development Authority (NYSERDA) had issued a new offshore wind solicitation for 1GW and up to 2.5GW in April 2020, but this was suspended due to the Covid-19 pandemic. In July 2020, the authority relaunched the tender for 2.5GW of offshore wind capacity, with a submission deadline in October 2020.

To ease the financial burden on consumers during the pandemic, more than 1,000 utilities in the country announced disconnection moratoria and implemented flexible payment plans. Duke Energy, American Electric Power, Dominion Power and Southern California Edison were among the major utilities that voluntarily suspended disconnections.


Related News

View more

Bitcoin consumes 'More electricity than Argentina' - Cambridge

Bitcoin energy consumption is driven by mining electricity demand, with TWh-scale power use, carbon footprint concerns, and Cambridge estimates. Rising prices incentivize more hardware; efficiency gains and renewables adoption shape sustainability outcomes.


Key Points

Bitcoin energy consumption is mining's electricity use, driven by price, device efficiency, and energy mix.

✅ Cambridge tool estimates ~121 TWh annual usage

✅ Rising BTC price incentivizes more mining hardware

✅ Efficiency, renewables, and costs shape footprint


"Mining" for the cryptocurrency is power-hungry, with power curtailments reported during heat waves, involving heavy computer calculations to verify transactions.

Cambridge researchers say it consumes around 121.36 terawatt-hours (TWh) a year - and is unlikely to fall unless the value of the currency slumps, even as Americans use less electricity overall.

Critics say electric-car firm Tesla's decision to invest heavily in Bitcoin undermines its environmental image.

The currency's value hit a record $48,000 (£34,820) this week. following Tesla's announcement that it had bought about $1.5bn bitcoin and planned to accept it as payment in future.

But the rising price offers even more incentive to Bitcoin miners to run more and more machines.

And as the price increases, so does the energy consumption, according to Michel Rauchs, researcher at The Cambridge Centre for Alternative Finance, who co-created the online tool that generates these estimates.

“It is really by design that Bitcoin consumes that much electricity,” Mr Rauchs told BBC’s Tech Tent podcast. “This is not something that will change in the future unless the Bitcoin price is going to significantly go down."

The online tool has ranked Bitcoin’s electricity consumption above Argentina (121 TWh), the Netherlands (108.8 TWh) and the United Arab Emirates (113.20 TWh) - and it is gradually creeping up on Norway (122.20 TWh).

The energy it uses could power all kettles used in the UK, where low-carbon generation stalled in 2019, for 27 years, it said.

However, it also suggests the amount of electricity consumed every year by always-on but inactive home devices in the US alone could power the entire Bitcoin network for a year, and in Canada, B.C. power imports have helped meet demand.

Mining Bitcoin
In order to "mine" Bitcoin, computers - often specialised ones - are connected to the cryptocurrency network.

They have the job of verifying transactions made by people who send or receive Bitcoin.

This process involves solving puzzles, which, while not integral to verifying movements of the currency, provide a hurdle to ensure no-one fraudulently edits the global record of all transactions.

As a reward, miners occasionally receive small amounts of Bitcoin in what is often likened to a lottery.

To increase profits, people often connect large numbers of miners to the network - even entire warehouses full of them, as seen with a Medicine Hat bitcoin operation backed by an electricity deal.

That uses lots of electricity because the computers are more or less constantly working to complete the puzzles, prompting some utilities to consider pauses on new crypto loads in certain regions.

The University of Cambridge tool models the economic lifetime of the world's Bitcoin miners and assumes that all the Bitcoin mining machines worldwide are working with various efficiencies.

Using an average electricity price per kilowatt hour ($0.05) and the energy demands of the Bitcoin network, it is then possible to estimate how much electricity is being consumed at any one time, though in places like China's power sector data can be opaque.


Related News

View more

During this Pandemic, Save Money - How To Better Understand Your Electricity Bill

Commercial Electric Tariffs explain utility rate structures, peak demand charges, kWh vs kW pricing, time-of-use periods, voltage, delivery, capacity ratchets, and riders, guiding facility managers in tariff analysis for accurate energy savings.


Key Points

Commercial electric tariffs define utility pricing for energy, demand, delivery, time-of-use periods, riders, and ratchet charges.

✅ Separate kWh charges from kW peak demand fees.

✅ Verify time-of-use windows and demand interval length.

✅ Review riders, capacity ratchets, and minimum demand clauses.


Especially during these tough economic times, as major changes to electric bills are debated in some states, facility executives who don’t understand how their power is priced have been disappointed when their energy projects failed to produce expected dollar savings. Here’s how not to be one of them.

Your electric rate is spelled out in a document called a “tariff” that can be downloaded from your utility’s web page. A tariff should clearly spell out the costs for each component that is part of your rate, reflecting cost allocation practices in your region. Don’t be surprised to learn that it contains a bunch of them. Unlike residential electric rates, commercial electric bills are not based solely on the quantity of kilowatt-hours (kWh) consumed in a billing period (in the United States, that’s a month). Instead, different rates may apply to how your power is supplied, how it is delivered via electricity delivery charges, when it was consumed, its voltage, how fast it was used (in kW), and other factors.

If a tariff’s lingo and word structure are too opaque, spend some time with a utility account rep to translate it. Many state utility commissions also have customer advocates that may assist as they explore new utility rate designs that affect customers. Alternatively, for a fee, facility managers can privately chat with an energy consultant.

Common mistakes

Many facility managers try to estimate savings based on an averaged electric rate, i.e., annual electric spend divided by annual kWh. However, in markets where electricity demand is flat, such a number may obscure the fastest rising cost component: monthly peak demand charges, measured in dollars per kW (or kilo-volt-amperes, kVA).

This charge is like a monthly speeding ticket, based solely on the highest speed you drove during that time. In some areas, peak demand charges now account for 30 to 60 percent of a facility’s annual electric spend. When projecting energy cost savings, failing to separately account for kW peak demand and kWh consumption may result in erroneous results, and a lot of questions from the C-suite.

How peak demand charges are calculated varies among utilities. Some base it on the highest average speed of use across one hour in a month, while others may use the highest average speed during a 15- or 30-minute period. Others may average several of the highest speeds within a defined time period (for example, 8 a.m. to 6 p.m. on weekdays). It is whatever your tariff says it is.

Because some power-consuming (or producing) devices, including those tied to smart home electricity networks, vary in their operation or abilities, they may save money on a few — but not all — of those rate components. If an equipment vendor calculates savings from its product by using an average electric rate, take pause. Tell the vendor to return after the proposal has been redone using tariff-based numbers.

When a vendor is the only person calculating potential savings from using a product, there’s also a built-in conflict of interest: The person profiting from an equipment sale should not also be the one calculating its expected financial return. Before signing any energy project contracts, it’s essential that someone independent of the deal reviews projected savings. That person (typically an energy or engineering consultant) should be quite familiar with your facility’s electric tariff, including any special provisions, riders, discounts, etc., that may pertain. When this doesn’t happen, savings often don’t occur as planned. 

For example, some utilities add another form of demand charge, based on the highest kW in a year. It has various names: capacity, contract demand, or the generic term “ratchet charge.” Some utilities also have a minimum ratchet charge which may be based on a percent of a facility’s annual kW peak. It ensures collection of sufficient utility revenue to cover the cost of installed transmission and distribution even when a customer significantly cuts its peak demand.


Related News

View more

Sign Up for Electricity Forum’s Newsletter

Stay informed with our FREE Newsletter — get the latest news, breakthrough technologies, and expert insights, delivered straight to your inbox.

Electricity Today T&D Magazine Subscribe for FREE

Stay informed with the latest T&D policies and technologies.
  • Timely insights from industry experts
  • Practical solutions T&D engineers
  • Free access to every issue

Live Online & In-person Group Training

Advantages To Instructor-Led Training – Instructor-Led Course, Customized Training, Multiple Locations, Economical, CEU Credits, Course Discounts.

Request For Quotation

Whether you would prefer Live Online or In-Person instruction, our electrical training courses can be tailored to meet your company's specific requirements and delivered to your employees in one location or at various locations.