The high price of burying lines

By The Commercial Appeal


Protective Relay Training - Basic

Our customized live online or in‑person group training can be delivered to your staff at your location.

  • Live Online
  • 12 hours Instructor-led
  • Group Training Available
Regular Price:
$699
Coupon Price:
$599
Reserve Your Seat Today
Buried at least 42 inches in the soil of Shelby County, close to 2,500 miles of electric distribution cables snake under lawns, sidewalks and streets.

But it's the 4,200 miles of overhead electric lines that get the attention of most Memphis Light, Gas and Water Division customers, especially when a tree crashes down and cuts their electricity.

After back-to-back storms this year that each knocked out power to more than 60,000 MLGW customers, local utility officials have been hit with an age-old question:

Why not bury MLGW's existing overhead electric infrastructure to prevent future outages from storms and winds?

MLGW has fielded dozens of such inquiries from customers and reporters since tornadoes barreled through town Feb. 5, leaving some customers without power for as long as five days.

The bottom line, according to MLGW, is cost.

After the windstorm dubbed "Hurricane Elvis" slammed Memphis in 2003, utility officials put the price tag of burying its existing overhead electric lines at "in excess of $1 billion."

MLGW officials now say it would cost in the "$5 billion range" to put all electric lines underground - the equivalent of about 20 FedExForums.

Over a 30-year period, MLGW would have to spend about $166 million a year on underground electric system infrastructure, compared to the roughly $70 million paid now to maintain overhead lines, said Alonzo Weaver, MLGW's vice president of engineering and operations.

Furthermore, Weaver said MLGW believes the life span of an underground system would be about 30 years, compared to the 50-year life of an overhead system. So once the underground system is paid for after 30 years, MLGW would have to start paying for it again.

"What we try to do is strike a balance," Weaver said. "...We look at our standards. We try to put in the best system that we can put in for the money and try to provide the best reliability we can for the money."

In maintaining its overhead system, MLGW spends about $9 million a year on tree trimming, which has increased by about $3 million over the past five years.

Industry officials say there are some benefits to going underground.

There are the aesthetics of not having power lines crisscross the city, which has been a central argument since Lady Bird Johnson started pushing for the "beautification" of America in the 1960s and targeted overhead electric lines.

In addition, power outages from storms are less frequent when lines are underground. But outages indeed occur with underground lines - whether they stem from equipment failure, water seepage or animals that eat through cables - and those outages often take longer to diagnose and repair.

But the expense of installing underground lines, which can be almost 10 times the cost of new overhead power lines, is the major factor nationwide in whether utilities bury existing lines, said Mike Hyland, vice president of engineering at the American Public Power Association.

Every city in the country, he said, struggles with this issue.

"The question always comes up right after storms, because people don't care about cost right now. They want their juice flowing. They want their refrigerator on. They want their heater on, and all they're caring about is 'do whatever it takes to get me electricity,'" he said.

"... Underground has its value and has its good side. But don't believe the hype that it's the greatest thing since sliced bread."

Still, as new subdivisions spring up across Shelby County, miles of underground electric cables are being installed.

In 1996, MLGW started requiring that low-voltage service lines extending to individual homes in new subdivisions be installed underground and offered incentives to developers to promote the underground installation of high-voltage "primary" lines, which was done in response to the devastating ice storm of 1994.

Just over one-third of MLGW's roughly 6,700 miles of electric distribution lines are now underground.

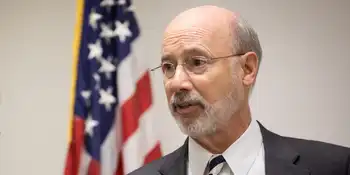
City Councilman Bill Morrison, who is vice chairman of the council's MLGW committee, said, aesthetically, he'd like to see MLGW bury all its existing power lines.

But he said the capital cost - which would be passed along to customers through higher utility rates - may be too great an obstacle.

"We really don't want to do that," Morrison said of raising rates for such a project. "We're making it more and more difficult to live in the city."

Related News

Neste increases the use of wind power at its Finnish production sites to nearly 30%

Neste wind power agreement boosts renewable electricity in Finland, partnering with Ilmatar and Fortum to supply Porvoo and Naantali sites, cutting Scope 2 emissions and advancing a 2035 carbon-neutral production target via long-term PPAs.


Key Points

A PPA to source wind power for sites, cutting Scope 2 emissions and supporting Neste's 2035 carbon-neutral goal.

✅ 10-year PPA with Ilmatar; + Fortum boosts renewable electricity share.

✅ Supplies ~7% of Porvoo-Naantali electricity; capacity >20 MW.

✅ Cuts Scope 2 emissions by ~55 kt CO2e per year toward 2035 neutrality.


Neste is committed to reaching carbon neutral production by 2035, mirroring efforts such as Olympus 100% renewable electricity commitments across industry.

As part of this effort, the company is increasing the use of renewable electricity at its production sites in Finland, reflecting trends such as Ireland's green electricity targets across Europe, and has signed a wind power agreement with Ilmatar, a wind power company. The agreement has been made together with Borealis, Neste's long-term partner in the Kilpilahti area in Porvoo, Finland.

As a result of the agreement with Ilmatar, as well as that signed with Fortum at the end of 2019, and in line with global growth such as Enel's 450 MW wind project in the U.S., nearly 30% of the energy used at Neste's production sites in Porvoo and Naantali will be renewable wind power in 2022.

'Neste's purpose is to create a healthier planet for our children. Our two climate commitments play an important role in living up to this ambition, and one of them is to reach carbon neutral production by 2035. It is an enormous challenge and requires several concrete measures and investments, including innovations like offshore green hydrogen initiatives. Wind power, including advances like UK offshore wind projects, is one of the over 70 measures we have identified to reduce our production's greenhouse gas emissions,' Neste's President and CEO Peter Vanacker says.

With the ten year contract, Neste is committed to purchase about one-third of the production of Ilmatar's two wind farms, reflecting broader market moves such as BC Hydro wind deals in Canada. The total capacity of the agreement is more than 20 MW, and the energy produced will correspond to around 7% of the electricity consumption at Neste's sites in Porvoo and Naantali. The wind power deliveries are expected to begin in 2022.

The two wind power agreements help Neste to reduce the indirect greenhouse gas emissions (Scope 2 emissions defined by the Greenhouse Gas Protocol) of electricity purchases at its Finnish production sites, a trend mirrored by Dutch green electricity growth across Europe, annually by approximately 55 kilotons. 55 kt/a CO2e equals annual carbon footprint of more than 8,500 EU citizens.


Related News

View more

Minnesota Power energizes Great Northern Transmission Line

Great Northern Transmission Line delivers 250 MW of carbon-free hydropower from Manitoba Hydro, strengthening Midwest grid reliability, enabling wind storage balancing, and advancing Minnesota Power's EnergyForward strategy for cleaner, renewable energy across the region.


Key Points

A 500 kV cross-border line delivering 250 MW of carbon-free hydropower, strengthening reliability and enabling renewables.

✅ 500 kV, 224-mile line from Manitoba to Minnesota

✅ Delivers 250 MW hydropower via ALLETE-Minnesota Power

✅ Enables wind storage and grid balancing with Manitoba Hydro


Minnesota Power, a utility division of ALLETE Inc. (NYSE:ALE), has energized its Great Northern Transmission Line, bringing online an innovative delivery and storage system for renewable energy that spans two states and one Canadian province, similar to the Maritime Link project in Atlantic Canada.

The 500 kV line is now delivering 250 megawatts of carbon-free hydropower from Manitoba, Canada, to Minnesota Power customers.

Minnesota Power completed the Great Northern Transmission Line (GNTL) in February 2020, ahead of schedule and under budget. The 224-mile line runs from the Canadian border in Roseau County to a substation near Grand Rapids, Minnesota. It consists of 800 tower structures which were fabricated in the United States and used 10,000 tons of North American steel. About 2,200 miles of wire were required to install the line's conductors. The GNTL also is contributing significant property tax revenue to local communities along the route.

"This is such an incredible achievement for Minnesota Power, ALLETE, and our region, and is the culmination of a decade-long vision brought to life by our talented and dedicated employees," said ALLETE President and CEO Bethany Owen. "The GNTL will help Minnesota Power to provide our customers with 50 percent renewable energy less than a year from now. As part of our EnergyForward strategy, it also strengthens the grid across the Midwest and in Canada, enhancing reliability for all of our customers."

With the GNTL energized and connected to Manitoba Hydro's recently completed Manitoba-Minnesota Transmission Project at the border, the companies now have a unique "wind storage" mechanism that quickly balances energy supply and demand in Minnesota and Manitoba, and enables a larger role for renewables in the North American energy grid.

The GNTL and its delivery of carbon-free hydropower are important components of Minnesota Power's EnergyForward strategy to transition away from coal and add renewable power sources while maintaining reliable and affordable service for customers, echoing interties like the Maritime Link that facilitate regional power flows. It also is part of a broader ALLETE strategy to advance and invest in critical regional transmission and distribution infrastructure, such as the TransWest Express transmission project, to ensure grid integrity and enable cleaner energy to reduce carbon emissions.

"The seed for this renewable energy initiative was planted in 2008 when Minnesota Power proposed purchasing 250 megawatts of hydropower from Manitoba Hydro. Beyond the transmission line, it also included a creative asset swap to move wind power from North Dakota to Minnesota, innovative power purchase agreements, and a remarkable advocacy process to find an acceptable route for the GNTL," said ALLETE Executive Chairman Al Hodnik. "It marries wind and water in a unique connection that will help transform the energy landscape of North America and reduce carbon emissions related to the existential threat of climate change."

Minnesota Power and Manitoba Hydro, a provincial Crown Corporation, coordinated on the project from the beginning, navigating National Energy Board reviews along the way. It is based on the companies' shared values of integrity, environmental stewardship and community engagement.

"The completion of Minnesota Power's Great Northern Transmission Line and our Manitoba-Minnesota Transmission Project is a testament to the creativity, perseverance, cooperation and skills of hundreds of people over so many years on both sides of the border," said Jay Grewal, president and CEO of Manitoba Hydro. "Perhaps even more importantly, it is a testament to the wonderful, longstanding relationship between our two companies and two countries. It shows just how much we can accomplish when we all work together toward a common goal."

Minnesota Power engaged federal, state and local agencies; the sovereign Red Lake Nation and other tribes, reflecting First Nations involvement in major transmission planning; and landowners along the proposed routes beginning in 2012. Through 75 voluntary meetings and other outreach forums, a preferred route was selected with strong support from stakeholders that was approved by the Minnesota Public Utilities Commission in April 2016.

A four-year state and federal regulatory process culminated in late 2016 when the federal Department of Energy approved a Presidential Permit for the GNTL, similar to the New England Clean Power Link process, needed because of the international border crossing. Construction of the line began in early 2017.

"A robust stakeholder process is essential to the success of any project, but especially when building a project of this scope," Owen said. "We appreciated the early engagement and support from stakeholders, local communities and tribes, agencies and regulators through the many approval milestones to the completion of the GNTL."


Related News

View more

U.S. Electricity and natural gas prices explained

Energy Pricing Factors span electricity generation, transmission, and distribution costs, plus natural gas supply-demand, renewables, seasonal peaks, and wholesale pricing effects across residential, commercial, and industrial customers, usage patterns, weather, and grid constraints.


Key Points

They are the costs and market forces driving electricity and natural gas prices, from generation to delivery and demand.

✅ Generation, transmission, distribution shape electricity rates

✅ Gas prices hinge on supply, storage, imports/exports

✅ Demand shifts: weather, economy, and fuel alternatives


There are a lot of factors that affect energy prices globally. What’s included in the price to heat homes and supply them with electricity may be a lot more than some people may think.

Electricity
Generating electricity is the largest component of its price, according to the U.S. Energy Information Administration (EIA). Generation accounts for 56% of the price of electricity, while distribution and transmission account for 31% and 13% respectively.

Homeowners and businesses pay more for electricity than industrial companies, and U.S. electricity prices have recently surged, highlighting broader inflationary pressures. This is because industrial companies can take electricity at higher voltages, reducing transmission costs for energy companies.

“Industrial consumers use more electricity and can receive it at higher voltages, so supplying electricity to these customers is more efficient and less expensive. The price of electricity to industrial customers is generally close to the wholesale price of electricity,” EIA explains.

NYSEG said based on the average use of 600 kilowatt-hours per month, its customers spent the most money on delivery and transition charges in 2020, 57% or about $42, and residential electricity bills increased 5% in 2022 after inflation, according to national data. They also spent on average 35% (~$26) on supply charges and 8% (~$6) on surcharges.

Electricity prices are usually higher in the summer. Why? Because energy companies use sources of electricity that cost more money. It used to be that renewable sources, like solar and wind, were the most expensive sources of energy but increased technological advances have changed this, according to the International Energy Agency’s 2021 World Energy Outlook.

“In most markets, solar PV or wind now represents the cheapest available source of new electricity generation. Clean energy technology is becoming a major new area for investment and employment – and a dynamic arena for international collaboration and competition,” the report said.

Natural gas
The price of natural gas is driven by supply and demand. If there is more supply, prices are generally lower. If there is not as much supply, prices are generally higher the EIA explains. On the other side of the equation, more demand can also increase the price and less demand can decrease the price.

High natural gas prices mean people turn their home thermostats down a few degrees to save money, so the EIA said reduced demand can encourage companies to produce more natural gas, which would in turn help lower the cost. Lower prices will sometimes cause companies to reduce their production, therefore causing the price to rise.

The three major supply factors that affect prices: the amount of natural gas produced, how much is stored, and the volume of gas imported and exported. The three major demand factors that affect price are: changes in winter/summer weather, economic growth, and the broader energy crisis dynamics, as well as how much other fuels are available and their price, said EIA.

To think the price of natural gas is higher when the economy is thriving may sound counterintuitive but that’s exactly what happens. The EIA said this is because of increases in demand.


Related News

View more

Are Norwegian energy firms ‘best in class’ for environmental management?

CO2 Tax for UK Offshore Energy Efficiency can accelerate adoption of aero-derivative gas turbines, flare gas recovery, and combined cycle power, reducing emissions on platforms like Equinor's Mariner and supporting net zero goals.


Key Points

A carbon price pushing operators to adopt efficient turbines, flare recovery, and combined cycle to cut emissions.

✅ Aero-derivative turbines beat industrial units on efficiency

✅ Flare gas recovery cuts routine flaring and fuel waste

✅ Combined cycle raises efficiency and lowers emissions


By Tom Baxter

The recent Energy Voice article from the Equinor chairman concerning the Mariner project heralding a ‘significant point of reference’ for growth highlighted the energy efficiency achievements associated with the platform.

I view energy efficiency as a key enabler to net zero, and alongside this the UK must start large-scale storage to meet system needs; it is a topic I have been involved with for many years.

As part of my energy efficiency work, I investigated Norwegian practices and compared them with the UK.

There were many differences, here are three;


1. Power for offshore installations is usually supplied from gas turbines burning fuel from the oil and gas processing plant, and even as the UK's offshore wind supply accelerates, installations convert that to electricity or couple the gas turbine to a machine such as a gas compressor.

There are two main generic types of gas turbine – aero-derivative and industrial. As the name implies aero-derivatives are aviation engines used in a static environment. Aero-derivative turbines are designed to be energy efficient as that is very import for the aviation industry.

Not so with industrial type gas turbines; they are typically 5-10% less efficient than a comparable aero-derivative.

Industrial machines do have some advantages – they can be cheaper, require less frequent maintenance, they have a wide fuel composition tolerance and they can be procured within a shorter time frame.

My comparison showed that aero-derivative machines prevailed in Norway because of the energy efficiency advantages – not the case in the UK where there are many more offshore industrial gas turbines.

Tom Baxter is visiting professor of chemical engineering at Strathclyde University and a retired technical director at Genesis Oil and Gas Consultants


2. Offshore gas flaring is probably the most obvious source of inefficient use of energy with consequent greenhouse gas emissions.

On UK installations gas is always flared due to the design of the oil and gas processing plant.

Though not a large quantity of gas, a continuous flow of gas is routinely sent to flare from some of the process plant.

In addition the flare requires pilot flames to be maintained burning at all times and, while Europe explores electricity storage in gas pipes, a purge of hydrocarbon gas is introduced into the pipes to prevent unsafe air ingress that could lead to an explosive mixture.

On many Norwegian installations the flare system is designed differently. Flare gas recovery systems are deployed which results in no flaring during continuous operations.

Flare gas recovery systems improve energy efficiency but they are costly and add additional operational complexity.


3. Returning to gas turbines, all UK offshore gas turbines are open cycle – gas is burned to produce energy and the very hot exhaust gases are vented to the atmosphere. Around 60 -70% of the energy is lost in the exhaust gases.

Some UK fields use this hot gas as a heat source for some of the oil and gas treatment operations hence improving energy efficiency.

There is another option for gas turbines that will significantly improve energy efficiency – combined cycle, and in parallel plans for nuclear power under the green industrial revolution aim to decarbonise supply.

Here the exhaust gases from an open cycle machine are taken to a separate turbine. This additional turbine utilises exhaust heat to produce steam with the steam used to drive a second turbine to generate supplementary electricity. It is the system used in most UK power stations, even as UK low-carbon generation stalled in 2019 across the grid.

Open cycle gas turbines are around 30 – 40% efficient whereas combined cycle turbines are typically 50 – 60%. Clearly deploying a combined cycle will result in a huge greenhouse gas saving.

I have worked on the development of many UK oil and gas fields and combined cycle has rarely been considered.

The reason being is that, despite the clear energy saving, they are too costly and complex to justify deploying offshore.

However that is not the case in Norway where combined cycle is used on Oseberg, Snorre and Eldfisk.

What makes the improved Norwegian energy efficiency practices different from the UK – the answer is clear; the Norwegian CO2 tax.

A tax that makes CO2 a significant part of offshore operating costs.

The consequence being that deploying energy efficient technology is much easier to justify in Norway when compared to the UK.

Do we need a CO2 tax in the UK to meet net zero – I am convinced we do. I am in good company. BP, Shell, ExxonMobil and Total are supporting a carbon tax.

Not without justification there has been much criticism of Labour’s recent oil tax plans, alongside proposals for state-owned electricity generation that aim to reshape the power market.

To my mind Labour’s laudable aims to tackle the Climate Emergency would be much better served by supporting a CO2 tax that complements the UK's coal-free energy record by strengthening renewable investment.


Related News

View more

Toronto Prepares for a Surge in Electricity Demand as City Continues to Grow

Toronto Electricity Demand Growth underscores IESO projections of rising peak load by 2050, driven by population growth, electrification, new housing density, and tech economy, requiring grid modernization, transmission upgrades, demand response, and local renewable energy.


Key Points

It refers to the projected near-doubling of Toronto's peak load by 2050, driven by electrification and urban growth.

✅ IESO projects peak demand nearly doubling by 2050

✅ Drivers: population, densification, EVs, heat pumps

✅ Solutions: efficiency, transmission, storage, demand response


Toronto faces a significant challenge in meeting the growing electricity needs of its expanding population and ambitious development plans. According to a new report from Ontario's Independent Electricity System Operator (IESO), Toronto's peak electricity demand is expected to nearly double by 2050. This highlights the need for proactive steps to secure adequate electricity supply amidst the city's ongoing economic and population growth.


Key Factors Driving Demand

Several factors are contributing to the projected increase in electricity demand:

Population Growth: Toronto is one of the fastest-growing cities in North America, and this trend is expected to continue. More residents mean more need for housing, businesses, and other electricity-consuming infrastructure.

  • New Homes and Density: The city's housing strategy calls for 285,000 new homes within the next decade, including significant densification in existing neighbourhoods. High-rise buildings in urban centers are generally more energy-intensive than low-rise residential developments.
  • Economic Development: Toronto's robust economy, a hub for tech and innovation, attracts new businesses, including energy-intensive AI data centers that fuel further demand for electricity.
  • Electrification: The push to reduce carbon emissions is driving the electrification of transportation and home heating, further increasing pressure on Toronto's electricity grid.


Planning for the Future

Ontario and the City of Toronto recognize the urgency to secure stable and reliable electricity supplies to support continued growth and prosperity without sacrificing affordability, drawing lessons from British Columbia's clean energy shift to inform local approaches. Officials are collaborating to develop a long-term plan that focuses on:

  • Energy Efficiency: Efforts aim to reduce wasteful electricity usage through upgrades to existing buildings, promoting energy-efficient appliances, and implementing smart grid technologies. These will play a crucial role in curbing overall demand.
  • New Infrastructure: Significant investments in building new electricity generation, transmission lines, and substations, as well as regional macrogrids to enhance reliability, will be necessary to meet the projected demands of Toronto's future.
  • Demand Management: Programs incentivizing energy conservation during peak hours will help to avoid strain on the grid and reduce the need to build expensive power plants only used at peak demand times.


Challenges Ahead

The path ahead isn't without its hurdles.  Building new power infrastructure in a dense urban environment like Toronto can be time-consuming, expensive, and sometimes disruptive, especially as grids face harsh weather risks that complicate construction and operations. Residents and businesses might worry about potential rate increases required to fund these necessary investments.


Opportunity for Innovation

The IESO and the city view the situation as an opportunity to embrace innovative solutions. Exploring renewable energy sources within and near the city, developing local energy storage systems, and promoting distributed energy generation such as rooftop solar, where power is created near the point of use, are all vital strategies for meeting needs in a sustainable way.

Toronto's electricity future depends heavily on proactive planning and investment in modernizing its power infrastructure.  The decisions made now will determine whether the city can support economic growth, address climate goals and a net-zero grid by 2050 ambition, and ensure that lights stay on for all Torontonians as the city continues to expand.


Related News

View more

Electric vehicle sales triple in Australia despite lack of government support

Australian Electric Vehicle Sales tripled in 2019 amid expanding charging infrastructure and more models, but market share remains low, constrained by limited government policy, weak incentives, and absent emissions standards despite growing ultra-fast chargers.


Key Points

EV units sold in Australia; in 2019 they tripled to 6,718, but market share was just 0.6%.

✅ Sales rose from 2,216 (2018) to 6,718 (2019); ~80% were BEVs.

✅ Public charging sites reached 2,307; fast chargers up 40% year-on-year.

✅ Policy gaps and absent standards limit model supply and EV uptake.


Sales of electric vehicles in Australia tripled in 2019 despite a lack of government support, according to the industry’s peak body.

The country’s network of EV charging stations was also growing, the Electric Vehicle Council’s annual report found, including a rise in the number of faster charging stations that let drivers recharge a car in about 15 minutes.

But the report, released on Wednesday, found the market share for electric vehicles was still only 0.6% of new vehicle sales – well behind the 2.5% to 5% in other developed countries.

The chief executive of the council, Behyad Jafari, said the rise in sales was down to more models becoming available. There are now 28 electric models on sale, with eight priced below $65,000.

Six more were due to arrive before the end of 2021, including two priced below $50,000, the council’s report said.

“We have repeatedly heard from car companies that they were planning to bring vehicles here, but Australia doesn’t have that policy support.”

The Morrison government promised a national electric vehicle strategy would be finalised by the middle of this year, but the policy has been delayed. The prime minister, Scott Morrison, last year accused Labor of wanting to “end the weekend” and force people out of four-wheel drives after the opposition set a target of 50% of new car sales being electric by 2030.

Jafari cited the Kia e-Niro – an award-winning electric SUV that was being prepared for an Australian launch, but is now reportedly on hold because the manufacturer favoured shipping to countries with emissions standards.

The council’s members include BMW, Nissan, Hyundai and Harley Davidson, as well as energy, technology and charging infrastructure companies.

Sales of electric vehicles – which include plug-in hybrids – went from 2,216 in 2018 to 6,718 in 2019, the report said. Jafari said about 80% of those sales were all-electric vehicles.

There have been 3,226 electric vehicles sold in 2020, the report said, despite an overall drop of 20% in vehicle sales due to the Covid-19 pandemic, while U.S. EV sales have surged into 2024.

Jafari said: “Our report is showing that Australian consumers want these cars.

“There is no controversy that the future of the industry is electric, but at the moment the industry is looking at different markets. We want policies that show [Australia] is going on this journey.”

Government agency data has forecast that half the new cars sold will be electric by 2035, underscoring that the age of electric cars is arriving even if there is no policy to support their uptake.

Manufacturers currently selling electric cars in Australia are Nissan, Hyundai, Mitsubishi, Tesla, Volvo, Porsche, Audi, BMW, Mercedes, Jaguar and Renault, the report said.

Jafari said most G20 countries had emissions standards in place for vehicles sold and incentives in place to support electric vehicles, such as rebates or exemptions from charges. This hadn’t happened in Australia, he said.

The report said: “Globally, carmakers are rolling out more electric vehicle models as the electric car market expands, but so far production cannot keep up with demand. This means that without policy signals, Australians will continue to be denied access to the full global range of electric vehicles.”

On Tuesday, one Australian charging provider, Evie Networks, opened an ultra-fast station at a rest stop at Campbell Town in Tasmania – between Launceston and Hobart.

The company said the station would connect EV owners in the state’s north and south and the two 350kW chargers could recharge a vehicle in 15 minutes, highlighting whether grids have the power to charge EVs at scale. Two more sites were planned for Tasmania, the company said.

A Tasmanian government grant to support electric vehicle charging had helped finance the site. Evie was also supported with a $15m grant from the federal government’s Australian Renewable Energy Agency.

According to the council report, Australia now has 2,307 public charging stations, including 357 fast chargers – a rise of 40% in the past year.

A survey of 2,900 people in New South Wales, the ACT, Victoria and South Australia, carried out by NRMA, RACV and RAA on behalf of the council, found the main barriers to buying an electric vehicle were concerns over access to charging points, higher prices and uncertainty over driving range.

Consumers favoured electric vehicles because of their environmental footprint, lower maintenance costs and vehicle performance.

The report said the average battery range of electric vehicles available in Australia was 400km, but almost 80% of people thought the average was less.

According to the survey, 56% of Australians would consider an electric car when they next bought a vehicle, and in the UK, EV inquiries soared during a fuel supply crisis.

“We are far behind, but it is surmountable,” Jafari said.

The council report also rated state and territories on the policies that supported its industry and found the ACT was leading, followed by NSW and Queensland.

A review of commercial electric vehicle use found public electric bus trials were planned or under way in Queensland, NSW, WA, Victoria and ACT. There are now more than 400,000 electric buses in use around the globe.


Related News

View more

Sign Up for Electricity Forum’s Newsletter

Stay informed with our FREE Newsletter — get the latest news, breakthrough technologies, and expert insights, delivered straight to your inbox.

Electricity Today T&D Magazine Subscribe for FREE

Stay informed with the latest T&D policies and technologies.
  • Timely insights from industry experts
  • Practical solutions T&D engineers
  • Free access to every issue

Download the 2025 Electrical Training Catalog

Explore 50+ live, expert-led electrical training courses –

  • Interactive
  • Flexible
  • CEU-cerified