The high price of burying lines

By The Commercial Appeal


NFPA 70e Training

Our customized live online or in‑person group training can be delivered to your staff at your location.

  • Live Online
  • 6 hours Instructor-led
  • Group Training Available
Regular Price:
$199
Coupon Price:
$149
Reserve Your Seat Today
Buried at least 42 inches in the soil of Shelby County, close to 2,500 miles of electric distribution cables snake under lawns, sidewalks and streets.

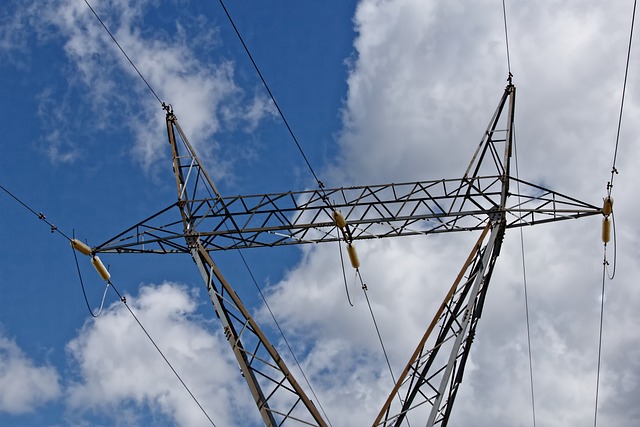
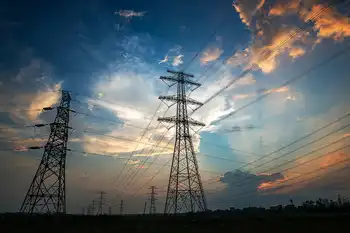
But it's the 4,200 miles of overhead electric lines that get the attention of most Memphis Light, Gas and Water Division customers, especially when a tree crashes down and cuts their electricity.

After back-to-back storms this year that each knocked out power to more than 60,000 MLGW customers, local utility officials have been hit with an age-old question:

Why not bury MLGW's existing overhead electric infrastructure to prevent future outages from storms and winds?

MLGW has fielded dozens of such inquiries from customers and reporters since tornadoes barreled through town Feb. 5, leaving some customers without power for as long as five days.

The bottom line, according to MLGW, is cost.

After the windstorm dubbed "Hurricane Elvis" slammed Memphis in 2003, utility officials put the price tag of burying its existing overhead electric lines at "in excess of $1 billion."

MLGW officials now say it would cost in the "$5 billion range" to put all electric lines underground - the equivalent of about 20 FedExForums.

Over a 30-year period, MLGW would have to spend about $166 million a year on underground electric system infrastructure, compared to the roughly $70 million paid now to maintain overhead lines, said Alonzo Weaver, MLGW's vice president of engineering and operations.

Furthermore, Weaver said MLGW believes the life span of an underground system would be about 30 years, compared to the 50-year life of an overhead system. So once the underground system is paid for after 30 years, MLGW would have to start paying for it again.

"What we try to do is strike a balance," Weaver said. "...We look at our standards. We try to put in the best system that we can put in for the money and try to provide the best reliability we can for the money."

In maintaining its overhead system, MLGW spends about $9 million a year on tree trimming, which has increased by about $3 million over the past five years.

Industry officials say there are some benefits to going underground.

There are the aesthetics of not having power lines crisscross the city, which has been a central argument since Lady Bird Johnson started pushing for the "beautification" of America in the 1960s and targeted overhead electric lines.

In addition, power outages from storms are less frequent when lines are underground. But outages indeed occur with underground lines - whether they stem from equipment failure, water seepage or animals that eat through cables - and those outages often take longer to diagnose and repair.

But the expense of installing underground lines, which can be almost 10 times the cost of new overhead power lines, is the major factor nationwide in whether utilities bury existing lines, said Mike Hyland, vice president of engineering at the American Public Power Association.

Every city in the country, he said, struggles with this issue.

"The question always comes up right after storms, because people don't care about cost right now. They want their juice flowing. They want their refrigerator on. They want their heater on, and all they're caring about is 'do whatever it takes to get me electricity,'" he said.

"... Underground has its value and has its good side. But don't believe the hype that it's the greatest thing since sliced bread."

Still, as new subdivisions spring up across Shelby County, miles of underground electric cables are being installed.

In 1996, MLGW started requiring that low-voltage service lines extending to individual homes in new subdivisions be installed underground and offered incentives to developers to promote the underground installation of high-voltage "primary" lines, which was done in response to the devastating ice storm of 1994.

Just over one-third of MLGW's roughly 6,700 miles of electric distribution lines are now underground.

City Councilman Bill Morrison, who is vice chairman of the council's MLGW committee, said, aesthetically, he'd like to see MLGW bury all its existing power lines.

But he said the capital cost - which would be passed along to customers through higher utility rates - may be too great an obstacle.

"We really don't want to do that," Morrison said of raising rates for such a project. "We're making it more and more difficult to live in the city."

Related News

Solar Becomes #3 Renewable Electricity Source In USA

U.S. Solar Generation 2017 surpassed biomass, delivering 77 million MWh versus 64 million MWh, trailing only hydro and wind; driven by PV expansion, capacity additions, and utility-scale and small-scale growth, per EIA.


Key Points

It was the year U.S. solar electricity exceeded biomass, hitting 77 million MWh and trailing only hydro and wind.

✅ Solar: 77 million MWh; Biomass: 64 million MWh (2017, EIA)

✅ PV expansion; late-year capacity additions dampen annual generation

✅ Hydro: 300 and wind: 254 million MWh; solar thermal ~3 million MWh


Electricity generation from solar resources in the United States reached 77 million megawatthours (MWh) in 2017, surpassing for the first time annual generation from biomass resources, which generated 64 million MWh in 2017. Among renewable sources, only hydro and wind generated more electricity in 2017, at 300 million MWh and 254 million MWh, respectively. Biomass generating capacity has remained relatively unchanged in recent years, while solar generating capacity has consistently grown.

Annual growth in solar generation often lags annual capacity additions because generating capacity tends to be added late in the year. For example, in 2016, 29% of total utility-scale solar generating capacity additions occurred in December, leaving few days for an installed project to contribute to total annual generation despite being counted in annual generating capacity additions. In 2017, December solar additions accounted for 21% of the annual total. Overall, solar technologies operate at lower annual capacity factors and experience more seasonal variation than biomass technologies.

Biomass electricity generation comes from multiple fuel sources, such as wood solids (68% of total biomass electricity generation in 2017), landfill gas (17%), municipal solid waste (11%), and other biogenic and nonbiogenic materials (4%).These shares of biomass generation have remained relatively constant in recent years, even as renewables' rise in 2020 across the grid.

Solar can be divided into three types: solar thermal, which converts sunlight to steam to produce power; large-scale solar photovoltaic (PV), which uses PV cells to directly produce electricity from sunlight; and small-scale solar, which are PV installations of 1 megawatt or smaller. Generation from solar thermal sources has remained relatively flat in recent years, at about 3 million MWh, even as renewables surpassed coal in 2022 nationwide. The most recent addition of solar thermal capacity was the Crescent Dunes Solar Energy plant installed in Nevada in 2015, and currently no solar thermal generators are under construction in the United States.

Solar photovoltaic systems, however, have consistently grown in recent years, as indicated by 2022 U.S. solar growth metrics across the sector. In 2014, large-scale solar PV systems generated 15 million MWh, and small-scale PV systems generated 11 million MWh. By 2017, annual electricity from those sources had increased to 50 million MWh and 24 million MWh, respectively, with projections that solar could reach 20% by 2050 in the U.S. mix. By the end of 2018, EIA expects an additional 5,067 MW of large-scale PV to come online, according to EIA’s Preliminary Monthly Electric Generator Inventory, with solar and storage momentum expected to accelerate. Information about planned small-scale PV systems (one megawatt and below) is not collected in that survey.


Related News

View more

Learn how fees and usage impacts your electricity bill in new online CER tool

CER Interactive Electricity Bill Tool compares provincial electricity prices, fees, taxes, and usage. Explore household appliance costs, hydroelectric generation, and consumption trends across Canada with interactive calculators and a province-by-province breakdown.


Key Points

An online CER report with calculators comparing electricity prices, fees, and usage to explain household energy costs.

✅ Province-by-province bill, price, and consumption comparison

✅ Calculator for appliance and electronics energy costs

✅ Explains fees, taxes, regulation, and generation sources


Canadians have a new way to assess their electricity bill in a new, interactive online report released by the Canada Energy Regulator (CER).

The report titled What is in a residential electricity bill? features a province-to-province comparison of electricity bills, generation and consumption. It also explains electricity prices across the country, including how Calgary electricity prices have changed, allowing people to understand why costs vary depending on location, fees, regulation and taxes.  

Learn how fees and usage impacts your electricity bill in new online CER tool
Interactive tools allow people to calculate the cost of household appliances and electronic use for each province and territory, and to understand how Ontario rate increases may affect monthly bills. For example, an individual can use the tools to find out that leaving a TV on for 24-hours in Quebec costs $5.25 per month, while that same TV on for a whole day would cost $12.29 per month in Saskatchewan, $20.49 per month in the Northwest Territories, and $15.30 per month in Nova Scotia.

How Canadians use energy varies as much as how provinces and territories produce it, especially in regions like Nunavut where unique conditions influence costs. Millions of Canadians rely on electricity to power their household appliances, charge their electronics, and heat their homes. Provinces with abundant hydro-electric resources like Quebec, B.C., Manitoba, and Newfoundland and Labrador use electricity for home heating and tend to consume the most electricity.

By gathering data from various sources, this report is the first Canadian publication that features interactive tools to allow for a province-by-province comparison of electricity bills while highlighting different elements within an electricity bill, a helpful context as Canada faces a critical supply crunch in the years ahead.

The CER monitors energy markets and assesses Canadian energy requirements and trends, including clean electricity regulations developments that shape pricing. This report is part of a portfolio of publications on energy supply, demand and infrastructure that the CER publishes regularly as part of its ongoing market monitoring.

"No matter where you go in the country, Canadians want to know how much they pay for power and why, especially amid price spikes in Alberta this year," says lead author Colette Craig. "This innovative, interactive report really explains electricity bills to help everyone understand electricity pricing and consumption across Canada."

Quick Facts

  • Quebec ranks first in electricity consumption per capita at 21.0 MW.h, followed by Saskatchewan at 20.0 MW.h, Newfoundland and Labrador at 19.3 MW.h.
  • About 95% of Quebec's electricity is produced from hydroelectricity.
  • Provinces that use electricity for home heating tend to consume the most electricity.
  • Canada's largest consuming sector for electricity was industrial at 238 TW.h. The residential and commercial sectors consumed 168 TW.h and 126 TW.h, respectively.
  • In 2018, Canada produced 647.7 terawatt hours (TW.h) of electricity. More than half of the electricity in Canada (61%) is generated from hydro sources. The remainder is produced from a variety of sources, such as fossil fuels (natural gas and petroleum), nuclear, wind, coal, biomass, solar.
  • Canada is a net exporter of electricity. In 2019, net exports to the U.S. electricity market totaled 47.0 TW.h.
  • The total value of Canada's electricity exports was $2.5 billion Canadian dollars and the value of imports was $0.6 billion Canadian dollars, resulting in 2019 net exports of $1.9 billion.
  • All regions in Canada are reflected in this report but it does not include data that reflects the COVID-19 lockdown and its effects on residential electricity bills.


Related News

View more

Mines found at Ukraine's Zaporizhzhia nuclear plant, UN watchdog says

Zaporizhzhia Nuclear Plant Mines reported by IAEA at the Russian-occupied site: anti-personnel devices in a buffer zone, restricted areas; access limits to reactor rooftops and turbine halls heighten nuclear safety and security concerns in Ukraine.


Key Points

IAEA reports anti-personnel mines at Russian-held Zaporizhzhia, raising nuclear safety risks in buffer zones.

✅ IAEA observes mines in buffer zone at occupied site

✅ Restricted areas; no roof or turbine hall access granted

✅ Safety systems unaffected, but staff under pressure


The United Nations atomic watchdog said it saw anti-personnel mines at the site of Ukraine's Zaporizhzhia nuclear power plant which is occupied by Russian forces.

Europe's largest nuclear facility fell to Russian forces shortly after the invasion of Ukraine in February last year, as Moscow later sought to build power lines to reactivate it amid ongoing control of the area. Kyiv and Moscow have since accused each other of planning an incident at the site.

On July 23 International Atomic Energy Agency (IAEA) experts "saw some mines located in a buffer zone between the site's internal and external perimeter barriers," agency chief Rafael Grossi said in a statement on Monday.

The statement did not say how many mines the team had seen.

The devices were in "restricted areas" that operating plant personnel cannot access, Mr Grossi said, adding the IAEA's initial assessment was that any detonation "should not affect the site's nuclear safety and security systems".

Laying explosives at the site was "inconsistent with the IAEA safety standards and nuclear security guidance" and, amid controversial proposals on Ukraine's nuclear plants that have circulated internationally, created additional psychological pressure on staff, he added.

Ukrainians in Nikopol are out of water and within Russia's firing line. But Zaporizhzhia nuclear power plant could pose the biggest threat, even as Ukraine has resumed electricity exports to regional grids.

Last week the IAEA said its experts had carried out inspections at the plant, without "observing" the presence of any mines, although they had not been given access to the rooftops of the reactor buildings, while a possible agreement to curb attacks on plants was being discussed.

The IAEA had still not been given access to the roofs of the reactor buildings and their turbine halls, its latest statement said, even as a proposal to control Ukraine's nuclear plants drew scrutiny.

After falling into Russian hands, Europe's biggest power plant was targeted by gunfire and has been severed from the grid several times, raising nuclear risk warnings from the IAEA and others.

The six reactor units, which before the war produced around a fifth of Ukraine's electricity, have been shut down for months, prompting interest in wind power development as a harder-to-disrupt source.


Related News

View more

Europe to Weigh Emergency Measures to Limit Electricity Prices

EU Electricity Price Limits are proposed by the European Commission to curb contagion from gas prices, bolster energy security, stabilize the power market, and manage inflation via LNG imports, gas storage, and reduced demand.


Key Points

Temporary power-price caps to curb gas contagion, shield consumers, and bolster EU energy security.

✅ Limits decouple electricity from volatile gas benchmarks

✅ Short-term LNG imports and storage to enhance supply security

✅ Market design reforms and demand reduction to tame prices


The European Union should consider emergency measures in the coming weeks that could include price cap strategies on electricity prices, European Commission President Ursula von der Leyen told leaders at an EU summit in Versailles.

The reference to the possible measures was contained in a slide deck Ms. von der Leyen used to discuss efforts to curb the EU’s reliance on Russian energy imports, which last year accounted for about 40% of its natural-gas consumption. The slides were posted to Ms. von der Leyen’s Twitter account.

Russia’s invasion of Ukraine has highlighted the vulnerability of Europe’s energy supplies to severe supply disruptions and raised fears that imports could be cut off by Moscow or because of damage to pipelines that run across Ukraine. It has also driven energy prices up sharply, contributing to worries about inflation and economic growth.

Earlier this week, the European Commission, the EU’s executive arm, published the outline of a plan that it said could cut imports of Russian natural gas by two-thirds this year and end the need for those imports entirely before 2030, aligning with calls to ditch fossil fuels in Europe. In the short-term, the plan relies largely on storing natural gas ahead of next winter’s heating season, reducing consumption and boosting imports of liquefied natural gas from other producers.

The Commission acknowledged in its report that high energy prices are rippling through the economy, even as European gas prices have fallen back toward pre-war levels, raising manufacturing costs for energy-intensive businesses and putting pressure on low-income households. It said it would consult “as a matter of urgency” and propose options for dealing with high prices.

The slide deck used by Ms. von der Leyen on Thursday said the Commission plans by the end of March to present emergency options “to limit the contagion effect of gas prices in electricity prices, including temporary price limits, even though rolling back electricity prices can be complex under current market rules.” It also intends this month to set up a task force to prepare for next winter and a proposal for a gas storage policy.

By mid-May, the Commission will set out options to revamp the electricity market and issue a proposal for phasing out EU dependency on Russian fossil fuels by 2027, according to the slides.

French President Emmanuel Macron said Thursday that Europe needs to protect its citizens and companies from the increase in energy prices, adding that some countries, including France, have already taken some national measures.

“If this lasts, we will need to have a more long-lasting European mechanism,” he said. “We will give a mandate to the Commission so that by the end of the month we can get all the necessary legislation ready.”

The problem with price limits is that they reduce the incentive for people and businesses to consume less, said Daniel Gros, distinguished fellow at the Centre for European Policy Studies, a Brussels think tank. He said low-income families and perhaps some businesses will need help dealing with high prices, but that should come as a lump-sum payment that isn’t tied to how much energy they are consuming.

“The key will be to let the price signal work,” Mr. Gros said in a paper published this week, which argued that high energy prices could result in lower demand in Europe and Asia, reducing the need for Russian natural gas. “Energy must be expensive so that people save energy,” he said.

Ms. von der Leyen’s slides suggest the EU hopes to replace 60 billion cubic meters of Russian gas with alternative suppliers, including suppliers of liquefied natural gas, by the end of this year. Another 27 billion cubic meters could be replaced through a combination of hydrogen and EU production of biomethane, according to the slide deck.


Related News

View more

Energy-insecure households in the U.S. pay 27% more for electricity than others

Community Solar for Low-Income Homes expands energy equity by delivering renewable energy access, predictable bill savings, and tax credit benefits to renters and energy-insecure households, accelerating distributed generation and storage adoption nationwide.


Key Points

A program model enabling renters and LMI households to subscribe to off-site solar and save on utility bills.

✅ Earn bill credits from shared solar generation.

✅ Expands access for renters and LMI subscribers.

✅ Often paired with storage and IRA tax credit adders.


On a square-foot basis, the issue of inequality is made worse by higher costs for energy usage in the nation. Efforts like community solar programs such as Maryland community solar are underway to boost low-income participation in the cost benefits of renewable energy.

The Energy Information Administration (EIA) shows that households that are considered energy insecure, or those that have the inability to adequately meet basic household energy costs, are paying more for electricity than their wealthier counterparts. 

On average in the United States in 2020, households were billed about $1.04 per square foot for all energy sources. For homes that did not report energy insecurity, that average was $0.98 per square foot, while homes with energy insecurity issues paid an average of $1.24 per square foot for energy. This means that U.S. residents that need the most support on their energy bills are stuck with costs 27% higher than their neighbors on square-foot-basis.

EIA said energy-insecure households have reduced or forgone basic necessities to pay energy bills, kept their houses at unsafe temperatures because of energy cost concerns, or been unable to repair heating or cooling equipment because of cost.

In 2020, households with income less than $10,000 a year were billed an average of $1.31 per square foot for energy, while households making $100,000 or more were billed an average of $0.96 per square foot, said EIA. Renters paid considerably more ($1.28 per square foot) than owners ($0.98 per square foot). There were also considerable differences between regions, with New England solar growth sparking grid upgrade debates, ethnic groups and races, and insulation levels, as seen below.

The energy transition toward renewables like solar has offered price stability, amid record solar and storage growth nationwide, but thus far energy-insecure communities have relatively been left behind. A recent Berkeley Lab report, Residential Solar-Adopter Income and Demographic Trends, indicates that even though the rate of solar adoption among low-income residents is increasing (from 5% in 2010 to 11% in 2021), that segment of energy consumers remains under-represented among solar adopters, relative to its share of the population.


Community solar efforts

As such, the United States is targeting communities most impacted by energy costs that have not benefitted from the transition, highlighting “Energy Communities” that are eligible for an additional 10% tax credit through funds made possible by the Inflation Reduction Act.

Additionally, a push for community solar development is taking place nationwide to extend access to affordable solar energy to renters and other residents that aren’t able to leverage finances to invest in predictable, low-cost residential solar systems. The Biden Administration set a goal this year to sign up 5 million community solar households, achieving $1 billion in bill savings by 2025. The community solar model only represents about 8% of the total distributed solar capacity in the nation. This target would entail a jump from 3 GW installed capacity to 20 GW by the target year. The Department of Energy estimates community solar subscribers save an average of 20% on their bills.

California this year passed AB 2316, the Community Renewable Energy Act takes aim at four acute problems in the state’s power market: reliability amid rising outage risks, rates, climate and equity. The law creates a community renewable energy program, including community solar-plus-storage, supported by cheaper batteries, to overcome access barriers for nearly half of Californians who rent or have low incomes. Community solar typically involves customers subscribing to an off-site solar facility, receiving a utility bill credit for the power it generates.

“Community renewable energy is a proven powerful tool to help close California’s clean energy gap, bringing much needed relief to millions struggling with high housing costs and utility debt,” said Alexis Sutterman, energy equity program manager at the California Environmental Justice Alliance.

The program has energy equity baked into its structure, working to make sure Californians of all income levels participate in the benefits of the energy transition. Not only does it open solar access to renters, the law ensures that at least 51% of subscribers are low-income customers, which is expected to make projects eligible for a 10% tax credit adder under the IRA.

“The money’s on the table now,” said Jeff Cramer, president and chief executive of the Coalition for Community Solar Access. “While there are groups pushing for solar access for all, and states with strong legislation, there are other pockets of interest in surprising places in the United States. For example, Louisiana has no policy for community solar or support for low-income residents going solar but the city of New Orleans has its own utility commission with a community solar program. In Nebraska, forward-looking co-operatives have created community solar projects.

Community solar markets are active in 22 states, with more expected to come online in the future as states pursue 100% clean energy targets across the country. However, the market is expected to require strong community outreach efforts to foster trust and gain subscribers.

“There is a distrust of community solar initially in LMI communities as many have been burned before by retail energy false promises,” said Eric LaMora, executive director, community solar, Nautilus Solar on a panel at the Solar Energy Industries Association Finance, Tax, and Buyers seminar. “People are suspicious but there really are no hooks with community solar.”

LMI residents are leery to provide tax records or much documents at all in order to sign up for community solar, LaMora said. “We were surprised to see less of a default rate with LMI residents. We attribute this to the fact that they see significant savings on their electric bill, making it easier to pay each month,” he said.


Related News

View more

Cheaper electricity rate for customers on First Nations not allowed, Manitoba appeal court rules

Manitoba Hydro Court Ruling affirms the Public Utilities Board exceeded its jurisdiction by ordering a First Nations rate class, overturning an electricity rates appeal tied to geography, poverty, and regulatory authority in Manitoba.


Key Points

A decision holding the PUB lacked authority to create a First Nations rate class, restoring uniform electricity pricing.

✅ Court says PUB exceeded jurisdiction creating on-reserve rate

✅ Equalized electricity pricing reaffirmed across Manitoba

✅ Geography, not poverty, found decisive in unlawful rate class


Manitoba Hydro was wrongly forced to create a new rate class for electricity customers living on First Nations, the Manitoba Court of Appeal has ruled. 

The court decided the Public Utilities Board "exceeded its jurisdiction" by mandating Indigenous customers on First Nations could have a different electricity rate from other Manitobans. 

The board made the order in 2018, which exempted those customers from the general rate increase that year of 3.6 per cent.

"The directive constituted the creation and implementation of general social policy, an area outside of the PUB's jurisdiction and encroaching into areas that are better suited to the federal and provincial government," says the decision, which was released Tuesday.

Hydro's appeal of the PUB's decision went to court earlier this year.

At the time, the Crown corporation acknowledged many Indigenous people on First Nations live in poverty, but it argued the Public Utilities Board was overstepping its authority in trying to address the issue by creating a new rate class.

It also argued it was against provincial law to charge different rates in different areas of the province.

The PUB, however, insisted that legislation gives it the right to decide which factors are relevant when considering electricity prices, such as social issues. 

Special Manitoba Hydro rate class needed to offset challenges of living on First Nations, appeal court hears
Manitoba Hydro can appeal order to create special First Nation rate
The board had heard evidence that some customers were making "unacceptable" sacrifices to keep the lights on each month.

Decision 'heavy-handed': AMC
The Assembly of Manitoba Chiefs, an intervener in the appeal, had backed the utility board's position. It said on-reserve customers are disproportionately vulnerable to rate hikes over time.

Grand Chief Arlen Dumas said Wednesday he was surprised by the court's ruling. 

He argued Indigenous people are unduly excluded in the setting of electricity rates in Manitoba.

"I will be speaking with my federal and provincial counterparts on how we deal with this issue, because I think it's the wrong [decision]. It's heavy-handed and we need to address it."

The appeal court judges said there is past precedent for setting equal electricity rates, regardless of where customers live. Legislation to that effect was made in the early 2000s and a few years ago, the PUB recognized that geographical limitations should not be imposed on a class of customers.

Since the board's new order didn't extend the same savings to First Nations members who don't live on reserve but face similar financial circumstances, it is clear the deciding factor was geography, rather than poverty or treaty status, the judges said.

Manitoba Hydro temporarily cutting 200 jobs, many of them front-line workers
"In my view, the PUB erred in law when it created an on-reserve class based solely on a geographic region of the province in which customers are located," the decision read.

While Manitoba Hydro objected to the PUB's order in 2018, it still devoted money to create the new customer class.

Spokesperson Bruce Owen said the utility is still studying the impact of the court's decision, but it appreciates the ruling.  

"We all recognize that many people on First Nations have challenges, but our argument was solely on whether or not the PUB had the authority to create a special rate class based on where people live."

Owen added that Hydro recognizes electricity rates can be a hardship on individuals facing poverty. He said those considerations are part of the discussions the corporation has with the utilities board.


Related News

View more

Sign Up for Electricity Forum’s Newsletter

Stay informed with our FREE Newsletter — get the latest news, breakthrough technologies, and expert insights, delivered straight to your inbox.

Electricity Today T&D Magazine Subscribe for FREE

Stay informed with the latest T&D policies and technologies.
  • Timely insights from industry experts
  • Practical solutions T&D engineers
  • Free access to every issue

Download the 2025 Electrical Training Catalog

Explore 50+ live, expert-led electrical training courses –

  • Interactive
  • Flexible
  • CEU-cerified