Mexico will sell power to Los Angeles

By United Press International


NFPA 70e Training

Our customized live online or in‑person group training can be delivered to your staff at your location.

  • Live Online
  • 6 hours Instructor-led
  • Group Training Available
Regular Price:
$199
Coupon Price:
$149
Reserve Your Seat Today
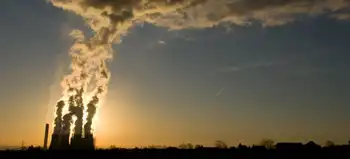
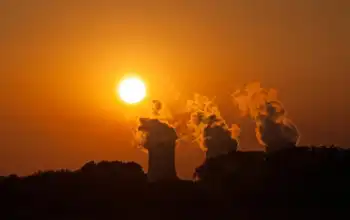
Mexico's Federal Electricity Commission signed an agreement with Los Angeles to allow Mexico's state-owned power company to sell electricity to the U.S. city.

Electricity will be generated at Mexico's Cerro Prieto geothermal power plant in Mexicali and then sold to the Los Angeles Department of Water & Power, according to the memorandum of understanding signed by Los Angeles Mayor Antonio Villaraigosa and Mexico's Federal Electricity Commission Chief Alfredo Elias Ayub.

How much power will be generated and sold was not disclosed.

Mexico's commission said it recently signed a similar deal with Belize and is close to finalizing another power sale agreement with Guatemala, bringing its foreign power sales to $100 million by the end of 2010.

The Mexican utility said its goal is to "diversify the sources of electricity generation" and reduce emissions of pollutants and greenhouse gases.

Related News

No time to be silent on NZ's electricity future

New Zealand Renewable Energy Strategy examines decarbonisation, GHG emissions, and net energy as electrification accelerates, expanding hydro, geothermal, wind, and solar PV while weighing intermittency, storage, materials, and energy security for a resilient power system.


Key Points

A plan to expand electricity generation, balancing decarbonisation, net energy limits, and energy security.

✅ Distinguishes decarbonisation targets from renewable capacity growth

✅ Highlights net energy limits, intermittency, and storage needs

✅ Addresses materials, GHG build-out costs, and energy security


The Electricity Authority has released a document outlining a plan to achieve the Government’s goal of more than doubling the amount of electricity generated in New Zealand over the next few decades.

This goal is seen as a way of both reducing our greenhouse gas (GHG) emissions overall, as everything becomes electrified, and ensuring we have a 100 percent renewable energy system at our disposal. Often these two goals are seen as being the same – to decarbonise we must transition to more renewable energy to power our society.

But they are quite different goals and should be clearly differentiated. GHG emissions could be controlled very effectively by rationing the use of a fossil fuel lockdown approach, with declining rations being available over a few years. Such a direct method of controlling emissions would ensure we do our bit to remain within a safe carbon budget.

If we took this dramatic step we could stop fretting about how to reduce emissions (that would be guaranteed by the rationing), and instead focus on how to adapt our lives to the absence of fossil fuels.

Again, these may seem like the same task, but they are not. Decarbonising is generally thought of in terms of replacing fossil fuels with some other energy source, signalling that a green recovery must address more than just wind capacity. Adapting our lives to the absence of fossil fuels pushes us to ask more fundamental questions about how much energy we actually need, what we need energy for, and the impact of that energy on our environment.

MBIE data indicate that between 1990 and 2020, New Zealand almost doubled the total amount of energy it produced from renewable energy sources - hydro, geothermal and some solar PV and wind turbines.

Over this same time period our GHG emissions increased by about 25 percent. The increase in renewables didn’t result in less GHG emissions because we increased our total energy use by almost 50 percent, mostly by using fossil fuels. The largest fossil fuel increases were used in transport, agriculture, forestry and fisheries (approximately 60 percent increases for each).

These data clearly demonstrate that increasing renewable energy sources do not necessarily result in reduced GHG emissions.

The same MBIE data indicate that over this same time period, the amount of Losses and Own Use category for energy use more than doubled. As of 2020 almost 30 percent of all energy consumed in New Zealand fell into this category.

These data indicate that more renewable energy sources are historically associated with less energy actually being available to do work in society.

While the category Losses and Own Use is not a net energy analysis, the large increase in this category makes the call for a system-wide net energy analysis all the more urgent.

Net energy is the amount of energy available after the energy inputs to produce and deliver the energy is subtracted. There is considerable data available indicating that solar PV and wind turbines have a much lower net energy surplus than fossil fuels.

And there is further evidence that when the intermittency and storage requirements are engineered into a total renewable energy system, the net energy of the entire system declines sharply. Could the Losses and Other Uses increase over this 30-year period be an indication of things to come?

Despite the importance of net energy analysis in designing a national energy system which is intended to provide energy security and resilience, there is not a single mention of net energy surplus in the EA reference document.

So over the last 30 years, New Zealand has doubled its renewable energy capacity, and at the same time increased its GHG emissions and reduced the overall efficiency of the national energy system.

And we are now planning to more than double our renewable energy system yet again over the next 30 years, even as zero-emissions electricity by 2035 is being debated elsewhere. We need to ask if this is a good idea.

How can we expand New Zealand’s solar PV and wind turbines without using fossil fuels? We can’t.

How could we expand our solar PV and wind turbines without mining rare minerals and the hidden costs of clean energy they entail, further contributing to ecological destruction and often increasing social injustices? We can't.

Even if we could construct, deliver, install and maintain solar PV and wind turbines without generating more GHG emissions and destroying ecosystems and poor communities, this “renewable” infrastructure would have to be replaced in a few decades. But there are at least two major problems with this assumed scenario.

The rare earth minerals required for this replacement will already be exhausted by the initial build out. Recycling will only provide a limited amount of replacements.

The other challenge is that a mostly “renewable” energy system will likely have a considerably lower net energy surplus. So where, in 2060, will the energy come from to either mine or recycle the raw materials, and to rebuild, reinstall and maintain the next iteration of a renewable energy system?

There is currently no plan for this replacement. It is a serious misnomer to call these energy technologies “renewable”. They are not as they rely on considerable raw material inputs and fossil energy for their production and never ending replacement.

New Zealand is, of course, blessed with an unusually high level of hydro electric and geothermal power. New Zealand currently uses over 170 GJ of total energy per capita, 40 percent of which is “renewable”. This provides approximately 70 GJ of “renewable” energy per capita with our current population.

This is the average global per capita energy level from all sources across all nations, as calls for 100% renewable energy globally emphasize. Several nations operate with roughly this amount of total energy per capita that New Zealand can generate just from “renewables”.

It is worth reflecting on the 170 GJ of total energy use we currently consume. Different studies give very different results regarding what levels are necessary for a good life.

For a complex industrial society such as ours, 100 GJ pc is said to be necessary for a high levels of wellbeing, determined both subjectively (life satisfaction/ happiness measures), and objectively (e.g. infant mortality levels, female morbidity as an index of population health, access to nutritious food and educational and health resources, etc). These studies do not take into account the large amount of energy that is wasted either through inefficient technologies, or frivolous use, which effective decarbonization strategies seek to reduce.

Other studies that consider the minimal energy needed for wellbeing suggest a much lower level of per capita energy consumption is required. These studies take a different approach and focus on ensuring basic wellbeing is maintained, but not necessarily with all the trappings of a complex industrial society. Their results indicate a level of approximately 20 GJ per capita is adequate.

In either case, we in New Zealand are wasting a lot of energy, both in terms of the efficiency of our technologies (see the Losses and Own Use info above), and also in our uses which do not contribute to wellbeing (think of the private vehicle travel that could be done by active or public transport – if we had good infrastructure in place).

We in New Zealand need a national dialogue about our future. And energy availability is only one aspect. We need to discuss what our carrying capacity is, what level of consumption is sustainable for our population, and whether we wish to make adjustments in either our per capita consumption or our population. Both together determine whether we are on the sustainable side of carrying capacity. Currently we are on the unsustainable side, meaning our way of life cannot endure. Not a good look for being a good ancestor.

The current trajectory of the Government and Electricity Authority appears to be grossly unsustainable. At the very least they should be able to answer the questions posed here about the GHG emissions from implementing a totally renewable energy system, the net energy of such a system, and the related environmental and social consequences.

Public dialogue is critical to collectively working out our future. Allowing the current profit-driven trajectory to unfold is a recipe for disasters for our children and grandchildren.

Being silent on these issues amounts to complicity in allowing short-term financial interests and an addiction to convenience jeopardise a genuinely secure and resilient future. Let’s get some answers from the Government and Electricity Authority to critical questions about energy security.


Related News

View more

US January power generation jumps 9.3% on year: EIA

US January power generation climbed to 373.2 TWh, EIA data shows, with coal edging natural gas, record wind output, record nuclear generation, rising hydro, and stable utility-scale solar amid higher Henry Hub prices.


Key Points

US January power generation hit 373.2 TWh; coal led gas, wind and nuclear set records, with solar edging higher.

✅ Coal 31.8% share; gas 29.4%; coal output 118.7 TWh, gas 109.6 TWh.

✅ Wind hit record 26.8 TWh; nuclear record 74.6 TWh.

✅ Total generation 373.2 TWh, highest January since 2014.


The US generated 373.2 TWh of power in January, up 7.9% from 345.9 TWh in December and 9.3% higher than the same month in 2017, Energy Information Administration data shows.

The monthly total was the highest amount in January since 377.3 TWh was generated in January 2014.

Coal generation totaled 118.7 TWh in January, up 11.4% from 106.58 TWh in December and up 2.8% from the year-ago month, consistent with projections of a coal-fired generation increase for the first time since 2014. It was also the highest amount generated in January since 132.4 TWh in 2015.

For the second straight month, more power was generated from coal than natural gas, as 109.6 TWh came from gas, up 3.3% from 106.14 TWh in December and up 19.9% on the year.

However, the 118.7 TWh generated from coal was down 9.6% from the five-year average for the month, due to the higher usage of gas and renewables and a rising share of non-fossil generation in the overall mix.

#google#

Coal made up 31.8% of the total US power generation in January, up from 30.8% in December but down from 33.8% in January 2017.

Gas` generation share was at 29.4% in the latest month, with momentum from record gas-fired electricity earlier in the period, down from 30.7% in December but up from 26.8% in the year-ago month.

In January, the NYMEX Henry Hub gas futures price averaged $3.16/MMBtu, up 13.9% from $2.78/MMBtu averaged in December but down 4% from $3.29/MMBtu averaged in the year-ago month.


WIND, NUCLEAR GENERATION AT RECORD HIGHS

Wind generation was at a record-high 26.8 TWh in January, up 29.3% from 22.8 TWh in December and the highest amount on record, according to EIA data going back to January 2001. Wind generated 7.2% of the nation`s power in January, as an EIA summer outlook anticipates larger wind and solar contributions, up from 6.6% in December and 6.1% in the year-ago month.

Utility-scale solar generated 3.3 TWh in January, up 1.3% from 3.1 TWh in December and up 51.6% on the year. In January, utility-scale solar generation made up 0.9% of US power generation, during a period when solar and wind supplied 10% of US electricity in early 2018, flat from December but up from 0.6% in January 2017.

Nuclear generation was also at a record-high 74.6 TWh in January, up 1.3% month on month and the highest monthly total since the EIA started tracking it in January 2001, eclipsing the previous record of 74.3 TWh set in July 2008. Nuclear generation made up 20% of the US power in January, down from 21.3% in December and 21.4% in the year-ago month.

Hydro power totaled 25.4 TWh in January, making up 6.8% of US power generation during the month, up from 6.5% in December but down from 8.2% in January 2017.


Related News

View more

Nunavut's electricity price hike explained

Nunavut electricity rate increase sees QEC raise domestic electricity rates 6.6% over two years, affecting customer rates, base rates, subsidies, and kWh overage charges across communities, with public housing exempt and territory-wide pricing denied.


Key Points

A 6.6% QEC hike over 2018-2019, affecting customer rates, subsidies, and kWh overage; public housing remains exempt.

✅ 3.3% on May 1, 2018; 3.3% on Apr 1, 2019

✅ Subsidy caps: 1,000 kWh Oct-Mar; 700 kWh Apr-Sep

✅ Territory-wide base rate denied; public housing exempt


Ahead of the Nunavut government's approval of the general rate increase for the Qulliq Energy Corporation, many Nunavummiut wondered how the change would impact their electricity bills.

QEC's request for a 6.6-per-cent increase was approved by the government last week. The increase will be spread out over two years, a pattern similar to BC Hydro's two-year rate plan, with the first increase (3.3 per cent) effective May 1, 2018. The remaining 3.3 per cent will be applied on April 1, 2019.

Public housing units, however, are exempt from the government's increase altogether.

The power corporation also asked for a territory-wide rate, so every community would pay the same base rate (we'll go over specific terms in a minute if you're not familiar with them). But that request was denied, even as Manitoba Hydro scaled back increases next year, and QEC will now take the next two years reassessing each community's base rate.

#google#

So, what does this mean for your home's power bill? Well, there's a few things you need to know, which we'll get to in a second.

But in essence, as long as you don't go over the government-subsidized monthly electricity usage limit, you're paying an extra 3.61 cents per kilowatt hour (kWh).

To be clear, we're talking about non-government domestic rates — basically, private homeowners — and those living in a government-owned unit but pay for their own power.


The basics

First, some quick terminology. The "base rate" term we're going to use (and used above) in this story refers to the community rate. As in, what QEC charges customers in every community. The "customer rate" is the rate customers actually pay, after the government's subsidy.


The first thing you need to know is everyone in Nunavut starts off by paying the same customer rate, unlike jurisdictions using a price cap to limit spikes.

That's because the government subsidizes electricity costs, and that subsidy is different in every community, because the base rate is different.

For example, Iqaluit's new base rate after the 3.3 per cent increase (remember, the 6.6 per cent is being applied over two years) is 56.69 cents per kWh, while Kugaaruk's base rate rose to 112.34 cents per kWh. Those, by the way, are the territory's lowest and highest respective base rates.

However, customers in both Iqaluit and Kugaaruk will each now pay 28.35 cents per kWh because, remember, the government subsidizes the base rates in every community.

Now, remember earlier we mentioned a "government-subsidized monthly electricity usage limit?" That's where customers in various communities start to pay different amounts.

As simply as we can explain it, the government will only cover so much electricity usage in a month, in every household.

Between October and March, the government will subsidize the first 1,000 kilowatt hours, and only 700 kilowatt hours from April to September. QEC says the average Nunavut home will use about 500 kilowatt hours every month over the course of a year.

But if your household goes over that limit, you're at the mercy of your community's base rate for any extra electricity you use. Homes in Kugaaruk in December, for instance, will have to pay that 122.34 cents for every extra kilowatt hour it uses, while homes in Iqaluit only have to pay 56.69 cents per kWh for its extra electricity.

That's where many Nunavummiut have criticized the current rate structure, because smaller communities are paying more for their extra costs than larger communities.

QEC had hoped — as it had asked for — to change the structure so every community pays the same base rate. So regardless of if people go over their electricity usage limits for the government subsidy, everyone would pay the same overage rates.

But the government denied that request.


New rate is actually lower

The one thing we should highlight, however, is the new rate after the increase is actually lower than what customers were paying in 2014.

For the past seven months, customers have been getting power from QEC at a discount, whereas Newfoundland customers began paying for Muskrat Falls during the same period, to different effect.

That's because when QEC sets its rates, it does so based on global oil price forecasts. Since 2014, the price of oil worldwide has slumped, and so QEC was able to purchase it at less than it had anticipated.

When that happens, and QEC makes more than $1 million within a six month period thanks to the lower oil prices, it refunds the excess profits back to customers through a discount on electricity base rates — a mechanism similar to a lump-sum credit used elsewhere — the government subsidy, however, doesn't change so the savings are passed on directly to customers.

Now, the 6.6 per cent increase to electricity rates, is actually being applied to the discounted base rate from the last seven months.

So again, while customers are paying more than they have been for the last seven months, it's lower than what they were paying in 2014.

Lastly, to be clear, all the figures used in this story are only for domestic non-government rates. Commercial rates and changes have not been explored in this story, given the differences in subsidy and rate application.


Related News

View more

More young Canadians would work in electricity… if they knew about it

Generation Impact Report reveals how Canada's electricity sector can recruit Millennials and Gen Z, highlighting workforce gaps, career pathways, innovative projects, secure pay, and renewable energy opportunities to attract young talent nationwide.


Key Points

An EHRC survey on youth views of electricity careers and recruitment strategies to build a skilled workforce.

✅ Surveyed 1,500 Canadians aged 18-36 nationwide

✅ Highlights barriers: low awareness of sector roles

✅ Emphasizes fulfilling work, secure pay, innovation


Young Canadians make up far less of the electricity workforce than other sectors, says Electricity Human Resources Canada, as noted in an EHRC investment announcement that highlights sector priorities, and its latest report aims to answer the question “Why?”.

The report, “Generation Impact: Future Workforce Perspectives”, was based on a survey of 1500 respondents across Canada between the ages of 18 and 36. This cohort’s perspectives on the electricity sector were mostly Positive or Neutral, and that Millennial and Gen Z Canadians are largely open to considering careers in electricity, especially as initiatives such as a Nova Scotia energy training program expand access.

The biggest barrier is a knowledge gap in electrical safety that limits awareness of the opportunities available.

To an industry looking to develop a pipeline of young talent, “Generation Impact” reveals opportunities for recruitment; key factors that Millennial and Gen Z Canadians seek in their ideal careers include fulfilling work, secure pay and the chance to be involved in innovative projects, including specialized arc flash training in Vancouver opportunities that build expertise.

“The electricity sector is already home to the kinds of fulfilling and innovative careers that many in the Millennial and Gen Z cohorts are looking for,” said Michelle Branigan, CEO of EHRC. “Now it’s just a matter of communicating effectively about the opportunities and benefits, including leadership in worker safety initiatives, our sector can offer.”

“Engaging young workers in Canada’s electricity sector is critical for developing the resiliency and innovation needed to support the transformation of Canada’s energy future, especially as working from home drives up electricity bills and reshapes demand,” said Seamus O’Regan, Canada’s Minister of Natural Resources. “The insights of this report will help to position the sector competitively to leverage the talent and skills of young Canadians.”

“Generation Impact” was funded in part by the Government of Canada’s Student Work Placement Program and Natural Resources Canada’s Emerging Renewable Power Program, in a context of rising residential electricity use that underscores workforce needs.


Related News

View more

Alberta set to retire coal power by 2023, ahead of 2030 provincial deadline

Alberta coal phaseout accelerates as utilities convert to natural gas, cutting emissions under TIER regulations and deploying hydrogen-ready, carbon capture capable plants, alongside new solar projects in a competitive, deregulated electricity market.


Key Points

A provincewide shift from coal to natural gas and renewables, cutting power emissions years ahead of the 2030 target.

✅ Capital Power, TransAlta converting coal units to gas

✅ TIER pricing drives efficiency, carbon capture readiness

✅ Hydrogen-ready turbines, solar projects boost renewables


Alberta is set to meet its goal to eliminate coal-fired electricity production years earlier than its 2030 target, amid a broader shift to cleaner energy in the province, thanks to recently announced utility conversion projects.

Capital Power Corp.’s plan to spend nearly $1 billion to switch two coal-fired power units west of Edmonton to natural gas, and stop using coal entirely by 2023, was welcomed by both the province and the Pembina Institute environmental think-tank.

In 2014, 55 per cent of Alberta’s electricity was produced from 18 coal-fired generators. The Alberta government announced in 2015 it would eliminate emissions from coal-fired electricity generation by 2030.

Dale Nally, associate minister of Natural Gas and Electricity, said Friday that decisions by Capital Power and other utilities to abandon coal will be good for the environment and demonstrates investor confidence in Alberta’s deregulated electricity market, where the power price cap has come under scrutiny.

He credited the government’s Technology Innovation and Emissions Reduction (TIER) regulations, which put a price on industrial greenhouse gas emissions, as a key factor in motivating the conversions.

“Capital Power’s transition to gas is a great example of how private industry is responding effectively to TIER, as it transitions these facilities to become carbon capture and hydrogen ready, which will drive future emissions reductions,” Nally said in an email.

Capital Power said direct carbon dioxide emissions at its Genesee power facility near Edmonton will be about 3.4 million tonnes per year lower than 2019 emission levels when the project is complete.

It says the natural gas combined cycle units it’s installing will be the most efficient in Canada, adding they will be capable of running on 30 per cent hydrogen initially, with the option to run on 95 per cent hydrogen in future with minor investments.

In November, Calgary-based TransAlta Corp. said it will end operations at its Highvale thermal coal mine west of Edmonton by the end of 2021 as it switches to natural gas at all of its operated coal-fired plants in Canada four years earlier than previously planned.

The Highvale surface coal mine is the largest in Canada, and has been in operation on the south shore of Wabamun Lake in Parkland County since 1970.

The moves by the two utilities and rival Atco Ltd., which announced three years ago it would convert to gas at all of its plants by this year, mean significant emissions reduction and better health for Albertans, said Binnu Jeyakumar, director of clean energy for Pembina.

“Alberta’s early coal phaseout is also a great lesson in good policy-making done in collaboration with industry and civil society,” she said.

“As we continue with this transformation of our electricity sector, it is paramount that efforts to support impacted workers and communities are undertaken.”

She added the growing cost-competitiveness of renewable energy, such as wind power, makes coal plant retirements possible, applauding Capital Power’s plans to increase its investments in solar power.

In Ontario, clean power policy remains a focus as the province evaluates its energy mix.

The company announced it would go ahead with its 75-megawatt Enchant Solar power project in southern Alberta, investing between $90 million and $100 million, and that it has signed a 25-year power purchase agreement with a Canadian company for its 40.5-MW Strathmore Solar project now under construction east of Calgary.


Related News

View more

European responses to Covid-19 accelerate electricity system transition by a decade - Wartsila

EU-UK Coal Power Decline 2020 underscores Covid-19's impact on power generation, with renewables rising, carbon emissions falling, and electricity demand down, revealing resilient grids and accelerating the energy transition across European markets.


Key Points

Covid-19's impact on EU-UK power: coal down, renewables up, lower emissions intensity and reduced electricity demand.

✅ Coal generation down 25.5% EU-UK; 29% in March 10-April 10 period

✅ Renewables share up to 46%; grids remained stable and flexible

✅ Electricity demand fell 10%; emissions intensity dropped 19.5%


Coal based power generation has fallen by over a quarter (25.5%) across the European Union (EU) and United Kingdom (UK) in the first three months of 2020, compared to 2019, as a result of the response to Covid-19, with renewable energy reaching a 43% share, as wind and solar outpaced gas across the EU, according to new analysis by the technology group Wärtsilä.

The impact is even more stark in the last month, with coal generation collapsing by almost one third (29%) between March 10 and April 10 compared to the same period in 2019, making up only 12% of total EU and UK generation. By contrast, renewables delivered almost half (46%) of generation – an increase of 8% compared to 2019.

In total, demand for electricity across the continent is down by one tenth (10%), mirroring global demand declines of around 15%, due to measures taken to combat Covid-19, the biggest drop in demand since the Second World War. The result is an unprecedented fall in carbon emissions from the power sector, with emission intensity falling by 19.5% compared to the same March 10-April 10 period last year. The analysis comes from the Wärtsilä Energy Transition Lab, a new free-to-use data platform developed by Wärtsilä to help the industry, policy makers and the public understand the impact of Covid-19 on European electricity markets and analyse what this means for the future design and operation of its energy systems. The goal is to help accelerate the transition to 100% renewables.

Björn Ullbro, Vice President for Europe & Africa at Wärtsilä Energy Business, said: “The impact of the Covid-19 crisis on European energy systems is extraordinary. We are seeing levels of renewable electricity that some people believed would cause systems to collapse, yet they haven’t – in fact they are coping well. The question is, what does this mean for the future?”

“What we can see today is how our energy systems cope with much more renewable power – knowledge that will be invaluable, aligning with IAEA low-carbon insights, to accelerate the energy transition. We are making this new platform freely available to support the energy industry to adapt and use the momentum this tragic crisis has created to deliver a better, cleaner energy system, faster.”

The figures mark a dramatic shift in Europe’s energy mix – one that was not anticipated to occur until the end of the decade. The impact of the Covid-19 crisis has effectively accelerated the energy transition in the short-term, even as later lockdowns saw power demand hold firm in parts of Europe, providing a unique opportunity to see how energy systems function with far higher levels of renewables.

Ullbro added: “Electricity demand across Europe has fallen due to the lockdown measures applied by governments to stop the spread of the coronavirus. However, total renewable generation has remained at pre-crisis levels with low electricity prices, combined with renewables-friendly policy measures, crowding out gas and fossil fuel power generation, especially coal. This sets the scene for the next decade of the energy transition.”

These Europe-wide impacts are mirrored at a national level, for example:

  • In the UK, renewables now have a 43% share of generation, following a stall in low-carbon progress in 2019 (up 10% on the same March 10-April 10 period in 2019) with coal power down 35% and gas down 24%.
  • Germany has seen the share of renewables reach 60% (up 12%) and coal generation fall 44%, resulting in a fall in the carbon intensity of its electricity of over 30%.
  • Spain currently has 49% renewables with coal power down by 41%.
  • Italy has seen the steepest fall in demand, down 21% so far.

An industry first, the Wärtsilä Energy Transition Lab has been specifically developed as an open-data platform for the energy industry to understand the impact of Covid-19 and help accelerate the energy transition. The tool provides detailed data on electricity generation, demand and pricing for all 27 EU countries and the UK, combining Entso-E data in a single, easy to use platform. It will also allow users to model how systems could operate in future with higher renewables, as global power demand surpasses pre-pandemic levels, helping pinpoint problem areas and highlight where to focus policy and investment.


Related News

View more

Sign Up for Electricity Forum’s Newsletter

Stay informed with our FREE Newsletter — get the latest news, breakthrough technologies, and expert insights, delivered straight to your inbox.

Electricity Today T&D Magazine Subscribe for FREE

Stay informed with the latest T&D policies and technologies.
  • Timely insights from industry experts
  • Practical solutions T&D engineers
  • Free access to every issue

Live Online & In-person Group Training

Advantages To Instructor-Led Training – Instructor-Led Course, Customized Training, Multiple Locations, Economical, CEU Credits, Course Discounts.

Request For Quotation

Whether you would prefer Live Online or In-Person instruction, our electrical training courses can be tailored to meet your company's specific requirements and delivered to your employees in one location or at various locations.