Silicon Valley investor upbeat on new energy bets

By Reuters


NFPA 70e Training

Our customized live online or in‑person group training can be delivered to your staff at your location.

  • Live Online
  • 6 hours Instructor-led
  • Group Training Available
Regular Price:
$199
Coupon Price:
$149
Reserve Your Seat Today
Vinod Khosla, Silicon Valley's biggest alternative energy investor, forecast a rapid rise in cellulosic ethanol production and utility-grade solar power, while coal should fall from favor.

The legendary venture capitalist behind high-tech companies such as Sun Microsystems and Juniper Networks said backing renewable technologies has similar investment horizons to the four- to six-year cycles that computer start-ups have enjoyed.

"I would say that the technical risk in biofuels is no different than semiconductors and the market risk is also somewhat similar," Khosla said in an interview during the Reuters Biofuels Summit.

Khosla Partners, the venture fund he founded after 15 years with top firm Kleiner Perkins Caufield & Byers, has invested in more than 25 renewable energy companies ranging from ethanol technology to solar to more efficient lamps and engines.

In the interview, Khosla forecast rapid progress in the development of low-cost cellulosic ethanol fuel as an alternative to oil, fueled by a bipartisan groundswell of support by U.S. politicians and state-level regulatory change.

2007 is the year cellulosic ethanol will become a real prospect for investors, he said. By 2008, he forecast the first initial public offerings by suppliers of cellulosic ethanol technology.

"Remember, last year (cellulosic ethanol) was six to 10 years (away). Now people talk about four to six years. And my bet is (that) by the end of this year, they will talk about two to three years," Khosla said. "So we are maybe making two years of progress every year."

He forecast the rise of a global market for ethanol fuels, as production swells in places such as Brazil and Indonesia and barriers fall to importation into Europe and North America.

"I suspect tariffs will be on their way out," he said.

On the political front, Khosla said Bush has one issue in common with the new Democratic-controlled Congress - expansion of renewable energy to offset dependence on foreign oil.

The build-up to the U.S. presidential elections next year, combined with a major Supreme Court decision that could classify carbon dioxide emissions as a pollutant, are likely to be the driving forces of further regulatory changes.

"That completely changes the equation because suddenly all the states can start to regulate carbon dioxide emissions without relying on the federal government," he said.

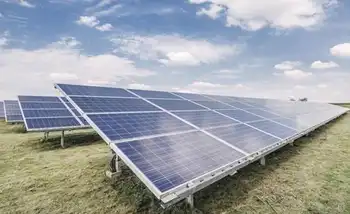
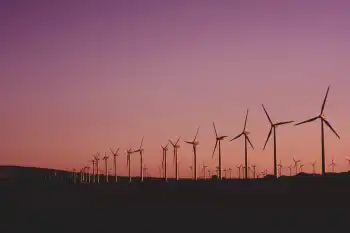
Khosla is lukewarm on wind or residential solar power being of much value to large utilities. But he is bullish on "solar thermal" power - large arrays of solar cells installed in Southwestern deserts - which he said is attracting the attention of at least one major electric utility in the Western United States.

"Solar thermal will become much more visible. I suspect that it will be (only) 2008 before they are recognized as real utility-scale power," Khosla said.

Khosla's upbeat remarks about alternative energies contrast sharply with his views on coal.

He said Wall Street will wake up in the coming year to the risks of further investment in coal as the primary source of fuel to produce U.S. electrical power.

"Fifteen, 20 years ago people didn't think about the political risks around nuclear," Khosla said. "Coal has the same kind of risks today and they just aren't as visible."

With carbon taxes and other anti-coal measures looming, a 50-year return on investment in new plants looks doubtful.

"My bet is that, by the end of the year or early next year ... utility values will be discounted. Market caps will come down for people who are investing or are more dependent on coal. That is going to be a big financial phenomena."

Related News

Are Net-Zero Energy Buildings Really Coming Soon to Mass?

Massachusetts Energy Code Updates align DOER regulations with BBRS standards, advancing Stretch Code and Specialized Code beyond the Base Energy Code to accelerate net-zero construction, electrification, and high-efficiency building performance across municipal opt-in communities.


Key Points

They are DOER-led changes to Base, Stretch, and Specialized Codes to drive net-zero, electrified, efficient buildings.

✅ Updates apply Base, Stretch, or opt-in Specialized Code.

✅ Targets net-zero by 2050 with electrification-first design.

✅ Municipalities choose code path via City Council or Town Meeting.


Massachusetts will soon see significant updates to the energy codes that govern the construction and alteration of buildings throughout the Commonwealth.

As required by the 2021 climate bill, the Massachusetts Department of Energy Resources (DOER) has recently finalized regulations updating the current Stretch Energy Code, previously promulgated by the state's Board of Building Regulations and Standards (BBRS), and establishing a new Specialized Code geared toward achieving net-zero building energy performance.

The final code has been submitted to the Joint Committee on Telecommunications, Utilities, and Energy for review as required under state law, amid ongoing Connecticut market overhaul discussions that could influence regional dynamics.

Under the new regulations, each municipality must apply one of the following:

Base Energy Code - The current Base Energy Code is being updated by the BBRS as part of its routine updates to the full set of building codes. This base code is the default if a municipality has not opted in to an alternative energy code.

Stretch Code - The updated Stretch Code creates stricter guidelines on energy-efficiency for almost all new constructions and alterations in municipalities that have adopted the previous Stretch Code, paralleling 100% carbon-free target in Minnesota and elsewhere to support building decarbonization. The updated Stretch Code will automatically become the applicable code in any municipality that previously opted-in to the Stretch Code.

Specialized Code - The newly created Specialized Code includes additional requirements above and beyond the Stretch Code, designed to get to ensure that new construction is consistent with a net-zero economy by 2050, similar to Canada's clean electricity regulations that set a 2050 decarbonization pathway. Municipalities must opt-in to adopt the Specialized Code by vote of City Council or Town Meeting.

The new codes are much too detailed to summarize in a blog post. You can read more here. Without going into those details here, it is worth noting a few significant policy implications of the new regulations:

With roughly 90% of Massachusetts municipalities having already adopted the prior version of the Stretch Code, the Commonwealth will effectively soon have a new base code that, even if it does not mandate zero-energy buildings, is nonetheless very aggressive in pushing new construction to be as energy-efficient as possible, as jurisdictions such as Ontario clean electricity regulations continue to reshape the power mix.

Although some concerns have been raised about the cost of compliance, particularly in a period of high inflation, and amid solar demand charge debates in Massachusetts, our understanding is that many developers have indicated that they can work with the new regulations without significant adverse impacts.

Of course, the success of the new codes depends on the success of the Commonwealth's efforts to transition quickly to a zero-carbon electrical grid, supported by initiatives like the state's energy storage solicitation to bolster reliability. If the cost of doing so is higher than expected, there could well be public resistance. If new transmission doesn't get built out sufficiently quickly or other problems occur, such that the power is not available to electrify all new construction, that would be a much more significant problem - for many reasons!

In short, the new regulations unquestionably set the Commonwealth on a course to electrify new construction and squeeze carbon emissions out of new buildings. However, as with the rest of our climate goals, there are a lot of moving pieces, including proposals for a clean electricity standard shaping the power sector that are going to have to come together to make the zero-carbon economy a reality.


Related News

View more

COVID-19 pandemic zaps electricity usage in Ontario as people stay home

Ontario Electricity Demand 2020 shows a rare decline amid COVID-19, with higher residential peak load, lower commercial usage, hot-weather air conditioning, nuclear baseload constraints, and smart meter data shaping grid operations and forecasting.


Key Points

It refers to 2020 power use in Ontario: overall demand fell, while residential peaks rose and commercial loads dropped.

✅ Peak load shifted to homes; commercial usage declined.

✅ Hot summers raised peaks; overall annual demand still fell.

✅ Smart meters aid forecasting; grid must balance nuclear baseload.


Demand for electricity in Ontario last year fell to levels rarely seen in decades amid shifts in usage patterns caused by pandemic measures, with Ottawa’s electricity consumption dropping notably, new data show.

The decline came despite a hot summer that had people rushing to crank up the air conditioning at home, the province’s power management agency said, even as the government offered electricity relief to families and small businesses.

“We do have this very interesting shift in who’s using the energy,” said Chuck Farmer, senior director of power system planning with the Independent Electricity System Operator.

“Residential users are using more electricity at home than we thought they would and the commercial consumers are using less.”

The onset of the pandemic last March prompted stay-home orders, businesses to close, and a shuttering of live sports, entertainment and dining out. Social distancing and ongoing restrictions, even as the first wave ebbed and some measures eased, nevertheless persisted and kept many people home as summer took hold and morphed into winter, while the province prepared to extend disconnect moratoriums for residential customers.

System operator data show peak electricity demand rose during a hot summer spell to 24,446 megawatts _ the highest since 2013. Overall, however, Ontario electricity demand last year was the second lowest since 1988, the operator said.

In all, Ontario used 132.2 terawatt-hours of power in 2020, a decline of 2.9 per cent from 2019.

With more people at home during the lockdown, winter residential peak demand has climbed 13 per cent above pre-pandemic levels, even as Hydro One made no cut in peak rates for self-isolating customers, while summer peak usage was up 19 per cent.

“The peaks are getting higher than we would normally expect them to be and this was caused by residential customers _ they’re home when you wouldn’t expect them to be home,” Farmer said.

Matching supply and demand _ a key task of the system operator _ is critical to meeting peak usage and ensuring a stable grid, and the operator has contingency plans with some key staff locked down at work sites to maintain operations during COVID-19, because electricity cannot be stored easily. It is also difficult to quickly raise or lower the output from nuclear-powered generators, which account for the bulk of electricity in the province, as demand fluctuates.

READ MORE: Ontario government extends off-peak electricity rates to Feb. 22

Life patterns have long impacted overall usage. For example, demand used to typically climb around 10 p.m. each night as people tuned into national television newscasts. Livestreaming has flattened that bump, while more energy-efficient lighting led to a drop in provincial demand over the holiday season.

The pandemic has now prompted further intra-day shifts in usage. Fewer people are getting up in the morning and powering up at home before powering down and rushing off to work or school. The summer saw more use of air conditioners earlier than normal after-work patterns.

Weather has always been a key driver of demand for power, accounting for example for the record 27,005 megawatts of usage set on a brutally hot Aug. 1, 2006. Similarly, a mild winter and summer led to an overall power usage drop in 2017.

Still, the profound social changes prompted by the COVID-19 pandemic _ and whether some will be permanent _ have complicated demand forecasting.

“Work patterns used to be much more predictable,” the agency said. “The pandemic has now added another element of variability for electricity demand forecasting.”

Some employees sent home to work have returned to their offices and other workplaces, and many others are likely do so once the pandemic recedes. However, some larger companies have indicated that working from home will be long term.

“Companies like Facebook and Shopify have already stated their intention to make work from home a more permanent arrangement,” the operator said. “This is something our near-term forecasters would take into account when preparing for daily operation of the grid.”

Aggregated data from better smart meters, which show power usage throughout the day, is one method of improving forecasting accuracy, the operator said.


Related News

View more

Hurricane Michael by the numbers: 32 dead, 1.6 million homes, businesses without power

Hurricane Michael Statistics track catastrophic wind speed, storm surge, rainfall totals, power outages, evacuations, and fatalities across Florida and the Southeast, detailing Category 4 intensity, Saffir-Simpson scale impacts, and emergency response resources.


Key Points

Hurricane Michael statistics detail wind speed, storm surge, rainfall, outages, and deaths from Category 4 landfall.

✅ 155 mph landfall winds; 14 ft storm surge; 12 in rainfall max

✅ 1.6M without power; 30,000 restoring crews; 6 states emergency

✅ 325k ordered evacuations; 32 deaths; FEMA and Guard deployed


Hurricane Michael, a historic Category 4 storm, struck the Florida Panhandle early Wednesday afternoon, unleashing heavy rain, high winds and a devastating storm surge.


Here is a look at the dangerous storm by the numbers:

155 mph: Wind speed -- nearly the highest possible for a Category 4 hurricane -- with which Michael made landfall near Mexico Beach and Panama City. A hurricane with 157 mph or higher is a Category 5, the strongest on the Saffir-Simpson hurricane wind scale.

129 mph: Peak wind gust reported Wednesday at Tyndall Air Force Base, which is about 12 miles southeast of Panama City, Florida.

32: Number of storm-related deaths attributed to Michael thus far, including an 11-year-old girl who local officials say was killed when part of a metal carport crashed into her family's mobile home in Lake Seminole, Georgia, and a 38-year-old man who was killed when a tree fell onto his moving car in Statesville, North Carolina.


Waves take over a house as Hurricane Michael comes ashore in Alligator Point, Fla., Oct. 10, 2018.

14 feet: Maximum height forecast for the storm surge when Michael's strong winds pushed the ocean water onto land. A storm surge just over 9 feet was reported Wednesday in Apalachicola, Florida.

12 inches: Isolated maximum amount of rain that Michael was expected to dump across the Florida Panhandle and the state's Big Bend region, as well as in southeast Alabama and parts of southwest and central Georgia.

9 inches: Maximum amount of rain that Michael could bring to isolated areas from Virginia to North Carolina.

1.6 million: Number of homes and businesses without power in Florida, Alabama, Georgia, South Carolina, North Carolina and Virginia as of Friday morning, a reminder that extended outages can persist after major disasters.

30,000: Number of workers mobilized from across the country to help restore power, underscoring the risks of field repairs such as line crew injuries during recovery.

6: Number of states that had emergency declarations in anticipation of Michael: Florida, Alabama, Georgia, South Carolina, North Carolina and Virginia.

325,000: Estimated number of people in the storm's path who were told to evacuate by local authorities.

6,000: Approximate number of people who stayed in the roughly 80 shelters across Florida, Alabama, Georgia, South Carolina and North Carolina on Wednesday night, while those sheltering at home were urged to avoid overheated power strips that can spark fires.

3,000: Number of personnel the Federal Emergency Management Agency deployed ahead of landfall, while utilities prepared on-site staffing plans to maintain operations during widespread disruptions.

35: Number of counties in Florida, of the state's 67, where Gov. Rick Scott declared a state of emergency prior to landfall, and grid reliability warnings often underscore systemic risks during national emergencies.

3,500: Number of Florida National Guard troops activated for pre-landfall coordination and planning, with an emphasis on high water and search-and-rescue operations.

600: Number of Florida state troopers assigned to the Panhandle and Big Bend region to assist with response and recovery efforts, including public reminders about downed line safety in affected communities.

500: Number of disaster relief workers that the American Red Cross was sending to affected areas in the Sunshine State.

200: Approximate number of patients being evacuated from at least two hospitals in Florida due to damage from the hurricane, highlighting how critical facilities depend on staff who have raised workforce safety concerns during other crises. Bay Medical Center Sacred Heart in Panama City said in a statement Thursday that its facility was damaged during the storm and thus is transferring more than 200 patients, including 39 who are critically ill, to regional hospitals. Gulf Coast Regional Medical Center, also in Panama City, announced in a statement Thursday that it's evacuating its roughly approximately patients, starting with the most critically ill, "because of the infrastructure challenges in our community."


Related News

View more

France nuclear power stations to limit energy output due to high river temps

France Nuclear Heatwave Restrictions signal reduced nuclear power along the Rhone River as EDF imposes output limits due to high water temperatures, grid needs, with minimal price impact amid strong solar and exports.


Key Points

Temporary EDF output limits at Rhone River reactors due to hot water, protecting ecosystems and grid reliability.

✅ EDF expects halved output at Bugey and Saint Alban.

✅ Cuts align with water temperature and discharge rules.

✅ Weekend midday curtailments offset by solar supply.


The high temperature warning has come early this year but will affect fewer nuclear power plants. High temperatures could halve nuclear power production, with river temperature limits at plants along France's Rhone River this week. 

Output restrictions are expected at two nuclear plants in eastern France due to high temperature forecasts, nuclear operator EDF said. It comes several days ahead of a similar warning that was made last year but will affect fewer plants, and follows a period when power demand has held firm during lockdowns across Europe.

The hot weather is likely to halve the available power supply from the 3.6 GW Bugey plant from 13 July and the 2.6 GW Saint Alban plant from 16 July, the operator said.

However, production will be at least 1.8 GW at Bugey and 1.3 GW at Saint Alban to meet grid requirements, and may change according to grid needs, the operator said.

Kpler analyst Emeric de Vigan said the restrictions were likely to have little effect on output in practice. Cuts are likely only at the weekend or midday when solar output was at its peak so the impact on power prices would be slim.

He said the situation would need monitoring in the coming weeks, however, noting it was unusually early in the summer for nuclear-powered France to see such restrictions imposed.

Water temperatures at the Bugey plant already eclipsed the initial threshold for restrictions on 9 July, as European power hits records during the heatwave. They are currently forecast to peak next week and then drop again, Refinitiv data showed.

"France is currently net exporting large amounts of power – and, despite a nuclear power dispute with Germany, single nuclear units' supply restrictions will not have the same effect as last year," Refinitiv analyst Nathalie Gerl said.

The Garonne River in southern France has the highest potential for critical levels of warming, but its Golfech plant is currently offline for maintenance until mid-August, as Europe faces nuclear losses, the data showed.

"(The restrictions were) to be expected and it will probably occur more often," Greenpeace campaigner Roger Spautz said.

"The authorities must stick to existing regulations for water discharges. Otherwise, the ecosystems will be even more affected," he added.


Related News

View more

California proposes income-based fixed electricity charges

Income Graduated Fixed Charge aligns CPUC billing with utility fixed costs, lowers usage rates, supports electrification, and shifts California investor-owned utilities' electric bills by income, with CARE and Climate Credit offsets for low-income households.


Key Points

A CPUC proposal: an income-based monthly fixed fee with lower usage rates to align costs and aid low-income customers.

✅ Income-tiered fixed fees: $0-$42; CARE: $14-$22, by utility territory

✅ Usage rates drop 16%-22% to support electrification and cost-reflective billing

✅ Lowest-income save ~$10-$20; some higher earners pay ~$10+ more monthly


The Public Advocates Office (PAO) for the California Public Utilities Commission (CPUC) has proposed adding a monthly income-based fixed charge on electric utility bills based on income level.  

The rate change is designed to lower bills for the lowest-income residents while aligning billing more directly with utility costs. 

PAO’s recommendation for the Income Graduated Fixed Charge places fees between $22 and $42 per month in the three major investor-owned utilities’ territories, including an SDG&E minimum charge debate under way, for customers not enrolled in the California Alternative Rates for Energy (CARE) program. As seen below, CARE customers would be charged between $14 per month and $22 a month, depending on income level and territory.

For households earning $50,000 or less per year, the fixed charge would be $0, but only if the California Climate Credit is applied to offset the fixed cost.

Meanwhile, usage-based electricity rates are lowered in the PAO proposal, part of major changes to electric bills statewide. Average rates would be reduced between 16% to 22% for the three major investor-owned utilities.

The lowest-income bracket of Californians is expected to save roughly $10 to $20 a month under the proposal, while middle-income customers may see costs rise by about $20 a month, even as lawmakers seek to overturn income-based charges in Sacramento.

“We anticipate the vast majority of low-income customers ($50,000 or less per year) will have their monthly bills decrease by $10 or more, and a small proportion of the highest income earners ($100,000+ per year) will see their monthly bills rise by $10 or more,” said the PAO.

The charges are an effort to help suppress ever-increasing electricity generation and transmission rates, which are among the highest in the country, with soaring electricity prices reported across California. Rates are expected to rise sharply as wildfire mitigation efforts are implemented by the utilities found at fault for their origin.

“We are very concerned. However, we do not see the increases stopping at this point,” Linda Serizawa, deputy director for energy, PAO, told pv magazine. “We think the pace and scale of the [rate] increases is growing faster than we would have anticipated for several years now.”

Consumer advocates and regulators face calls for action on surging electricity bills across the state.

The proposed changes are also meant to more directly couple billing with the fixed charges that utilities incur, as California considers revamping electricity rates to clean the grid. For example, activities like power line maintenance, energy efficiency programs, and wildfire prevention are not expected to vary with usage, so these activities would be funded through a fixed charge.

Michael Campbell of the PAO’s customer programs team, and leader of the proposed program, likened paying for grid enhancements and other social programs with utility rate increases to “paying for food stamps by taxing food.” Instead, a fixed charge would cover these costs.

PAO said the move to lower rates for usage should help encourage electrification as California moves to replace heating and cooling, appliances, and gas combustion cars with electrified counterparts. In addition, lower rates mean the cost burden of running these devices is improved.


Related News

View more

German renewables deliver more electricity than coal and nuclear power for the first time

Germany renewable energy milestone 2019 saw wind, solar, hydropower, and biomass outproduce coal and nuclear, as low gas prices and high CO2 costs under the EU ETS reshaped the electricity mix, per Fraunhofer ISE.


Key Points

It marks H1 2019 when renewables supplied 47.3% of Germany's electricity, surpassing coal and nuclear.

✅ Driven by high CO2 prices and cheap natural gas

✅ Wind and solar output rose; coal generation declined sharply

✅ Flexible gas plants outcompeted inflexible coal units


In Lippendorf, Saxony, the energy supplier EnBW is temporarily taking part of a coal-fired power plant offline. Not because someone ordered it — it simply wasn't paying off. Gas prices are low, CO2 prices are high, and with many hours of sunshine and wind, renewable methods are producing a great deal of electricity as part of Germany's energy transition now reshaping operations. And in the first half of the year there was plenty of sun and wind.

The result was a six-month period in which renewable energy sources, a trend echoed by the EU wind and solar record across the bloc, produced more electricity than coal and nuclear power plants together. For the first time 47.3% of the electricity consumers used came from renewable sources, while 43.4% came from coal-fired and nuclear power plants.

In addition to solar and wind power, renewable sources also include hydropower and biomass. Gas supplied 9.3%, reflecting how renewables are crowding out gas across European power markets, while the remaining 0.4% came from other sources, such as oil, according to figures published by the Fraunhofer Institute for Solar Energy Systems in July.

Fabian Hein from the think tank Agora Energiewende stresses that the situation is only a snapshot in time, with grid expansion woes still shaping outcomes. For example, the first half of 2019 was particularly windy and wind power production rose by around 20% compared to the first half of 2018.

Electricity production from solar panels rose by 6%, natural gas by 10%, while the share of nuclear power in German electricity consumption has remained virtually unchanged despite a nuclear option debate in climate policy.

Coal, on the other hand, declined. Black coal energy production fell by 30% compared to the first half of 2018, lignite fell by 20%. Some coal-fired power plants were even taken off the grid, even as coal still provides about a third of Germany's electricity. It is difficult to say whether this was an effect of the current market situation or whether this is simply part of long-term planning, says Hein.


Activists storm German mine in anti-coal protest

It is clear, however, that an increased CO2 price has made the ongoing generation of electricity from coal more expensive. Gas-fired power plants also emit CO2, but less than coal-fired power plants. They are also more efficient and that's why gas-fired power plants are not so strongly affected by the CO2 price

The price is determined at a European level and covers power plants and energy intensive industries in Europe. Other areas, such as heating or transport are not covered by the CO2 price scheme. Since a reform of CO2 emissions trading in 2017, the price has risen sharply. Whereas in September 2016 it was just over €5 ($5.6), by the end of June 2019 it had climbed to over €26.


Ups and downs

Gas as a raw material is generally more expensive than coal. But coal-fired power plants are more expensive to build. This is why operators want to run them continuously. In times of high demand, and therefore high prices, gas-fired power plants are generally started up, as seen when European power demand hit records during recent heatwaves, since it is worth it at these times.

Gas-fired power plants can be flexibly ramped up and down. Coal-fired power plants take 11 hours or longer to get going. That's why they can't be switched on quickly for short periods when prices are high, like gas-fired power plants. In the first half of the year, however, coal-fired power plants were also ramped up and down more often because it was not always worthwhile to let the power plant run around the clock.

Because gas prices were particularly low in the first half of 2019, some gas-fired power plants were more profitable than coal-fired plants. On June 29, 2019, the gas price at the Dutch trading point TTF was around €10 per megawatt hour. A year earlier, it had been almost €20. This is partly due to the relatively mild winter, as there is still a lot of gas in reserve, confirmed a spokesman for the Federal Association of the Energy and Water Industries (BDEW). There are also several new export terminals for liquefied natural gas. Additionally, weaker growth and trade wars are slowing demand for gas. A lot of gas comes to Europe, where prices are still comparatively high, reported the Handelsblatt newspaper.

The increase in wind and solar power and the decline in nuclear power have also reduced CO2 emissions. In the first half of 2019, electricity generation emitted around 15% less CO2 than in the same period last year, reported BDEW. However, the association demands that the further expansion of renewable energies should not be hampered. The target of 65% renewable energy can only be achieved if the further expansion of renewable energy sources is accelerated.


Related News

View more

Sign Up for Electricity Forum’s Newsletter

Stay informed with our FREE Newsletter — get the latest news, breakthrough technologies, and expert insights, delivered straight to your inbox.

Electricity Today T&D Magazine Subscribe for FREE

Stay informed with the latest T&D policies and technologies.
  • Timely insights from industry experts
  • Practical solutions T&D engineers
  • Free access to every issue

Live Online & In-person Group Training

Advantages To Instructor-Led Training – Instructor-Led Course, Customized Training, Multiple Locations, Economical, CEU Credits, Course Discounts.

Request For Quotation

Whether you would prefer Live Online or In-Person instruction, our electrical training courses can be tailored to meet your company's specific requirements and delivered to your employees in one location or at various locations.