Substation Relay Protection Training
Our customized live online or in‑person group training can be delivered to your staff at your location.

- Live Online
- 12 hours Instructor-led
- Group Training Available
Regular Price:
$699
Coupon Price:
$599
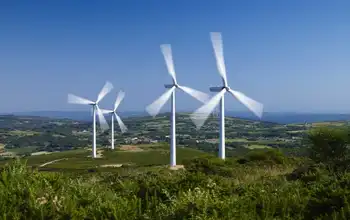
Victoria, British Columbia-based wind farm developer EarthFirst Canada said that it has signed three "standard offer" contracts with the Ontario Power Authority to develop 30 MW of wind projects. It hopes to soon sign a fourth 10 MW deal.
Under OPA's standard-offer program, the agency agrees to enter into 20 year power purchase agreements of up to 10 MW each with developers who propose small wind farms.
OPA pays the developers a standard rate – $110/MWh – for their wind power.
EarthFirst said that it is exploring the potential for more than 2,500 MW of wind projects, including "174 MW, which is expected to be in commercial production by the end of 2009, and an additional 226 MW, which are fully permitted and expected to be tendered into the BC Clean Power call this year."
Related News

Electricity use actually increased during 2018 Earth Hour, BC Hydro
Earth Hour BC highlights BC Hydro data on electricity use, energy savings, and participation in…
View more
Spain's power demand in April plummets under COVID-19 lockdown
Spain Electricity Demand April 2020 saw a 17.3% year-on-year drop as COVID-19 lockdown curbed activity;…
View more
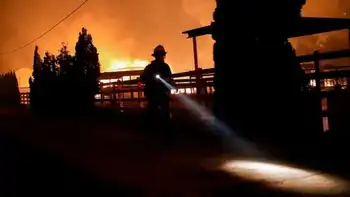
California faces huge power cuts as wildfires rage
California Wildfire Power Shut-Offs escalate as PG&E imposes blackouts amid high winds, Getty and Kincade…
View more
"Knowledge Gap" Is Contributing To On-the-job Electrical Injuries
BC Hydro Trades Electrical Safety addresses electric contact incidents among trade workers, emphasizing power line…
View more
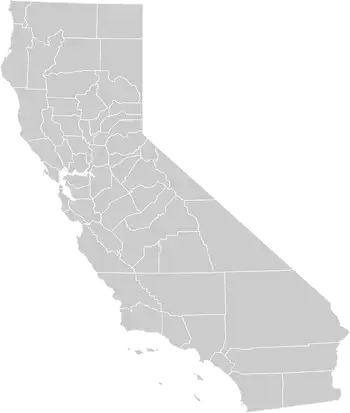
California electricity pricing changes pose an existential threat to residential rooftop solar
California Rooftop Solar Rate Reforms propose shifting net metering to fixed access fees, peak-demand charges,…
View more
Manitoba Government Extends Pause on New Cryptocurrency Connections
Manitoba Crypto Mining Electricity Pause signals a moratorium to manage grid strain, Manitoba Hydro capacity,…
View more
Sign Up for Electricity Forum’s Newsletter
Stay informed with our FREE Newsletter — get the latest news, breakthrough technologies, and expert insights, delivered straight to your inbox.
Electricity Today T&D Magazine Subscribe for FREE

Stay informed with the latest T&D policies and technologies.
- Timely insights from industry experts
- Practical solutions T&D engineers
- Free access to every issue

