Hornsea One Offshore Wind Farm delivers first power to the UK grid, scaling renewable energy with 1.2GW capacity, giant offshore turbines, and Yorkshire coast infrastructure to replace delayed nuclear and cut fossil fuel emissions.
Key Points
Hornsea One Offshore Wind Farm is a 1.2GW UK project delivering offshore renewable power to about 1 million homes.
✅ 174 turbines over 407 km2; Siemens Gamesa supply chain in the UK
✅ 1.2GW capacity can power ~1m homes; phases scale with 10MW+ turbines
✅ Supports UK grid, replaces delayed nuclear, cuts fossil generation
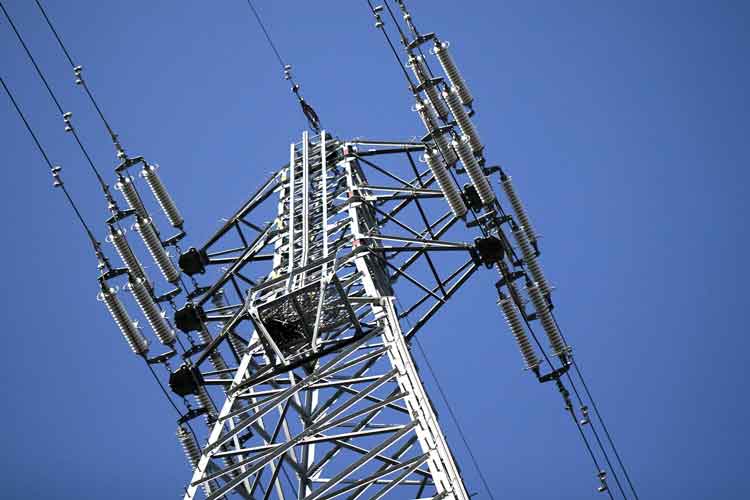
An offshore windfarm on the Yorkshire coast that will dwarf the world’s largest when completed is to supply its first power to the UK electricity grid this week, mirroring advances in tidal electricity projects delivering to the grid as well.
The Danish developer Ørsted, which has installed the first of 174 turbines at Hornsea One, said it was ready to step up its plans and fill the gap left by failed nuclear power schemes.
The size of the project takes the burgeoning offshore wind power sector to a new scale, on a par with conventional fossil fuel-fired power stations.
Hornsea One will cover 407 square kilometres, five times the size of the nearby city of Hull. At 1.2GW of capacity it will power 1m homes, making it about twice as powerful as today’s biggest offshore windfarm once it is completed in the second half of this year.
“The ability to generate clean electricity offshore at this scale is a globally significant milestone at a time when urgent action needs to be taken to tackle climate change,” said Matthew Wright, UK managing director of Ørsted, the world’s biggest offshore windfarm builder.
The power station is only the first of four planned in the area, with a green light and subsidies already awarded to a second stage due for completion in the early 2020s, and interest from Japanese utilities underscoring growing investor appetite.
The first two phases will use 7MW turbines, which are taller than London’s Gherkin building.
But the latter stages of the Hornsea development could use even more powerful, 10MW-plus turbines. Bigger turbines will capture more of the energy from the wind and should lower costs by reducing the number of foundations and amount of cabling firms need to put into the water, with developers noting that offshore wind can compete with gas in the U.S. as costs fall.
Henrik Poulsen, Ørsted’s chief executive, said he was in close dialogue with major manufacturers to use the new generation of turbines, some of which are expected to approach the height of the Shard in London, the tallest building in the EU.
The UK has a great wind resource and shallow enough seabed to exploit it, and could even “power most of Europe if it [the UK] went to the extreme with offshore”, he said.
Offshore windfarms could help ministers fill the low carbon power gap created by Hitachi and Toshiba scrapping nuclear plants, the executive suggested. “If nuclear should play less of a role than expected, I believe offshore wind can step up,” he said.
New nuclear projects in Europe had been “dramatically delayed and over budget”, he added, in comparison to “the strong track record for delivering offshore [wind]”.
The UK and Germany installed 85% of new offshore wind power capacity in the EU last year, according to industry data, with wind leading power across several markets. The average power rating of the turbines is getting bigger too, up 15% in 2018.
The turbines for Hornsea One are built and shipped from Siemens Gamesa’s factory in Hull, part of a web of UK-based suppliers that has sprung up around the growing sector, such as Prysmian UK's land cables supporting grid connections.
Around half of the project’s transition pieces, the yellow part of the structure that connects the foundation to the tower, are made in Teeside. Many of the towers themselves are made by a firm in Campbeltown in the Scottish highlands. Altogether, about half of the components for the project are made in the UK.
Ørsted is not yet ready to bid for a share of a £60m pot of further offshore windfarm subsidies, to be auctioned by the government this summer, but expects the price to reach even more competitive levels than those seen in 2017.
Like other international energy companies, Ørsted has put in place contingency planning in event of a no-deal Brexit – but the hope is that will not come to pass. “We want a Brexit deal that will facilitate an orderly transition out of the union,” said Poulsen.
Related News