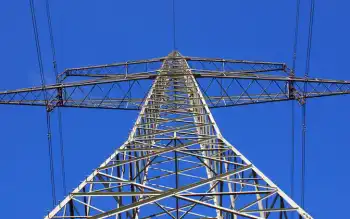
Power restored to almost all Brooklyn customers

By Associated Press


High Voltage Maintenance Training Online

Our customized live online or in‑person group training can be delivered to your staff at your location.

  • Live Online
  • 12 hours Instructor-led
  • Group Training Available
Regular Price:
$599
Coupon Price:
$499
Reserve Your Seat Today
Power has been restored to nearly all the 1,100 Consolidated Edison utility customers who lost electricity in several Brooklyn neighborhoods. Con Edison says all but about 15 of the customers have service.

Up to nearly 2,000 customers had been without power beginning the morning of July 20.

People in the Sunset Park, Bay Ridge, Borough Park and Park Slope neighborhoods had been asked to stop using all nonessential electrical appliances, including air conditioning.

The utility says as of Sunday night it suspended its request for those customers to reduce their electricity use.

Con Ed says it had reduced voltage in the area by 8 percent while failed electrical lines were being repaired.

Related News

Vehicle-to-grid could be ‘capacity on wheels’ for electricity networks

Vehicle-to-Grid (V2G) enables EV batteries to provide grid balancing, flexibility, and demand response, integrating renewables with bidirectional charging, reducing peaker plant reliance, and unlocking distributed energy storage from millions of connected electric vehicles.


Key Points

Vehicle-to-Grid (V2G) lets EVs export power via bidirectional charging to balance grids and support renewables.

✅ Turns parked EVs into distributed energy storage assets

✅ Delivers balancing services and demand response to the grid

✅ Cuts peaker plant use and supports renewable integration


“There are already many Gigawatt-hours of batteries on wheels”, which could be used to provide balance and flexibility to electrical grids, if the “ultimate potential” of vehicle-to-grid (V2G) technology could be harnessed.

That’s according to a panel of experts and stakeholders convened by our sister site Current±, which covers the business models and technologies inherent to the low carbon transition to decentralised and clean energy. Focusing mainly on the UK grid but opening up the conversation to other territories and the technologies themselves, representatives including distribution network operator (DNO) Northern Powergrid’s policy and markets director and Nissan Europe’s director of energy services debated the challenges, benefits and that aforementioned ultimate potential.

Decarbonisation of energy systems and of transport go hand-in-hand amid grid challenges from rising EV uptake, with vehicle fuel currently responsible for more emissions than electricity used for energy elsewhere, as Ian Cameron, head of innovation at DNO UK Power Networks says in the Q&A article.

“Furthermore, V2G technology will further help decarbonisation by replacing polluting power plants that back up the electrical grid,” Marc Trahand from EV software company Nuvve Corporation added, pointing to California grid stability initiatives as a leading example.

While the panel states that there will still be a place for standalone utility-scale energy storage systems, various speakers highlighted that there are over 20GWh of so-called ‘batteries on wheels’ in the US, capable of powering buildings as needed, and up to 10 million EVs forecast for Britain’s roads by 2030.

“…it therefore doesn’t make sense to keep building expensive standalone battery farms when you have all this capacity on wheels that just needs to be plugged into bidirectional chargers,” Trahand said.


Related News

View more

Cleaning up Canada's electricity is critical to meeting climate pledges

Canada Clean Electricity Standard targets a net-zero grid by 2035, using carbon pricing, CO2 caps, and carbon capture while expanding renewables and interprovincial trade to decarbonize power in Alberta, Saskatchewan, and Ontario.


Key Points

A federal plan to reach a net-zero grid by 2035 using CO2 caps, carbon pricing, carbon capture, renewables, and trade.

✅ CO2 caps and rising carbon prices through 2050

✅ Carbon capture required on gas plants in high-emitting provinces

✅ Renewables build-out and interprovincial trade to balance supply


A new tool has been proposed in the federal election campaign as a way of eradicating the carbon emissions from Canada’s patchwork electricity system. 

As the country’s need for power grows through the decarbonization of transportation, industry and space heating, the Liberal Party climate plan is proposing a clean energy standard to help Canada achieve a 100% net-zero-electricity system by 2035, aligning with Canada’s net-zero by 2050 target overall. 

The proposal echoes a report released August 19 by the David Suzuki Foundation and a group of environmental NGOs that also calls for a clean electricity standard, capping power-sector emissions, and tighter carbon-pricing regulations. The report, written by Simon Fraser University climate economist Mark Jaccard and data analyst Brad Griffin, asserts that these policies would effectively decarbonize Canada’s electricity system by 2035.

“Fuel switching from dirty fossil fuels to clean electricity is an essential part of any serious pathway to transition to a net-zero energy system by 2050,” writes Tom Green, climate policy advisor to the Suzuki Foundation, in a foreword to the report. The pathway to a net-zero grid is even more important as Canada switches from fossil fuels to electric vehicles, space heating and industrial processes, even as the Canadian Gas Association warns of high transition costs.

Under Jaccard and Griffin’s proposal, a clean electricity standard would be established to regulate CO2 emissions specifically from power plants across Canada. In addition, the plan includes an increase in the carbon price imposed on electricity system releases, combined with tighter regulation to ensure that 100% of the carbon price set by the federal government is charged to electricity producers. The authors propose that the current scheduled carbon price of $170 per tonne of CO2 in 2030 should rise to at least $300 per tonne by 2050.

In Alberta, Saskatchewan, Ontario, New Brunswick and Nova Scotia, the 2030 standard would mean that all fossil-fuel-powered electricity plants would require carbon capture in order to comply with the standard. The provinces would be given until 2035 to drop to zero grams CO2 per kilowatt hour, matching the 2030 standard for low-carbon provinces (Quebec, British Columbia, Manitoba, Newfoundland and Labrador and Prince Edward Island). 

Alberta and Saskatchewan targeted 
Canada has a relatively clean electricity system, as shown by nationwide progress in electricity, with about 80% of the country’s power generated from low- or zero-emission sources. So the biggest impacts of the proposal will be felt in the higher-carbon provinces of Alberta and Saskatchewan. Alberta has a plan to switch from coal-based electric power to natural gas generation by 2023. But Saskatchewan is still working on its plan. Under the Jaccard-Griffin proposal, these provinces would need to install carbon capture on their gas-fired plants by 2030 and carbon-negative technology (biomass with carbon capture, for instance) by 2035. Saskatchewan has been operating carbon capture and storage technology at its Boundary Dam power station since 2014, but large-scale rollout at power plants has not yet been achieved in Canada. 

With its heavy reliance on nuclear and hydro generation, Ontario’s electricity supply is already low carbon. Natural gas now accounts for about 7% of the province’s grid, but the clean electricity standard could pose a big challenge for the province as it ramps up natural-gas-generated power to replace electricity from its aging Pickering station, scheduled to go out of service in 2025, even as a fully renewable grid by 2030 remains a debated goal. Pickering currently supplies about 14% of Ontario’s power. 

Ontario doesn’t have large geological basins for underground CO2 storage, as Alberta and Saskatchewan do, so the report says Ontario will have to build up its solar and wind generation significantly as part of Canada’s renewable energy race, or find a solution to capture CO2 from its gas plants. The Ontario Clean Air Alliance has kicked off a campaign to encourage the Ontario government to phase out gas-fired generation by purchasing power from Quebec or installing new solar or wind power.

As the report points out, the federal government has Supreme Court–sanctioned authority to impose carbon regulations, such as a clean electricity standard, and carbon pricing on the provinces, with significant policy implications for electricity grids nationwide.

The federal government can also mandate a national approach to CO2 reduction regardless of fuel source, encouraging higher-carbon provinces to work with their lower-carbon neighbours. The Atlantic provinces would be encouraged to buy power from hydro-heavy Newfoundland, for example, while Ontario would be encouraged to buy power from Quebec, Saskatchewan from Manitoba, and Alberta from British Columbia.

The Canadian Electricity Association, the umbrella organization for Canada’s power sector, did not respond to a request for comment on the Jaccard-Griffin report or the Liberal net-zero grid proposal.

Just how much more clean power will Canada need? 
The proposal has also kicked off a debate, and an IEA report underscores rising demand, about exactly how much additional electricity Canada will need in coming decades.

In his 2015 report, Pathways to Deep Decarbonization in Canada, energy and climate analyst Chris Bataille estimated that to achieve Canada’s climate net-zero target by 2050 the country will need to double its electricity use by that year.

Jaccard and Griffin agree with this estimate, saying that Canada will need more than 1,200 terawatt hours of electricity per year in 2050, up from about 640 terawatt hours currently.

But energy and climate consultant Ralph Torrie (also director of research at Corporate Knights) disputes this analysis.

He says large-scale programs to make the economy more energy efficient could substantially reduce electricity demand. A major program to install heat pumps and replace inefficient electric heating in homes and businesses could save 50 terawatt hours of consumption on its own, according to a recent report from Torrie and colleague Brendan Haley. 

Put in context, 50 terawatt hours would require generation from 7,500 large wind turbines. Applied to electric vehicle charging, 50 terawatt hours could power 10 million electric vehicles.

While Torrie doesn’t dispute the need to bring the power system to net-zero, he also doesn’t believe the “arm-waving argument that the demand for electricity is necessarily going to double because of the electrification associated with decarbonization.” 


Related News

View more

Electricity prices spike in Alberta

Alberta electricity price spike drives 25% CPI surge amid heatwave demand, coal-to-gas conversions, hydro shortfalls, and outages; consumers weigh fixed-rate plans, solar panels, home retrofits, and variable rates to manage bills and grid volatility.


Key Points

A recent 25% monthly rise in Alberta power prices driven by heatwave demand, constraints, outages, and fuel shifts.

✅ Heatwave pushed summer peak demand near record

✅ Coal-to-gas conversions and outages tightened supply

✅ Fixed-rate plans, solar, retrofits can reduce bill risk


Albertans might notice they are paying more when the next electricity bill comes in as bills on the rise in Calgary alongside provincial trends.

According to the consumer price index, Alberta saw its largest monthly increase since July 2015 as the price of electricity in Alberta rose 25 per cent amid rising electricity prices across the province.

“So I paid negative $70 last month. I actually made money. To supply power to the grid,” said Conrad Nobert, with Climate Action Edmonton.

Norbert is an environmental activist who favours solar power and is warning that prices will continue to go up along with the rising effects from climate change.

“My thoughts are that we can mitigate the price of power going up by taking climate action.”

Alberta experienced one of the hottest summers on record and many people were left scrambling to buy air conditioners.

That demand, along with a number of other factors, drove up prices, prompting some households to lock in rates for protection, says an assistant professor at the University of Calgary who teaches electricity systems.

“At the end of June, during the heatwave, we were a couple megawatts shy of setting an all-time record demand for electricity in the province. That would have been the first time that record for demand in the summer. Traditionally Alberta is a winter peaking province, as shown by an electricity usage record during a deep freeze not long ago,” explained Sara Hastings Simon, an assistant professor at the University of Calgary.

Other reasons for the spike: Alberta’s continuing shift from coal to natural-gas-fired power and changes to electricity production and pricing across the market.

There are a few ways consumers can save money on their power bill; installing solar panels and retrofitting your home to opting for a fixed-rate plan, or considering protections like a consumer price cap where applicable.

“So by default, people are put into a variable rate plan, that changes month to month and that helps to manage prices so you don’t get that big surprise at where prices might be. I think we will get a lot more people looking at that option.”

A statement provided by Dale Nally, Alberta’s Associate Minister of natural gas and electricity, noted recent policy changes including the carbon tax repeal and price cap now in place that affect consumers, says in part:

“This period of high market prices is driven by low supplies of hydro-generated electricity from British Columbia and the pacific northwest, scheduled outages for coal-gas-conversions, unplanned infrastructure outages and unprecedented, and record-breaking high demand due to hot weather. We expect some of the factors that have caused recent increases in prices will be short-term.”


Related News

View more

Which of the cleaner states imports dirty electricity?

Hourly Electricity Emissions Tracking maps grid balancing areas, embodied emissions, and imports/exports, revealing carbon intensity shifts across PJM, ERCOT, and California ISO, and clarifying renewable energy versus coal impacts on health and climate.


Key Points

An hourly method tracing generation, flows, and embodied emissions to quantify carbon intensity across US balancing areas.

✅ Hourly traces of imports/exports and generation mix

✅ Consumption-based carbon intensity by balancing area

✅ Policy insights for renewables, coal, health costs


In the United States, electricity generation accounts for nearly 30% of our carbon emissions. Some states have responded to that by setting aggressive renewable energy standards; others are hoping to see coal propped up even as its economics get worse. Complicating matters further is the fact that many regional grids are integrated, and as America goes electric the stakes grow, meaning power generated in one location may be exported and used in a different state entirely.

Tracking these electricity exports is critical for understanding how to lower our national carbon emissions. In addition, power from a dirty source like coal has health and environment impacts where it's produced, and the costs of these aren't always paid by the parties using the electricity. Unfortunately, getting reliable figures on how electricity is produced and where it's used is challenging, even for consumers trying to find where their electricity comes from in the first place, leaving some of the best estimates with a time resolution of only a month.

Now, three Stanford researchers—Jacques A. de Chalendar, John Taggart, and Sally M. Benson—have greatly improved on that standard, and they have managed to track power generation and use on an hourly basis. The researchers found that, of the 66 grid balancing areas within the United States, only three have carbon emissions equivalent to our national average, and they have found that imports and exports of electricity have both seasonal and daily changes. de Chalendar et al. discovered that the net results can be substantial, with imported electricity increasing California's emissions/power by 20%.

Hour by hour
To figure out the US energy trading landscape, the researchers obtained 2016 data for grid features called balancing areas. The continental US has 66 of these, providing much better spatial resolution on the data than the larger grid subdivisions. This doesn't cover everything—several balancing areas in Canada and Mexico are tied in to the US grid—and some of these balancing areas are much larger than others. The PJM grid, serving Pennsylvania, New Jersey, and Maryland, for example, is more than twice as large as Texas' ERCOT, in a state that produces and consumes the most electricity in the US.

Despite these limitations, it's possible to get hourly figures on how much electricity was generated, what was used to produce it, and whether it was used locally or exported to another balancing area. Information on the generating sources allowed the researchers to attach an emissions figure to each unit of electricity produced. Coal, for example, produces double the emissions of natural gas, which in turn produces more than an order of magnitude more carbon dioxide than the manufacturing of solar, wind, or hydro facilities. These figures were turned into what the authors call "embodied emissions" that can be traced to where they're eventually used.

Similar figures were also generated for sulfur dioxide and nitrogen oxides. Released by the burning of fossil fuels, these can both influence the global climate and produce local health problems.

Huge variation
The results were striking. "The consumption-based carbon intensity of electricity varies by almost an order of magnitude across the different regions in the US electricity system," the authors conclude. The low is the Bonneville Power grid region, which is largely supplied by hydropower; it has typical emissions below 100kg of carbon dioxide per megawatt-hour. The highest emissions come in the Ohio Valley Electric region, where emissions clear 900kg/MW-hr. Only three regional grids match the overall grid emissions intensity, although that includes the very large PJM (where capacity auction payouts recently fell), ERCOT, and Southern Co balancing areas.

Most of the low-emissions power that's exported comes from the Pacific Northwest's abundant hydropower, while the Rocky Mountains area exports electricity with the highest associated emissions. That leads to some striking asymmetries. Local generation in the hydro-rich Idaho Power Company has embodied emissions of only 71kg/MW-hr, while its imports, coming primarily from Rocky Mountain states, have a carbon content of 625kg/MW-hr.

The reliance on hydropower also makes the asymmetry seasonal. Local generation is highest in the spring as snow melts, but imports become a larger source outside this time of year. As solar and wind can also have pronounced seasonal shifts, similar changes will likely be seen as these become larger contributors to many of these regional grids. Similar things occur daily, as both demand and solar production (and, to a lesser extent, wind) have distinct daily profiles.

The Golden State
California's CISO provides another instructive case. Imports represent less than 30% of its total electric use in 2016, yet California electricity imports provided 40% of its embodied emissions. Some of these, however, come internally from California, provided by the Los Angeles Department of Water and Power. The state itself, however, has only had limited tracking of imported emissions, lumping many of its sources as "other," and has been exporting its energy policies to Western states in ways that shape regional markets.

Overall, the 2016 inventory provides a narrow picture of the US grid, as plenty of trends are rapidly changing our country's emissions profile, including the rise of renewables and the widespread adoption of efficiency measures and other utility trends in 2017 that continue to evolve. The method developed here can, however, allow for annual updates, providing us with a much better picture of trends. That could be quite valuable to track things like how the rapid rise in solar power is altering the daily production of clean power.

More significantly, it provides a basis for more informed policymaking. States that wish to promote low-emissions power can use the information here to either alter the source of their imports or to encourage the sites where they're produced to adopt more renewable power. And those states that are exporting electricity produced primarily through fossil fuels could ensure that the locations where the power is used pay a price that includes the health costs of its production.


Related News

View more

Californians Learning That Solar Panels Don't Work in Blackouts

Rooftop Solar Battery Backup helps Californians keep lights on during PG&E blackouts, combining home energy storage with grid-tied systems for wildfire prevention, outage resilience, and backup power when solar panels cannot supply nighttime demand.


Key Points

A home battery paired with rooftop solar, providing backup power and blackout resilience when the grid is down.

✅ Works when grid is down; panels alone stop for safety.

✅ Requires home battery storage; market adoption is growing.

✅ Supports wildfire mitigation and PG&E outage preparedness.


Californians have embraced rooftop solar panels more than anyone in the U.S., but amid California's solar boom many are learning the hard way the systems won’t keep the lights on during blackouts.

That’s because most panels are designed to supply power to the grid -- not directly to houses, though emerging peer-to-peer energy models may change how neighbors share power in coming years. During the heat of the day, solar systems can crank out more juice than a home can handle, a challenge also seen in excess solar risks in Australia today. Conversely, they don’t produce power at all at night. So systems are tied into the grid, and the vast majority aren’t working this week as PG&E Corp. cuts power to much of Northern California to prevent wildfires, even as wildfire smoke can dampen solar output during such events.

The only way for most solar panels to work during a blackout is pairing them with solar batteries that store excess energy. That market is just starting to take off. Sunrun Inc., the largest U.S. rooftop solar company, said some of its customers are making it through the blackouts with batteries, but it’s a tiny group -- countable in the hundreds.

“It’s the perfect combination for getting through these shutdowns,” Sunrun Chairman Ed Fenster said in an interview. He expects battery sales to boom in the wake of the outages, as the state has at times reached a near-100% renewables mark that heightens the need for storage.

And no, trying to run appliances off the power in a Tesla Inc. electric car won’t work, at least without special equipment, and widespread U.S. power-outage risks are a reminder to plan for home backup.


Related News

View more

Energy dashboard: how is electricity generated in Great Britain?

Great Britain electricity generation spans renewables and baseload: wind, solar, nuclear, gas, and biomass, supported by National Grid interconnectors, embedded energy estimates, and BMRS data for dynamic imports and exports across Europe.


Key Points

A diverse, weather-driven mix of renewables, gas, nuclear, and imports coordinated by National Grid.

✅ Baseload from nuclear and biomass; intermittent wind and solar

✅ Interconnectors trade zero carbon imports via subsea cables

✅ Data from BMRS and ESO covers embedded energy estimates


Great Britain has one of the most diverse ranges of electricity generation in Europe, with everything from windfarms off the coast of Scotland to a nuclear power station in Suffolk tasked with keeping the lights on. The increasing reliance on renewable energy sources, as part of the country’s green ambitions, also means there can be rapid shifts in the main source of electricity generation. On windy days, most electricity generation comes from record wind generation across onshore and offshore windfarms. When conditions are cold and still, gas-fired power stations known as peaking plants are called into action.

The electricity system in Great Britain relies on a combination of “baseload” power – from stable generators such as nuclear and biomass plants – and “intermittent” sources, such as wind and solar farms that need the right weather conditions to feed energy into the grid. National Grid also imports energy from overseas, through subsea cables known as interconnectors that link to France, Belgium, Norway and the Netherlands. They allow companies to trade excess power, such as renewable energy created by the sun, wind and water, between different countries. By 2030 it is hoped that 90% of the energy imported by interconnectors will be from zero carbon energy sources, though low-carbon electricity generation stalled in 2019 for the UK.

The technology behind Great Britain’s power generation has evolved significantly over the last century, and at times wind has been the main source of electricity. The first integrated national grid in the world was formed in 1935 linking seven regions of the UK. In the aftermath of industrialisation, coal provided the vast majority of power, before oil began to play an increasingly important part in the 1950s. In 1956, the world’s first commercial nuclear reactor, Calder Hall 1 at Windscale (later Sellafield), was opened by Queen Elizabeth II. Coal use fell significantly in the 1990s while the use of combined cycle gas turbines grew, and in 2016 wind generated more electricity than coal for the first time. Now a combination of gas, wind, nuclear and biomass provide the bulk of Great Britain’s energy, with smaller sources such as solar and hydroelectric power also used. From October 2024, coal will no longer be used to generate electricity, following coal-free power records set in recent years.

Energy generation data is fetched from the Balancing Mechanism Reporting Service public feed, provided by Elexon – which runs the wholesale energy market – and is updated every five minutes, covering periods when wind led the power mix as well.

Elexon’s data does not include embedded energy, which is unmetered and therefore invisible to Great Britain’s National Grid. Embedded energy comprises all solar energy and wind energy generated from non-metered turbines. To account for these figures we use embedded energy estimates from the National Grid electricity system operator, which are published every 30 minutes.

Import figures refer to the net flow of electricity from the interconnectors with Europe and with Northern Ireland. A positive value represents import into the GB transmission system, while a negative value represents an export.

Hydro figures combine renewable run-of-the-river hydropower and pumped storage.

Biomass figures include Elexon’s “other” category, which comprises coal-to-biomass conversions and biomass combined heat and power plants.


Related News

View more

Sign Up for Electricity Forum’s Newsletter

Stay informed with our FREE Newsletter — get the latest news, breakthrough technologies, and expert insights, delivered straight to your inbox.

Electricity Today T&D Magazine Subscribe for FREE

Stay informed with the latest T&D policies and technologies.
  • Timely insights from industry experts
  • Practical solutions T&D engineers
  • Free access to every issue

Live Online & In-person Group Training

Advantages To Instructor-Led Training – Instructor-Led Course, Customized Training, Multiple Locations, Economical, CEU Credits, Course Discounts.

Request For Quotation

Whether you would prefer Live Online or In-Person instruction, our electrical training courses can be tailored to meet your company's specific requirements and delivered to your employees in one location or at various locations.