NC WARN, Climate Times told to put up $98M bond to appeal Duke power plant

By The News & Observer


Electrical Testing & Commissioning of Power Systems

Our customized live online or in‑person group training can be delivered to your staff at your location.

  • Live Online
  • 12 hours Instructor-led
  • Group Training Available
Regular Price:
$599
Coupon Price:
$499
Reserve Your Seat Today
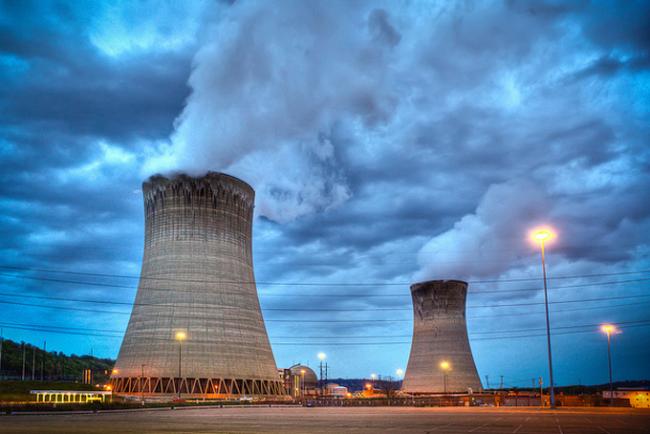
The N.C. Utilities Commission has told two nonprofits that they must put up a $98 million bond for the the right to appeal a power plant construction permit issued to Duke Energy.

The bond is required by a 1965 state law that has not previously been invoked in anyone's memory. The rationale for the bond is to protect electric utility customers from any increased costs that result from delays while a power plant permit is under appeal.

"The statute plainly places on the appealing party the financial risk of what potentially could be extensive additional costs," the Utilities Commissioned explained in its order Friday. "Otherwise, these costs would be added to the cost of the generating facility to be recovered from consumers through higher rates."

The Utilities Commission issued the power plant permit -- called a certificate of public convenience and necessity -- in March, and Duke had planned to begin construction on the $1 billion power project in October. Charlotte-based Duke said the planned power plant in Buncombe County will replace a demolished coal-burning plant and must be operational before Jan. 31, 2020, under deadlines set by the state legislature in the Coal Ash Management Act and the Mountain Energy Act.

NC WARN, based in Durham, and Climate Times, based in Boone, planned to challenge the power plant permit in court. The two groups say that natural gas, largely derived from fracking, results in methane leaks that release more greenhouse gas into the atmosphere than generating electricity from burning coal.

Initially the Utilities Commission had set the bond at $10 million. The nonprofits appealed and the N.C. Court of Appeals rejected the commissioners' amount, and told them to recalculate the bond based on "competent evidence."

The Utilities Commission on Friday set the new bond at $98 million total based on several estimates: $40 million in cancellation costs for three major equipment contracts, $8 million in sunk development costs, and $50 million in increased labor and material costs.

The nonprofits had proposed a bond of $250, while Duke said it would need $240 million to cover potential losses. Duke estimates an appeal could delay construction by up to two years.

Under the state law, NC WARN and Climate Times would have to cover Duke's increased costs only if they lost their appeal. If Duke won the appeal, the amount of increased costs would be determined by the Utilities Commission, and the total could turn out to be less than the amount of the bond. The actual appeal has yet to be filed as the two sides wrangle over the bond amount.

Duke Energy denounced what it described as NC WARN's dilatory tactics. "NC WARN's second appeal of the North Carolina Utilities Commission's order is most unfortunate but certainly to be expected from a group that's extremely good at creating distractions and roadblocks for their own notoriety and monetary gain," Duke said in a statement. "Their actions continue to threaten the energy reliability and economic viability of this state at the expense of its citizens and our customers."

The Commission's order cited "the lack of credibility in NC WARN's underlying position."

NC WARN executive director Jim Warren said the two nonprofits are going to appeal the amount of the bond. The nonprofits have said that putting up millions of dollars would be financially ruinous for them and the bond blocks their access to the court system.

Warren said: "We'll take it back to the court of appeals, and believe there's a good chance they'll agree with our arguments about abuse of process, and that a bond can't be used to shield the regulators from their own pro-Duke bias and order in this unprecedented case."

Related News

Smaller, cheaper, safer: Next-gen nuclear power, explained

MARVEL microreactor debuts at Idaho National Laboratory as a 100 kW, liquid-metal-cooled, zero-emissions generator powering a nuclear microgrid, integrating wind and solar for firm, clean energy in advanced nuclear applications research.


Key Points

A 100 kW, liquid-metal-cooled INL reactor powering a nuclear microgrid and showcasing zero-emissions clean energy.

✅ 100 kW liquid-metal-cooled microreactor at INL

✅ Powers first nuclear microgrid for applications testing

✅ Integrates with wind and solar for firm clean power


Inside the Transient Reactor Test Facility, a towering, windowless gray block surrounded by barbed wire, researchers are about to embark on a mission to solve one of humanity’s greatest problems with a tiny device.

Next year, they will begin construction on the MARVEL reactor. MARVEL stands for Microreactor Applications Research Validation and EvaLuation. It’s a first-of-a-kind nuclear power generator with a mini-reactor design that is cooled with liquid metal and produces 100 kilowatts of energy. By 2024, researchers expect MARVEL to be the zero-emissions engine of the world’s first nuclear microgrid at Idaho National Laboratory (INL).

“Micro” and “tiny,” of course, are relative. MARVEL stands 15 feet tall, weighs 2,000 pounds, and can fit in a semi-truck trailer. But it's minuscule compared to conventional nuclear power plants, which span acres, produces gigawatts of electricity to power whole states, and can take more than a decade to build.

For INL, where scientists have tested dozens of reactors over the decades across an area three-quarters the size of Rhode Island, it’s a radical reimagining of the technology. This advanced reactor design could help overcome the biggest obstacles to nuclear energy: safety, efficiency, scale, cost, and competition. MARVEL is an experiment to see how all these pieces could fit together in the real world.

“It’s an applications test reactor where we’re going to try to figure out how we extract heat and energy from a nuclear reactor and apply it — and combine it with wind, solar, and other energy sources,” said Yasir Arafat, head of the MARVEL program.

The project, however, comes at a time when nuclear power is getting pulled in wildly different directions, from phase-outs to new strategies like the UK’s green industrial revolution that shapes upcoming reactors.

Germany just shut down its last nuclear reactors. The U.S. just started up its first new reactor in 30 years, underscoring a shift. France, the country with the largest share of nuclear energy on its grid, saw its atomic power output decline to its lowest since 1988 last year. Around the world, there are currently 60 nuclear reactors under construction, with 22 in China alone.

But the world is hungrier than ever for energy. Overall electricity demand is growing: Global electricity needs will increase nearly 70 percent by 2050 compared to today’s consumption, according to the Energy Information Administration. At the same time, the constraints are getting tighter. Most countries worldwide, including the U.S., have committed to net-zero goals by the middle of the century, even as demand rises.

To meet this energy demand without worsening climate change, the U.S. Energy Department’s report on advanced nuclear energy released in March said, “the U.S. will need ~550–770 [gigawatts] of additional clean, firm capacity to reach net-zero; nuclear power is one of the few proven options that could deliver this at scale.”

The U.S. government is now renewing its bets on nuclear power to produce steady electricity without emitting greenhouse gases. The Bipartisan Infrastructure Law included $6 billion to keep existing nuclear power plants running. In addition, the Inflation Reduction Act, the U.S. government’s largest investment in countering climate change, includes several provisions to benefit atomic power, including tax credits for zero-emissions energy.

“It’s a game changer,” said John Wagner, director of INL.

The tech sector is jumping in, too, as atomic energy heats up across startups and investors. In 2021, venture capital firms poured $3.4 billion into nuclear energy startups. They’re also pouring money into even more far-out ideas, like nuclear fusion power. Public opinion has also started moving. An April Gallup poll found that 55 percent of Americans favour and 44 percent oppose using atomic energy, the highest levels of support in 10 years.


Related News

View more

U.S. Residents Averaged Fewer Power Outages in 2022

2022 U.S. Power Outage Statistics show lower SAIDI as fewer major events hit, with SAIFI trends, electric reliability, outage duration and frequency shaped by hurricanes, winter storms, vegetation, and utility practices across states.


Key Points

They report SAIDI and SAIFI for 2022, showing outage duration, frequency, and impacts of major weather events.

✅ 2022 SAIDI averaged 5.6 hours; SAIFI averaged 1.4 interruptions.

✅ Fewer major events lowered outage duration versus 2021.

✅ Hurricanes and winter storms drove long outages in several states.


In 2022, U.S. electricity consumers on average experienced about 5.5 hours of power disruptions, a decrease from nearly two hours compared to 2021. This information comes from the latest Annual Electric Power Industry Report. The reduction in yearly power interruptions primarily resulted from fewer significant events in 2022 compared to the previous year, and utility disaster planning continues to support grid resilience as severe weather persists.

Since 2013, excluding major events, the annual average duration of power interruptions has consistently hovered around two hours. Factors contributing to major power disruptions include weather-related incidents, vegetation interference near power lines, and specific utility practices, while pandemic-related grid operations influenced workforce planning more than outage frequency. To assess the reliability of U.S. electric utilities, two key indexes are utilized:

  • The System Average Interruption Duration Index (SAIDI) calculates the total length (in hours) an average customer endures non-brief power interruptions over a year.
  • The System Average Interruption Frequency Index (SAIFI) tracks the number of times interruptions occur.

The influence of major events on electrical reliability is gauged by comparing affected states' SAIDI and SAIFI values against the U.S. average, which was 5.6 hours of outages and 1.4 outages per customer in 2022. The year witnessed 18 weather-related disasters in the U.S., each resulting in over $1 billion in damages, and COVID-19 grid assessments indicated the electricity system was largely safe from pandemic impacts. Noteworthy major events include:

  • Hurricane Ian in September 2022, leaving over 2.6 million Floridian customers without electricity, with restoration in some areas taking weeks rather than days.
  • Hurricane Nicole in November 2022, causing over 300,000 Florida customers to lose power.
  • Winter Storm Elliott in December 2022, affecting over 1.5 million customers in multiple states including Texas where utilities struggled after Hurricane Harvey to restore service, and Florida, and bringing up to four feet of snow in parts of New York.

In 2022, states like Florida, West Virginia, Maine, Vermont, and New Hampshire experienced the most prolonged power interruptions, with New Hampshire averaging 10.3 hours and Florida 19.1 hours, and FPL's Irma storm response illustrates how restoration can take days or weeks in severe cases. Conversely, the District of Columbia, Delaware, Rhode Island, Nebraska, and Iowa had the shortest total interruptions, with the District of Columbia averaging just 34 minutes and Iowa 85 minutes.

The frequency of outages, unlike their duration, is more often linked to non-major events. Across the nation, Alaska recorded the highest number of power disruptions per customer (averaging 3.5), followed by several heavily forested states like Tennessee and Maine. Power outages due to falling tree branches are common, particularly during winter storms that burden tree limbs and power lines, as seen in a North Seattle outage affecting 13,000 customers. The District of Columbia stood out with the shortest and fewest outages per customer.


Related News

View more

New England's solar growth is creating tension over who pays for grid upgrades

New England Solar Interconnection Costs highlight distributed generation strains, transmission charges, distribution upgrades, and DAF fees as National Grid maps hosting capacity, driving queue delays and FERC disputes in Rhode Island and Massachusetts.


Key Points

Rising upfront grid upgrade and DAF charges for distributed solar in RI and MA, including some transmission costs.

✅ Upfront grid upgrades shifted to project developers

✅ DAF and transmission charges increase per MW costs

✅ Queue delays tied to hosting capacity and cluster studies


Solar developers in Rhode Island and Massachusetts say soaring charges to interconnect with the electric grid are threatening the viability of projects. 

As more large-scale solar projects line up for connections, developers are being charged upfront for the full cost of the infrastructure upgrades required, a long-common practice that they say is now becoming untenable amid debates over a new solar customer charge in Nova Scotia. 

“It is a huge issue that reflects an under-invested grid that is not ready for the volume of distributed generation that we’re seeing and that we need, particularly solar,” said Jeremy McDiarmid, vice president for policy and government affairs at the Northeast Clean Energy Council, a nonprofit business organization. 

Connecting solar and wind systems to the grid often requires upgrades to the distribution system to prevent problems, such as voltage fluctuations and reliability risks highlighted by Australian distributors in their networks. Costs can vary considerably from place to place, depending on the amount of distributed generation coming online and the level of capacity planning by regulators, said David Feldman, a senior financial analyst at the National Renewable Energy Laboratory.

“Certainly the Northeast often has more distribution challenges than much of the rest of the country just because it’s more populous and often the infrastructure is older,” he said. “But it’s not unique to the Northeast — in the Midwest, for example, there’s a significant amount of wind projects in the queues and significant delays.”

In Rhode Island and Massachusetts, where strong incentive programs are driving solar development, the level of solar coming online is “exposing the under-investment in the distribution system that is causing these massive costs that National Grid is assigning to particular projects or particular groups of projects,” McDiarmid said. “It is going to be a limiting factor for how much clean energy we can develop and bring online.”

Frank Epps, chief executive officer at Energy Development Partners, has been developing solar projects in Rhode Island since 2010. In that time, he said, interconnection charges on his projects have grown from about $80,000-$120,000 per megawatt to more than $400,000 per megawatt. He attributed the increase to a lack of investment in the distribution network by National Grid over the last decade.

He and other developers say the utility is now adding further to their costs by passing along not just the cost of improving the distribution system — the equivalent of the city street of the grid that brings power directly to customers — but also costs for modifying the transmission system — the interstate highway that moves bulk power over long distances to substations. 

Solar developers who are only requesting to hook into the distribution system, and not applying for transmission service, say they should not be charged for those additional upgrades under state interconnection rules unless they are properly authorized under the federal law that governs the transmission system. 

A Rhode Island solar and wind developer filed a complaint with the Federal Energy Regulatory Commission in February over transmission system improvement charges for its four proposed solar projects. Green Development said National Grid subsidiaries Narragansett Electric and New England Power Company want to charge the company more than $500,000 a year in operating and maintenance expenses assessed as so-called direct assignment facility charges. 

“This amount nearly doubles the interconnection costs associated with the projects,” which total 38.4 megawatts in North Smithfield, the company says in its complaint. “Crucially, these charges are linked to recovering costs associated with providing transmission service — even though no such transmission service is being provided to Green Development.”

But Ted Kresse, a spokesperson for National Grid, said the direct assignment facility, or DAF, construct has been in place for decades and has been applied to any customer affecting the need for transmission upgrades.

“It is the result of the high penetration and continued high volume of distributed generation interconnections that has recently prompted the need for transmission upgrades, and subsequently the pass-through of the associated DAF charges,” he said. 

Several complaints before the Rhode Island Public Utilities Commission object to these DAF and other transmission charges.

One petition for dispute resolution concerns four solar projects totaling 40 MW being developed by Energy Development Partners in a former gravel pit in North Kingstown. Brown University has agreed to purchase the power. 

The developer signed interconnection service agreements with Narragansett Electric in 2019 requiring payment of $21.6 million for costs associated with connecting the projects at a new Wickford Junction substation. Last summer, Narragansett sought to replace those agreements with new ones that reclassified a portion of the costs as transmission-level costs, through New England Power, National Grid’s transmission subsidiary.

That shift would result in additional operational and maintenance charges of $835,000 per year for the estimated 35-year life of the projects, the complaint says.

“This came as a complete shock to us,” Epps said. “We’re not just paying for the maintenance of a new substation. We are paying a share of the total cost that the system owner has to own and operate the transmission system. So all of the sudden, it makes it even tougher for distributed energy resources to be viable.”

In its response to the petition, National Grid argues that the charges are justified because the solar projects will require transmission-level upgrades at the new substation. The company argues that the developer should be responsible for the costs rather than ratepayers, “who are already supporting renewable energy development through their electric rates.”

Seth Handy, one of the lawyers representing Green Development in the FERC complaint, argues that putting transmission system costs on distribution assets is unfair because the distributed resources are “actually reducing the need to move electricity long distances. We’ve been fighting these fights a long time over the underestimating of the value of distributed energy in reducing system costs.”

Handy is also representing the Episcopal Diocese of Rhode Island before the state Supreme Court in its appeal of an April 2020 public utilities commission order upholding similar charges for a proposed 2.2-megawatt solar project at the diocese’s conference center and camp in Glocester. 

Todd Bianco, principal policy associate at the utilities commission, said neither he nor the chairperson can comment on the pending dockets contesting these charges. But he noted that some of these issues are under discussion in another docket examining National Grid’s standards for connecting distributed generation. Among the proposals being considered is the appointment of an independent ombudsperson to resolve interconnection disputes. 

Separately, legislation pending before the Rhode Island General Assembly would remove responsibility for administering the interconnection of renewable energy from utilities, and put it under the authority of the Rhode Island Infrastructure Bank, a financing agency.

Handy, who recently testified in support of the bill, said he believes National Grid has too many conflicting interests to administer interconnecting charges in a timely, transparent and fair fashion, and pointed to utility moves such as changes to solar compensation in other states as examples. In particular, he noted the company’s interests in expanding natural gas infrastructure. 

“There are all kinds of economic interests that they have that conflict with our state policy to provide lower-cost renewable energy and more secure energy solutions,” Handy said.

In testimony submitted to the House Committee on Corporations opposing the legislation, National Grid said such powers are well beyond the purpose and scope of the infrastructure bank. And it cited figures showing Rhode Island is third in the country for the most installed solar per square mile (behind New Jersey and Massachusetts).

Nadav Enbar, program manager at the Electric Power Research Institute, a nonprofit research organization for the utility industry, said interconnection delays and higher costs are becoming more common due to “the incredible uptake” in distributed renewable energy, particularly solar.

That’s impacting hosting capacity, the room available to connect all resources to a circuit without causing adverse harm to reliability and safety. 

“As hosting capacity is being reduced, it’s causing an increasing number of situations where utilities need to study their systems to guarantee interconnection without compromising their systems,” he said. “And that is the reason why you’re starting to see some delays, and it has translated into some greater costs because of the need for upgrades to infrastructure.”

The cost depends on the age or absence of infrastructure, projected load growth, the number of renewable energy projects in the queue, and other factors, he said. As utilities come under increasing pressure to meet state renewable goals, and as some states pilot incentives like a distributed energy rebate in Illinois to drive utility innovation, some (including National Grid) are beginning to provide hosting capacity maps that provide detailed information to developers and policymakers about the amount of distributed energy that can be accommodated at various locations on the grid, he said. 

In addition, the coming availability of high-tech “smart inverters” should help ease some of these problems because they provide the grid with more flexibility when it comes to connecting and communicating with distributed energy resources, Enbar said. 

In Massachusetts, the Department of Public Utilities has opened a docket to explore ways to better plan for and share the cost of upgrading distribution infrastructure to accommodate solar and other renewable energy sources as part of a grid overhaul for renewables nationwide. National Grid has been conducting “cluster studies” there that attempt to analyze the transmission impacts of a group of solar projects and the corresponding interconnection cost to each developer.

Kresse, of National Grid, said the company favors cost-sharing methodologies under consideration that would “provide a pathway to spread cost over the total enabled capacity from the upgrade, as opposed to spreading the cost over only those customers in the queue today.” 

Solar developers want regulators to take an even broader approach that factors in how the deployment of renewables and the resulting infrastructure upgrades benefit not just the interconnecting generator, but all customers. 

“Right now, if your project is the one that causes a multimillion-dollar upgrade, you are assigned that cost even though that upgrade is going to benefit a lot of other projects, as well as make the grid stronger,” said McDiarmid, of the clean energy council. “What we’re asking for is a way of allocating those costs among a variety of developers, as well as to the grid itself, meaning ratepayers. There’s a societal benefit to increasing the modernization of the grid, and improving the resilience of the grid.”

In the meantime, BlueHub Capital, a Boston-based solar developer focused on serving affordable housing developments, recently learned from National Grid that, as a part of one of the area studies, it will be required to pay $5.8 million in transmission and distribution upgrades to interconnect a 2-megawatt solar-plus-storage project that leverages cheaper batteries to enhance resilience, approved for a brownfield site in Gardner, Massachusetts. 

According to testimony submitted to the department, the sum is supposed to be paid within the next year, even though the project will have to wait to be interconnected until April 2027, when a new transmission line is completed. In addition, BlueHub will be responsible for DAF charges totaling $3.4 million over the 20-year life of the project. 

“We’re being asked to pay a fortune to provide solar that the state wants,” said DeWitt Jones, BlueHub’s president. “It’s so expensive that the upgrades are driving everyone out of the interconnection queue. The costs stay the same, but they fall on fewer projects. We need a process of grid design and modernization to guide this.”


Related News

View more

Iran supplying 40% of Iraq’s need for electricity

Iran Electricity Exports to Iraq address power shortages and blackouts, supplying 1,200-1,500 MW and gas for 2,500 MW, amid sanctions, aging grid losses, rising peak demand, and TAVANIR plans to expand cross-border energy capacity.


Key Points

Energy flows from Iran supply Iraq with 1,200-1,500 MW plus gas yielding 2,500 MW, easing shortages and blackouts.

✅ 1,200-1,500 MW direct power; gas adds 2,500 MW generation

✅ Iraq exempt on Iranian gas, but faces US pressure

✅ Aging grid loses 25%; $30B upgrades needed


“Iran exports 1,200 megawatts to 1,500 megawatts of electricity to Iraq per day, reflecting broader regional power trade dynamics, as Iraq is dealing with severe power shortages and frequent blackouts,” Hamid Hosseini said.

As he added, Iran also exports 37 million to 38 million cubic meters of gas to the country, much of it used in combined-cycle power plants to save energy and boost generation.

On September 11, Iraq’s electricity minister, Luay al Khateeb, said the country needs Iranian gas to generate electricity for the next three or four years, as energy cooperation discussions continue between Baghdad and Tehran.

Iraq was exempted from sanctions concerning Iranian gas imports; however, the U.S. has been pressing all countries to stop trading with Tehran.

Iraq's population has been protesting to authorities over power cuts. Iran exports 1,200 megawatts of direct power supplies and its gas is converted into 2,500 MW of electricity. According to al Khateeb, the current capacity is 18,000 MW, with peak demand of 25,000 MW possible during the hot summer months when consumption surges, a figure that rises every year.

Any upgrades would need investment of at least $30 billion, with grid rehabilitation efforts underway to modernize infrastructure, as the grid is 50 years old and loses 25 percent of its capacity due to Isis attacks.

In late July, Managing Director of Gharb (West) Regional Electricity Company Ali Asadi said Iran has high capacity and potential to export electricity up to twofold of the current capacity to neighboring Iraq, as it eyes transmitting electricity to Europe to serve as a regional hub as well.

He pointed to the new strategy of Iran Power Generation, Transmission & Distribution Management Company (TAVANIR) for increasing electricity export to neighboring Iraq and reiterated, “the country enjoys high potential to export 1,200 megawatts electricity to neighboring Iraq,” while Iraq is also exploring nuclear power plants to tackle electricity shortages.


Related News

View more

Renewable power surpasses fossil fuels for first time in Europe

EU Renewable Power Overtakes Fossil Fuels, reflecting a greener energy mix as wind, solar, and hydro expand, cutting CO2 emissions and curbing coal while negative prices rise amid pandemic-driven demand drops.


Key Points

A milestone as renewables surpass fossil power in the EU, driven by wind, solar, hydro growth and pandemic demand.

✅ 40% renewables vs 34% fossil in H1 across 27 EU states

✅ Wind, solar, hydro rose; coal generation fell 32% year-on-year

✅ Lower demand, carbon prices, grid priority boosted clean output


Renewable power for the first time contributed a bigger share in the European generation mix than fossil fuels, as described in Europe's green surge as the fallout from the pandemic cut energy demand.

About 40 percent of the electricity in the first half in the 27 EU countries came from renewable sources, exceeding the global renewables share reported elsewhere, compared with 34 percent from plants burning fossil fuels, according to environmental group Ember in London. As a result, carbon dioxide emissions from the power sector fell 23 percent.

The rise is significant and encouraging for law makers as Europe prepares to spend billions of euros to recover from the virus, with wind power investments underscoring the momentum, and set the bloc on track to neutralize its carbon footprint by the middle of the century.

“This marks a symbolic moment ​in the transition of Europe’s electricity sector,” said Dave Jones, an electricity analyst at Ember. “For countries like Poland and Czech Republic grappling with how to get off coal, there is now a clear way out.”

While power demand slumped, output from wind and solar farms increased, reflecting global wind and solar gains, because more plants came online in breezy and sunny weather. At the same time, wet conditions boosted hydro power in Iberia and the Nordic markets.

Those conditions helped renewables become a rare bright spot throughout the economic tumult this year. In many areas, renewable sources of electricity have priority to the grid, meaning they could keep growing even as demand shrank and other power plants were turned off.

Electricity demand in the EU fell 7 percent overall. Fossil-fuel power generation plunged 18 percent in the first half compared with a year earlier. Renewable generation grew by 11 percent, according to Ember.

Coal was by far the biggest loser in 2020. It’s one of the most-polluting sources of power and its share is slumping in Europe as the price of carbon increases, with renewables surpassing coal in the US illustrating the broader shift, and governments move to cut emissions. Power from coal fell 32 percent across the EU.

Despite the economics, the decision to shut off coal for good will come down to political agreements between producers and governments, while reducing reliance on Russian energy reshapes policy debates.

One consequence of the jump in renewables is that negative prices have increased, as solar is reshaping prices in Northern Europe in similar ways. On particularly windy or sunny days when there isn’t much demand, the grid can be flooded with power. That’s leading wind farms to be shut off and customers to be paid to consume electricity.


Related News

View more

Learn how fees and usage impacts your electricity bill in new online CER tool

CER Interactive Electricity Bill Tool compares provincial electricity prices, fees, taxes, and usage. Explore household appliance costs, hydroelectric generation, and consumption trends across Canada with interactive calculators and a province-by-province breakdown.


Key Points

An online CER report with calculators comparing electricity prices, fees, and usage to explain household energy costs.

✅ Province-by-province bill, price, and consumption comparison

✅ Calculator for appliance and electronics energy costs

✅ Explains fees, taxes, regulation, and generation sources


Canadians have a new way to assess their electricity bill in a new, interactive online report released by the Canada Energy Regulator (CER).

The report titled What is in a residential electricity bill? features a province-to-province comparison of electricity bills, generation and consumption. It also explains electricity prices across the country, including how Calgary electricity prices have changed, allowing people to understand why costs vary depending on location, fees, regulation and taxes.  

Learn how fees and usage impacts your electricity bill in new online CER tool
Interactive tools allow people to calculate the cost of household appliances and electronic use for each province and territory, and to understand how Ontario rate increases may affect monthly bills. For example, an individual can use the tools to find out that leaving a TV on for 24-hours in Quebec costs $5.25 per month, while that same TV on for a whole day would cost $12.29 per month in Saskatchewan, $20.49 per month in the Northwest Territories, and $15.30 per month in Nova Scotia.

How Canadians use energy varies as much as how provinces and territories produce it, especially in regions like Nunavut where unique conditions influence costs. Millions of Canadians rely on electricity to power their household appliances, charge their electronics, and heat their homes. Provinces with abundant hydro-electric resources like Quebec, B.C., Manitoba, and Newfoundland and Labrador use electricity for home heating and tend to consume the most electricity.

By gathering data from various sources, this report is the first Canadian publication that features interactive tools to allow for a province-by-province comparison of electricity bills while highlighting different elements within an electricity bill, a helpful context as Canada faces a critical supply crunch in the years ahead.

The CER monitors energy markets and assesses Canadian energy requirements and trends, including clean electricity regulations developments that shape pricing. This report is part of a portfolio of publications on energy supply, demand and infrastructure that the CER publishes regularly as part of its ongoing market monitoring.

"No matter where you go in the country, Canadians want to know how much they pay for power and why, especially amid price spikes in Alberta this year," says lead author Colette Craig. "This innovative, interactive report really explains electricity bills to help everyone understand electricity pricing and consumption across Canada."

Quick Facts

  • Quebec ranks first in electricity consumption per capita at 21.0 MW.h, followed by Saskatchewan at 20.0 MW.h, Newfoundland and Labrador at 19.3 MW.h.
  • About 95% of Quebec's electricity is produced from hydroelectricity.
  • Provinces that use electricity for home heating tend to consume the most electricity.
  • Canada's largest consuming sector for electricity was industrial at 238 TW.h. The residential and commercial sectors consumed 168 TW.h and 126 TW.h, respectively.
  • In 2018, Canada produced 647.7 terawatt hours (TW.h) of electricity. More than half of the electricity in Canada (61%) is generated from hydro sources. The remainder is produced from a variety of sources, such as fossil fuels (natural gas and petroleum), nuclear, wind, coal, biomass, solar.
  • Canada is a net exporter of electricity. In 2019, net exports to the U.S. electricity market totaled 47.0 TW.h.
  • The total value of Canada's electricity exports was $2.5 billion Canadian dollars and the value of imports was $0.6 billion Canadian dollars, resulting in 2019 net exports of $1.9 billion.
  • All regions in Canada are reflected in this report but it does not include data that reflects the COVID-19 lockdown and its effects on residential electricity bills.


Related News

View more

Sign Up for Electricity Forum’s Newsletter

Stay informed with our FREE Newsletter — get the latest news, breakthrough technologies, and expert insights, delivered straight to your inbox.

Electricity Today T&D Magazine Subscribe for FREE

Stay informed with the latest T&D policies and technologies.
  • Timely insights from industry experts
  • Practical solutions T&D engineers
  • Free access to every issue

Download the 2025 Electrical Training Catalog

Explore 50+ live, expert-led electrical training courses –

  • Interactive
  • Flexible
  • CEU-cerified