Greenhouse gas emissions rise among G8 nations

By Reuters


Arc Flash Training CSA Z462 - Electrical Safety Essentials

Our customized live online or in‑person group training can be delivered to your staff at your location.

  • Live Online
  • 6 hours Instructor-led
  • Group Training Available
Regular Price:
$249
Coupon Price:
$199
Reserve Your Seat Today
Greenhouse gas emissions by leading industrialized nations have accelerated since 2000 and several countries are performing worse than the United States which opposes a U.N. pact for curbing global warming, U.N. data shows.

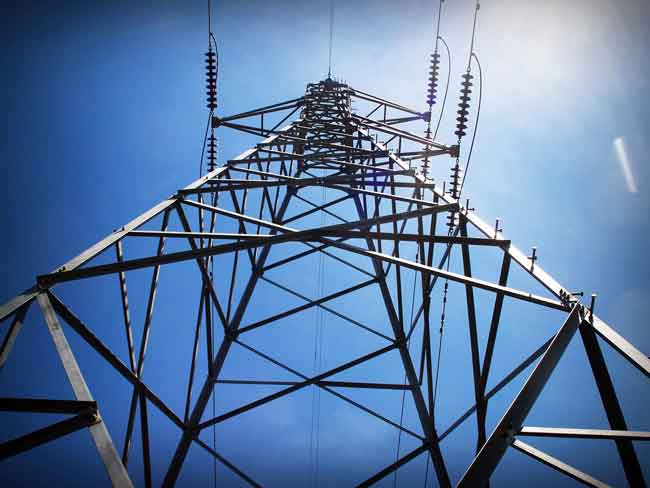
Leaders of the Group of Eight rich nations are meeting in Germany with President George W. Bush resisting pressure by German Chancellor Angela Merkel to agree to cap emissions, mainly from burning fossil fuels.

But Bush is not alone in presiding over rising emissions.

"Growth rates... of emissions in the U.S. are slowing," said Michael Raupach, of the Earth Observation Centre in Canberra, Australia, of overall greenhouse gas trends. "European emissions are creeping up in the post-2000 years."

National data submitted to the U.N.'s Climate Change Secretariat show that overall emissions by G8 nations rose 2.0 percent from 2000 to 14.3 billion tonnes in 2005 and were up 0.7 percent since 1990, the base year for the U.N.'s Kyoto Protocol.

Among G8 nations, Russia, Italy and Canada have all had bigger rises than the 1.6 percent U.S. gain since 2000, when Bush won election to the White House. The revival of the Russian economy after the collapse of the Soviet Union is a main spur.

Only Britain, Germany and France have cut back since 2000.

Since 1990, however, the United States has had a 16.3 percent rise, second worst behind Canada. All G8 nations back Kyoto except the United States, the biggest world emitter.

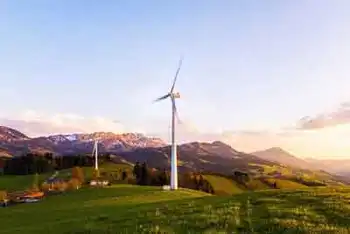
And Kyoto nations expect falls in emissions in coming years when investments, for instance in energy efficiency or wind or hydro power, will take effect. G8 comparisons for 2005 are possible after Canada and Japan provided data.

"The main driver for emissions has not been the Kyoto Protocol but how economies have been developing," said Keywan Riahi, a senior researcher at the International Institute for Applied Systems Analysis in Austria.

Economic growth and rising populations tend to spur emissions from factories, power plants and cars but energy efficiency, partly inspired by Kyoto, and a shift away from heavy industry towards services are among brakes for G8 nations.

Among big shifts, Russian emissions are up 7.3 percent since 2000, mainly driven by an economic rebound after the collapse of the Soviet Union and its smokestack industries. But Russia is still 28.7 percent below 1990 levels.

Bush said in 2001 that Kyoto would threaten U.S. jobs and wrongly excluded developing nations from first targets of a 5 percent cut by 2008-12. He prefers voluntary agreements and investments in new technologies, such as hydrogen or clean coal.

"My personal view is that the importance of Kyoto was not for the actual emissions reductions it may achieve - which are tiny compared with what is needed - but rather that Kyoto was a first attempt to build a global consensus and commitment," Raupach said.

"In that, it has been less than fully successful," he said.

Merkel wants Bush to agree to Kyoto-style caps, with extra urgency after U.N. climate reports this year have said world emissions will need to be cut to help avert more hunger, water shortages, heatwaves and rising seas.

The White House said that preliminary data showed that U.S. emissions of carbon dioxide, the main greenhouse gas, fell by 1.3 percent in 2006. "We are effectively confronting the important challenge of global climate change," Bush said.

Raupach said, however, that a warm winter contributed to cut U.S. heating demand and a less than scorching 2005 summer had also curbed use of air conditioning.

Related News

Most Energy Will Come From Fossil Fuels, Even In 2040

2040 Energy Outlook projects a shifting energy mix as renewables scale, EV adoption accelerates, and IEA forecasts plateauing oil demand alongside rising natural gas, highlighting policy, efficiency, and decarbonization trends that shape global consumption.


Key Points

A data-driven view of future energy mix, covering renewables, fossil fuels, EVs, oil demand, and policy impacts.

✅ Renewables reach 16-30% by 2040, higher with strong policy support.

✅ Fossil fuels remain dominant, with oil flat and natural gas rising.

✅ EV share surges, cutting oil use; efficiency curbs demand growth.


Which is more plausible: flying taxis, wind turbine arrays stretching miles into the ocean, and a solar roof on every house--or a scorched-earth, flooded post-Apocalyptic world? 

We have no way of peeking into the future, but we can certainly imagine it. There is plenty of information about where the world is headed and regardless of how reliable this information is—or isn’t—we never stop wondering. Will the energy world of 20 years from now be better or worse than the world we live in now? 

The answer may very well lie in the observable trends.


A Growing Population

The global population is growing, and it will continue to grow in the next two decades. This will drive a steady growth in energy demand, at about 1 percent per year, according to the International Energy Agency.

This modest rate of growth is good news for all who are concerned about the future of the planet. Parts of the world are trying to reduce their energy consumption, and this should have a positive effect on the carbon footprint of humanity. The energy thirst of most parts of the world will continue growing, however, hence the overall growth.

The world’s population is currently growing at a rate of a little over 1 percent annually. This rate of growth has been slowing since its peak in the 1960s and forecasts suggest that it will continue to slow. Growth in energy demand, on the other hand, may at some point stop moving in tune with population growth trends as affluence in some parts of the world grows. The richer people get, the more energy they need. So, to the big question: where will this energy come from?


The Rise of Renewables

For all the headline space they have been claiming, it may come as a disappointing surprise to many that renewable energy, excluding hydropower, to date accounts for just 14 percent of the global primary energy mix. 

Certainly, adoption of solar and wind energy has been growing in leaps and bounds, with their global share doubling in five years in many markets, but unless governments around the world commit a lot more money and effort to renewable energy, by 2040, solar and wind’s share in the energy mix will still only rise to about 16 to 17 percent. That’s according to the only comprehensive report on the future of energy that collates data from all the leading energy authorities in the world, by non-profit Resources for the Future.

The growth in renewables adoption, however, would be a lot more impressive if governments do make serious commitments. Under that scenario, the share of renewables will double to over 30 percent by 2040, echoing milestones like over 30% of global electricity reached recently: that’s the median rate of all authoritative forecasts. Amongst them, the adoption rates of renewables vary between 15 percent and 61 percent by 2040.

Even the most bullish of the forecasts on renewables is still far below the 100-percent renewable future many would like to fantasize about, although BNEF’s 50% by 2050 outlook points to what could be possible in the power sector. 

But in 2040, most of the world’s energy will still come from fossil fuels.


EV Energy

Here, forecasters are more optimistic. Again, there is a wide variation between forecasts, but in each and every one of them the share of electric vehicles on the world’s roads in 2040 is a lot higher than the meagre 1 percent of the global car fleet EVs constitute today.
Related: Gas Prices Languish As Storage Falls To Near-Record Lows

Government policy will be the key, as U.S. progress toward 30% wind and solar shows how policy steers the power mix that EVs ultimately depend on. Bans of internal combustion engines will go a long way toward boosting EV adoption, which is why some forecasters expect electric cars to come to account for more than 50 percent of cars on the road in 2040. Others, however, are more guarded in their forecasts, seeing their share of the global fleet at between 16 percent and a little over 40 percent.

Many pin their hopes for a less emission-intensive future on electric cars. Indeed, as the number of EVs rises, they displace ICE vehicles and, respectively, the emission-causing oil that fuels for ICE cars are made from.  It should be a no brainer that the more EVs we drive, the less emissions we produce. Unfortunately, this is not necessarily the case: China is the world’s biggest EV market, and its solar PV expansion has been rapid, it has the most EVs—including passenger cars and buses—but it is also one of the biggest emitters.

Still, by 2040, if the more optimistic forecasts come true, the world will be consuming less oil than it is consuming now: anywhere from 1.2 million bpd to 20 million bpd less, the latter case envisaging an all-electric global fleet in 2040. 


This Ain’t Your Daddy’s Oil

No, it ain’t. It’s your grandchildren’s oil, for good or for bad. The vision of an oil-free world where renewable power is both abundant and cheap enough to replace all the ways in which crude oil and natural gas are used will in 2040 still be just that--a vision, with practical U.S. grid constraints underscoring the challenges. Even the most optimistic energy scenarios for two decades from now see them as the dominant source of energy, with forecasts ranging between 60 percent and 79 percent. While these extremes are both below the over-80 percent share fossil fuels have in the world’s energy mix, they are well above 50 percent, and in the U.S. renewables are projected to reach about one-fourth of electricity soon, even as fossil fuels remain foundational.

Still, there is good news. Fuel efficiency alone will reduce oil demand significantly by 2040. In fact, according to the IEA, demand will plateau at a little over 100 million bpd by the mid-2030s. Combined with the influx of EVs many expect, the world of 20 years from now may indeed be consuming a lot less oil than the world of today. It will, however, likely consume a lot more natural gas. There is simply no way around fossil fuels, not yet. Unless a miracle of politics happens (complete with a ripple effect that will cost millions of people their jobs) in 2040 we will be as dependent on oil and gas as we are but we will hopefully breathe cleaner air.

By Irina Slav for Oilprice.com


Related News

View more

Which of the cleaner states imports dirty electricity?

Hourly Electricity Emissions Tracking maps grid balancing areas, embodied emissions, and imports/exports, revealing carbon intensity shifts across PJM, ERCOT, and California ISO, and clarifying renewable energy versus coal impacts on health and climate.


Key Points

An hourly method tracing generation, flows, and embodied emissions to quantify carbon intensity across US balancing areas.

✅ Hourly traces of imports/exports and generation mix

✅ Consumption-based carbon intensity by balancing area

✅ Policy insights for renewables, coal, health costs


In the United States, electricity generation accounts for nearly 30% of our carbon emissions. Some states have responded to that by setting aggressive renewable energy standards; others are hoping to see coal propped up even as its economics get worse. Complicating matters further is the fact that many regional grids are integrated, and as America goes electric the stakes grow, meaning power generated in one location may be exported and used in a different state entirely.

Tracking these electricity exports is critical for understanding how to lower our national carbon emissions. In addition, power from a dirty source like coal has health and environment impacts where it's produced, and the costs of these aren't always paid by the parties using the electricity. Unfortunately, getting reliable figures on how electricity is produced and where it's used is challenging, even for consumers trying to find where their electricity comes from in the first place, leaving some of the best estimates with a time resolution of only a month.

Now, three Stanford researchers—Jacques A. de Chalendar, John Taggart, and Sally M. Benson—have greatly improved on that standard, and they have managed to track power generation and use on an hourly basis. The researchers found that, of the 66 grid balancing areas within the United States, only three have carbon emissions equivalent to our national average, and they have found that imports and exports of electricity have both seasonal and daily changes. de Chalendar et al. discovered that the net results can be substantial, with imported electricity increasing California's emissions/power by 20%.

Hour by hour
To figure out the US energy trading landscape, the researchers obtained 2016 data for grid features called balancing areas. The continental US has 66 of these, providing much better spatial resolution on the data than the larger grid subdivisions. This doesn't cover everything—several balancing areas in Canada and Mexico are tied in to the US grid—and some of these balancing areas are much larger than others. The PJM grid, serving Pennsylvania, New Jersey, and Maryland, for example, is more than twice as large as Texas' ERCOT, in a state that produces and consumes the most electricity in the US.

Despite these limitations, it's possible to get hourly figures on how much electricity was generated, what was used to produce it, and whether it was used locally or exported to another balancing area. Information on the generating sources allowed the researchers to attach an emissions figure to each unit of electricity produced. Coal, for example, produces double the emissions of natural gas, which in turn produces more than an order of magnitude more carbon dioxide than the manufacturing of solar, wind, or hydro facilities. These figures were turned into what the authors call "embodied emissions" that can be traced to where they're eventually used.

Similar figures were also generated for sulfur dioxide and nitrogen oxides. Released by the burning of fossil fuels, these can both influence the global climate and produce local health problems.

Huge variation
The results were striking. "The consumption-based carbon intensity of electricity varies by almost an order of magnitude across the different regions in the US electricity system," the authors conclude. The low is the Bonneville Power grid region, which is largely supplied by hydropower; it has typical emissions below 100kg of carbon dioxide per megawatt-hour. The highest emissions come in the Ohio Valley Electric region, where emissions clear 900kg/MW-hr. Only three regional grids match the overall grid emissions intensity, although that includes the very large PJM (where capacity auction payouts recently fell), ERCOT, and Southern Co balancing areas.

Most of the low-emissions power that's exported comes from the Pacific Northwest's abundant hydropower, while the Rocky Mountains area exports electricity with the highest associated emissions. That leads to some striking asymmetries. Local generation in the hydro-rich Idaho Power Company has embodied emissions of only 71kg/MW-hr, while its imports, coming primarily from Rocky Mountain states, have a carbon content of 625kg/MW-hr.

The reliance on hydropower also makes the asymmetry seasonal. Local generation is highest in the spring as snow melts, but imports become a larger source outside this time of year. As solar and wind can also have pronounced seasonal shifts, similar changes will likely be seen as these become larger contributors to many of these regional grids. Similar things occur daily, as both demand and solar production (and, to a lesser extent, wind) have distinct daily profiles.

The Golden State
California's CISO provides another instructive case. Imports represent less than 30% of its total electric use in 2016, yet California electricity imports provided 40% of its embodied emissions. Some of these, however, come internally from California, provided by the Los Angeles Department of Water and Power. The state itself, however, has only had limited tracking of imported emissions, lumping many of its sources as "other," and has been exporting its energy policies to Western states in ways that shape regional markets.

Overall, the 2016 inventory provides a narrow picture of the US grid, as plenty of trends are rapidly changing our country's emissions profile, including the rise of renewables and the widespread adoption of efficiency measures and other utility trends in 2017 that continue to evolve. The method developed here can, however, allow for annual updates, providing us with a much better picture of trends. That could be quite valuable to track things like how the rapid rise in solar power is altering the daily production of clean power.

More significantly, it provides a basis for more informed policymaking. States that wish to promote low-emissions power can use the information here to either alter the source of their imports or to encourage the sites where they're produced to adopt more renewable power. And those states that are exporting electricity produced primarily through fossil fuels could ensure that the locations where the power is used pay a price that includes the health costs of its production.


Related News

View more

Entergy Creates COVID-19 Emergency Relief Fund to Help Customers in Need

Entergy COVID-19 Emergency Relief Fund provides financial assistance to ALICE households, low-income seniors, and disabled customers via United Way grants for rent, mortgage, utilities, food, and bill payment support during COVID-19, alongside a disconnect moratorium.


Key Points

A shareholder-funded program offering essential grants and bill support to Entergy customers affected by COVID-19.

✅ Shareholders commit $700,000; grants distributed via United Way partners.

✅ Focus on ALICE families, low-income seniors, and disabled customers.

✅ Disconnects suspended; bill tools and LIHEAP advocacy underway.


In an effort to help working families experiencing financial hardships as a result of the coronavirus pandemic, the Entergy Charitable Foundation has established the COVID-19 Emergency Relief Fund, recognizing the need for electricity across communities.

"The health and safety of our customers, employees and communities is Entergy's top priority," said Leo Denault, chairman and CEO of Entergy Corporation. "For more than 100 years, Entergy has never wavered in our commitment to supporting our customers and the communities we serve. This pandemic is no different. During this challenging time, we are helping lessen the impact of this crisis on the most vulnerable in our communities. I strongly encourage our business partners to join us in this effort."

As devastating and disruptive as this crisis is for everyone, we know from past experience that those most heavily impacted are ALICE households (low-wage working families) and low-income elderly and disabled customers, who often face energy insecurity during such events - roughly 40%-50% of Entergy's customer base.

"We know from experience that working families and low-income elderly and disabled customers are hardest hit during times of crisis," said Patty Riddlebarger, vice president of Entergy's corporate social responsibility. "We are working quickly to make funds available to community partners that serve vulnerable households to lessen the economic impact of the COVID-19 crisis and ensure that families have the resources they need to get by during this time of uncertainty."

To support our most vulnerable customers, Entergy shareholders are committing $700,000 to the COVID-19 Emergency Relief Fund to help qualifying customers with basic needs such as food and nutrition, rent and mortgage assistance, and other critical needs, alongside measures like Texas utilities waiving fees that ease household costs, until financial situations become more stable. Grants from the fund will be provided to United Way organizations and other nonprofit partners across Entergy's service area that are providing services to impacted households.

Company shareholders will also match employee contributions to the COVID-19 relief efforts of local United Way organizations up to $100,000 to maximize impact.

In addition to establishing the COVID-19 Emergency Relief Fund, Entergy is taking additional steps to support and protect our customers during this crisis, similar to PG&E's pandemic response measures, including:

With support from our regulators, we are temporarily suspending customer disconnects, as seen in New Jersey and New York policies, as we continue to monitor the situation.

We are working with our network of community advocates, as the industry coordination with federal partners continues, to request a funding increase of the Low Income Home Energy Assistance Program to help alleviate financial hardships caused by COVID-19 on vulnerable households.

We are developing bill payment solutions and tools to help customers pay their accumulated balances once the disconnect moratorium is lifted.

Already in place to support vulnerable customers is Entergy's The Power to Care program, which provides emergency bill payment assistance to seniors and disabled individuals. To mark the 20th anniversary of Entergy's low-income customer initiative, the limit of shareholders' dollar for dollar match of customer donations was increased from $500,000 to $1 million per year. Shareholders continue to match employee donations dollar for dollar with no limit.


Related News

View more

Westinghouse AP1000 Nuclear Plant Breaks A First Refueling Outage Record

AP1000 Refueling Outage Record showcases Westinghouse nuclear power excellence as Sanmen Unit 2 completes its first reactor refueling in 28.14 days, highlighting safety, reliability, outage optimization, and economic efficiency in China.


Key Points

It is the 28.14-day initial refueling at Sanmen Unit 2, a global benchmark achieved with Westinghouse AP1000 technology.

✅ 28.14-day first refueling at Sanmen Unit 2 sets global benchmark

✅ AP1000 design simplifies systems, improves safety and reliability

✅ Outage optimization by Westinghouse and CNNC accelerates schedules


Westinghouse Electric Company China operations today announced that Sanmen Unit 2, one of the world's first AP1000® nuclear power plants, has set a new refueling outage record in the global nuclear power industry, completing its initial outage in 28.14 days.

"Our innovative AP1000 technology allows for simplified systems and significantly reduces the amount of equipment, while improving the safety, reliability and economic efficiency of this nuclear power plant, reflecting global nuclear milestones reached recently," said Gavin Liu, president of the Westinghouse Asia Operating Plant Services Business. "We are delighted to see the first refueling outage for Sanmen Unit 2 was completed in less than 30 days. This is a great achievement for Sanmen Nuclear Power Company and further demonstrates the outstanding performance of AP1000 design."

All four units of the AP1000 nuclear power plants in China have completed their first refueling outages in the past 18 months, aligning with China's nuclear energy development momentum across the sector.  The duration of each subsequent outage has fallen significantly - from 46.66 days on the first outage to 28.14 days on Sanmen Unit 2.

"During the first AP1000 refueling outage at the Sanmen site in December 2019, a Westinghouse team of experts worked side-by-side with the Sanmen outage team to partner on outage optimization, and immediately set a new standard for a first-of-a-kind outage, while major refurbishments like the Bruce refurbishment moved forward elsewhere," said Miao Yamin, chairman of CNNC Sanmen Nuclear Power Company Limited. "Lessons learned were openly exchanged between our teams on each subsequent outage, which has built to this impressive achievement."

Westinghouse provided urgent technical support on critical issues during the outage, as international programs such as Barakah Unit 1 achieved key milestones, to help ensure that work was carried out on schedule with no impact to critical path.

In addition to the four AP1000 units in China, two units are under construction at the Vogtle expansion near Waynesboro, Georgia, USA.

Separately, in the United States, a new reactor startup underscored renewed momentum in nuclear generation this year.


Related News

View more

COVID-19 closures: It's as if Ottawa has fallen off the electricity grid

Ontario Electricity Demand Drop During COVID-19 reflects a 1,000-2,000 MW decline as IESO balances the grid, shifts peak demand later, throttles generators and baseload nuclear, and manages exports amid changing load curves.


Key Points

An about 10% reduction in Ontario's load, shifting peaks and requiring IESO grid balancing measures.

✅ Demand down 1,000-2,000 MW; roughly 10% below normal.

✅ Peak shifts later in morning as home use rises.

✅ IESO throttles generators; baseload nuclear stays online.


It’s as if the COVID-19 epidemic had tripped a circuit breaker, shutting off all power to a city the size of Ottawa.

Virus-induced restrictions that have shut down large swaths of normal commercial life across Canada has led to a noticeable drop in demand for power in Ontario and reflect a global demand dip according to reports, insiders said on Friday.

Terry Young, vice-president with the Independent Electricity System Operator, said planning was underway for further declines in usage and for whether Ontario will embrace more clean power in the long term, given the delicate balance that needs to be maintained between supply and demand.

“We’re now seeing demand that is running about 1,000 to 2,000 megawatts less than we would normally see,” Young said. “You’re essentially seeing a city the size of Ottawa drop off demand during the day.”

At the high end, a 2,000 megawatt reduction would be close to the equivalent peak demand of Ottawa and London, Ont., combined.

The decline, in the order of 10 per cent from the 17,000 to 18,000 megawatts of usage that might normally be expected and similar to the UK’s 10% drop reported during lockdowns, began last week, Young said. The downward trend became more noticeable as governments and health authorities ordered non-essential businesses to close and people to stay home. However, residential and hospital usage has climbed.

Experts say frequent hand-washing and staying away from others is the most effective way to curb the spread of the highly contagious coronavirus, which poses a special risk to older people and those with underlying health conditions. As a result, factories and other big users have reduced production or closed entirely.

Because electricity cannot be stored, generators need to throttle back their output as domestic demand shrinks and exports to places such as the United States, including New York City, which is also being hit hard by the coronavirus, fall.

“We’re watching this carefully,” Young said. “We’re able to manage this drop, but it’s something we obviously have to keep watching…and making sure we’re not over-generating electricity.”

Turning off generation, especially for nuclear plants, is an intensive process, as are restarts and would likely happen only if the downward demand trend intensifies significantly, amid concerns over Ontario’s electricity getting dirtier if baseload is displaced. However, one of North America’s largest generators, Bruce Power near Kincardine, Ont., said it had a large degree of flexibility to scale down or up.

“We have the ability to provide one-third of our output as a dynamic response, which is unique to our facility,” said James Scongack, an executive vice-president with Bruce Power. “We developed this coming out of the 2008 downturn and it’s been a critical system asset for the last decade.”

“We don’t see there being a scenario where our baseload will not be needed,” he said, even as some warn Ontario may be short of electricity in the coming years.

The province’s publicly owned Ontario Power Generation said it was also in conversations with the system operator, which provides direction to generators, and is often cited in the Ontario election discussion.

One clear shift in normal work-day usage with so many people staying at home has been the change in demand patterns. Typically, Young said, there’s a peak from about 7 a.m. to 8 a.m. as people wake and get ready to go to work or school. The peak is now occurring later in the morning, Young said.


Related News

View more

Cheap oil contagion is clear and present danger to Canada

Canada Oil Recession Outlook analyzes the Russia-Saudi price war, OPEC discord, COVID-19 demand shock, WTI and WCS collapse, Alberta oilsands exposure, U.S. shale stress, and GDP risks from blockades and fiscal responses.


Key Points

An outlook on how the oil price war and COVID-19 demand shock could tip Canada into recession and strain producers.

✅ WTI and WCS prices plunge on OPEC-Russia discord

✅ Alberta oilsands face break-even pressure near 30 USD WTI

✅ RBC flags global recession; GDP hit from blockades, virus


A war between Russia and Saudi Arabia for market share for oil may have been triggered by the COVID-19 pandemic in China, but the oil price crash contagion that it will spread could have impacts that last longer than the virus.

The prospects for Canada are not good.

Plunging oil prices, reduced economic activity from virus containment, and the fallout from weeks of railway blockades over the Coastal GasLink pipeline all add up to “a one-two-three punch that I think is almost inevitably going to put Canada in a position where its growth has to be negative,” said Dan McTeague, a former Liberal MP and current president of Canadians for Affordable Energy. The situation “certainly has the makings” of a recession, said Ken Peacock, chief economist for the Business Council of British Columbia.

“At a minimum, it’s going to be very disruptive and we’re going to have maybe one negative quarter,” Peacock said. “Whether there’s a second one, where it gets labeled a recession, is a different question. But it’s going to generate some turmoil and challenges over the next two quarters – there’s no doubt about that.”

RBC Economics on March 13 announced it now predicts a global recession and cut its growth projections for Canada's economy in 2020 by half a per cent.

Oil price futures plunged 30% last week, dragging stock markets and currencies, including the Canadian dollar, down with them, even as a deep freeze strained U.S. energy systems. That drop came on top of a 17% decline in February, due to falling demand for oil due to the virus.

The latest price plunge – the worst since the 1991 Gulf War – was the result of Russia and the Organization of Petroleum Exporting Countries (OPEC), led by Saudi Arabia, failing to agree on oil production cuts.

The COVID-19 outbreak in China – the world’s second-largest oil consumer – had resulted in a dramatic drop in oil demand in that country, and a sudden glut of oil, with the U.S. energy crisis affecting electricity, gas and EV markets.

OPEC has historically been able to moderate global oil prices by controlling output. But when Russia refused to co-operate with OPEC and agree to production cuts, Saudi Arabia’s state-owned company, Aramco, announced it plans to boost its oil output from 9.7 million barrels per day (bpd) to 12.3 million bpd in April.

In response to that announcement, West Texas Intermediate (WTI) prices dropped 18% to below US$34 per barrel while the Canadian Crude Index fell 24% to US$21. Western Canadian Select dropped 39% to US$15.73.

The effect on Alberta oilsands producers was severe and immediate. Cenovus Energy Inc. (TSX:CVE) saw roughly $2 billion in market cap erased on March 9, when its stock dropped by 52%, which came on top of a 12% drop March 6.

The company responded the very next day by announcing it would cut spending by 32% in 2020, suspend its oil-by-rail program and defer expansion projects.

MEG Energy Corp. (TSX:MEG), which suffered a 56% share price drop on March 9, also announced a 20% reduction in its 2020 capital spending plan.

Peter Tertzakian, chief economist for ARC Energy Research Institute, wrote last week that Russia’s plan is to try to hurt U.S. shale oil producers, who have more than doubled U.S. oil production over the past decade.

Anas Alhajji, a global oil analyst, expects that plan could work. Even before the oil price shock, he had predicted the great shale boom in the U.S. was coming to an end.

“Shale production will decline, and the myth of ‘explosive growth’ will end,” he told Business in Vancouver. “The impact is global and Canadian producers might suffer even more if the oil that Saudi Arabia sends to the U.S. is medium and heavy. This might last longer than what people think.”

The question for Alberta is how Canadian producers can continue to operate through a period of cheap oil. Alberta producers do not compete on the global market. They serve a niche market of U.S. heavy oil refiners, and Biden-era policy is seen as potentially more favourable for Canada’s energy sector than alternatives.

“On the positive side, the industry is battle-hardened,” Tertzakian wrote. “Over the past five years, innovative companies have already learned to endure some of the lowest prices in the world.”

But he added that they need WTI prices of US$30 per barrel just to break even.

“But that’s an average break-even threshold for an industry with a wide variation in costs. That means at that level about half the companies can’t pay their bills and half are treading water.”

Just prior to the oil price plunge, the International Energy Agency (IEA) updated its 2020 forecast for global oil consumption from an 825,000 bpd increase in oil consumption to a 90,000 bpd decrease, due to the COVID-19 virus and consequent economic contraction and reduction in travel.

The IEA predicts global oil demand won’t return to “normal” until the second half of 2020. But even if demand does return to pre-virus levels, that doesn’t mean oil prices will – not if Saudi Arabia can sustain increased oil production at low prices, and evolving clean grid priorities could influence the trajectory too.

The oil plunge was greeted in Alberta with alarm. Alberta Premier Jason Kenney warned Alberta is in “uncharted territory” as consumers are urged to lock in rates and said his government might have to review its balanced budget and resort to emergency deficit spending.

While British Columbians – who pay some of the highest gasoline prices in North America – will enjoy lower gasoline prices at a time when prices are usually starting a seasonal spike, B.C.’s economy could feel knock-on effects from a recession in Alberta.

“We sell a lot of inputs, do a lot of trade with Alberta, so it’s important for B.C., Alberta’s economic health,” Peacock said, “and recent tensions over electricity purchase talks underscore that.”

Last week, the Trudeau government announced $1 billion in emergency funding to cope with the virus and waived a one-week waiting period for unemployment insurance.


Related News

View more

Sign Up for Electricity Forum’s Newsletter

Stay informed with our FREE Newsletter — get the latest news, breakthrough technologies, and expert insights, delivered straight to your inbox.

Electricity Today T&D Magazine Subscribe for FREE

Stay informed with the latest T&D policies and technologies.
  • Timely insights from industry experts
  • Practical solutions T&D engineers
  • Free access to every issue

Live Online & In-person Group Training

Advantages To Instructor-Led Training – Instructor-Led Course, Customized Training, Multiple Locations, Economical, CEU Credits, Course Discounts.

Request For Quotation

Whether you would prefer Live Online or In-Person instruction, our electrical training courses can be tailored to meet your company's specific requirements and delivered to your employees in one location or at various locations.