New Zealand Renewable Energy Strategy examines decarbonisation, GHG emissions, and net energy as electrification accelerates, expanding hydro, geothermal, wind, and solar PV while weighing intermittency, storage, materials, and energy security for a resilient power system.
Key Points
A plan to expand electricity generation, balancing decarbonisation, net energy limits, and energy security.
✅ Distinguishes decarbonisation targets from renewable capacity growth
✅ Highlights net energy limits, intermittency, and storage needs
✅ Addresses materials, GHG build-out costs, and energy security
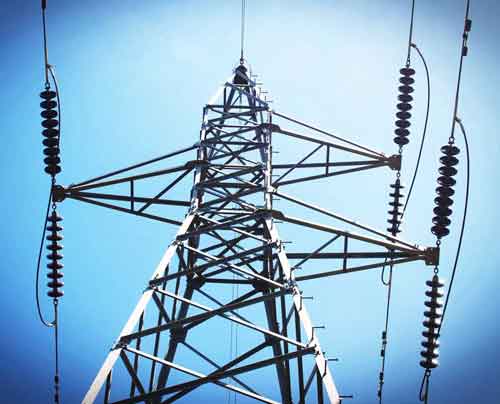
The Electricity Authority has released a document outlining a plan to achieve the Government’s goal of more than doubling the amount of electricity generated in New Zealand over the next few decades.
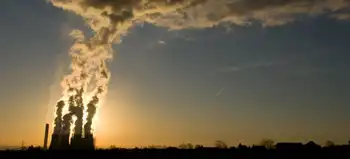
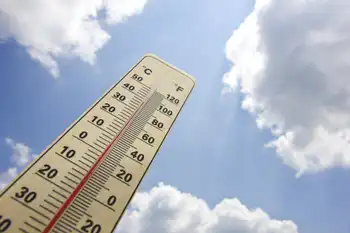
This goal is seen as a way of both reducing our greenhouse gas (GHG) emissions overall, as everything becomes electrified, and ensuring we have a 100 percent renewable energy system at our disposal. Often these two goals are seen as being the same – to decarbonise we must transition to more renewable energy to power our society.
But they are quite different goals and should be clearly differentiated. GHG emissions could be controlled very effectively by rationing the use of a fossil fuel lockdown approach, with declining rations being available over a few years. Such a direct method of controlling emissions would ensure we do our bit to remain within a safe carbon budget.
If we took this dramatic step we could stop fretting about how to reduce emissions (that would be guaranteed by the rationing), and instead focus on how to adapt our lives to the absence of fossil fuels.
Again, these may seem like the same task, but they are not. Decarbonising is generally thought of in terms of replacing fossil fuels with some other energy source, signalling that a green recovery must address more than just wind capacity. Adapting our lives to the absence of fossil fuels pushes us to ask more fundamental questions about how much energy we actually need, what we need energy for, and the impact of that energy on our environment.
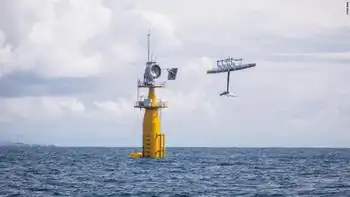
MBIE data indicate that between 1990 and 2020, New Zealand almost doubled the total amount of energy it produced from renewable energy sources - hydro, geothermal and some solar PV and wind turbines.
Over this same time period our GHG emissions increased by about 25 percent. The increase in renewables didn’t result in less GHG emissions because we increased our total energy use by almost 50 percent, mostly by using fossil fuels. The largest fossil fuel increases were used in transport, agriculture, forestry and fisheries (approximately 60 percent increases for each).
These data clearly demonstrate that increasing renewable energy sources do not necessarily result in reduced GHG emissions.
The same MBIE data indicate that over this same time period, the amount of Losses and Own Use category for energy use more than doubled. As of 2020 almost 30 percent of all energy consumed in New Zealand fell into this category.
These data indicate that more renewable energy sources are historically associated with less energy actually being available to do work in society.
While the category Losses and Own Use is not a net energy analysis, the large increase in this category makes the call for a system-wide net energy analysis all the more urgent.
Net energy is the amount of energy available after the energy inputs to produce and deliver the energy is subtracted. There is considerable data available indicating that solar PV and wind turbines have a much lower net energy surplus than fossil fuels.
And there is further evidence that when the intermittency and storage requirements are engineered into a total renewable energy system, the net energy of the entire system declines sharply. Could the Losses and Other Uses increase over this 30-year period be an indication of things to come?
Despite the importance of net energy analysis in designing a national energy system which is intended to provide energy security and resilience, there is not a single mention of net energy surplus in the EA reference document.
So over the last 30 years, New Zealand has doubled its renewable energy capacity, and at the same time increased its GHG emissions and reduced the overall efficiency of the national energy system.
And we are now planning to more than double our renewable energy system yet again over the next 30 years, even as zero-emissions electricity by 2035 is being debated elsewhere. We need to ask if this is a good idea.
How can we expand New Zealand’s solar PV and wind turbines without using fossil fuels? We can’t.
How could we expand our solar PV and wind turbines without mining rare minerals and the hidden costs of clean energy they entail, further contributing to ecological destruction and often increasing social injustices? We can't.
Even if we could construct, deliver, install and maintain solar PV and wind turbines without generating more GHG emissions and destroying ecosystems and poor communities, this “renewable” infrastructure would have to be replaced in a few decades. But there are at least two major problems with this assumed scenario.
The rare earth minerals required for this replacement will already be exhausted by the initial build out. Recycling will only provide a limited amount of replacements.
The other challenge is that a mostly “renewable” energy system will likely have a considerably lower net energy surplus. So where, in 2060, will the energy come from to either mine or recycle the raw materials, and to rebuild, reinstall and maintain the next iteration of a renewable energy system?
There is currently no plan for this replacement. It is a serious misnomer to call these energy technologies “renewable”. They are not as they rely on considerable raw material inputs and fossil energy for their production and never ending replacement.
New Zealand is, of course, blessed with an unusually high level of hydro electric and geothermal power. New Zealand currently uses over 170 GJ of total energy per capita, 40 percent of which is “renewable”. This provides approximately 70 GJ of “renewable” energy per capita with our current population.
This is the average global per capita energy level from all sources across all nations, as calls for 100% renewable energy globally emphasize. Several nations operate with roughly this amount of total energy per capita that New Zealand can generate just from “renewables”.
It is worth reflecting on the 170 GJ of total energy use we currently consume. Different studies give very different results regarding what levels are necessary for a good life.
For a complex industrial society such as ours, 100 GJ pc is said to be necessary for a high levels of wellbeing, determined both subjectively (life satisfaction/ happiness measures), and objectively (e.g. infant mortality levels, female morbidity as an index of population health, access to nutritious food and educational and health resources, etc). These studies do not take into account the large amount of energy that is wasted either through inefficient technologies, or frivolous use, which effective decarbonization strategies seek to reduce.
Other studies that consider the minimal energy needed for wellbeing suggest a much lower level of per capita energy consumption is required. These studies take a different approach and focus on ensuring basic wellbeing is maintained, but not necessarily with all the trappings of a complex industrial society. Their results indicate a level of approximately 20 GJ per capita is adequate.
In either case, we in New Zealand are wasting a lot of energy, both in terms of the efficiency of our technologies (see the Losses and Own Use info above), and also in our uses which do not contribute to wellbeing (think of the private vehicle travel that could be done by active or public transport – if we had good infrastructure in place).
We in New Zealand need a national dialogue about our future. And energy availability is only one aspect. We need to discuss what our carrying capacity is, what level of consumption is sustainable for our population, and whether we wish to make adjustments in either our per capita consumption or our population. Both together determine whether we are on the sustainable side of carrying capacity. Currently we are on the unsustainable side, meaning our way of life cannot endure. Not a good look for being a good ancestor.
The current trajectory of the Government and Electricity Authority appears to be grossly unsustainable. At the very least they should be able to answer the questions posed here about the GHG emissions from implementing a totally renewable energy system, the net energy of such a system, and the related environmental and social consequences.
Public dialogue is critical to collectively working out our future. Allowing the current profit-driven trajectory to unfold is a recipe for disasters for our children and grandchildren.
Being silent on these issues amounts to complicity in allowing short-term financial interests and an addiction to convenience jeopardise a genuinely secure and resilient future. Let’s get some answers from the Government and Electricity Authority to critical questions about energy security.
Related News