NB Power & AECL Reach Agreement on Point Lepreau

By


Protective Relay Training - Basic

Our customized live online or in‑person group training can be delivered to your staff at your location.

  • Live Online
  • 12 hours Instructor-led
  • Group Training Available
Regular Price:
$699
Coupon Price:
$599
Reserve Your Seat Today

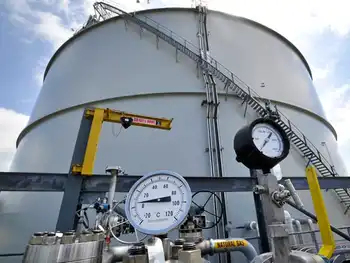
Fredericton -- New Brunswick Power Corporation (NB Power) and Atomic Energy of Canada Ltd. (AECL) have reached an agreement on the refurbishment assessment program at the Point Lepreau Generating Station.

The assessment program will define the technical scope for the potential refurbishment of the station. It consists of preliminary engineering for fuel channel replacement and a comprehensive plant condition appraisal. Under the agreement, AECL will act as the general contractor and will utilize NB Power resources. The preliminary engineering and assessment program represents an investment of up to $40 million by NB Power. NB PowerÂ’s Board of Directors will make a decision on whether to support refurbishment and life extension of Point Lepreau in 2002. A technical and economic review of Point Lepreau by consultant Hagler Bailly in 1998 determined that refurbishment in the 2006-2008 period may be desirable based on refurbishment costs and the achievement of a high capacity factor over the stationÂ’s extended life. Following completion of the AECL assessment, the costs and benefits of refurbishment will be compared with other development opportunities to determine the most viable option for NB Power. Refurbishment would require the replacement of fuel channels, the calandria tubes and other plant components to extend the stationÂ’s operating life by 25 years.

"This agreement is the beginning of a new business relationship between NB Power and AECL," said NB Power President and CEO James Hankinson. If the decision is made to refurbish Point Lepreau, NB Power intends to appoint AECL as project manager and implement a risk and benefits sharing arrangement with AECL based on the stationÂ’s future operating performance.

"Our companies have complementary strengths that will help achieve the best operational and financial value from Point Lepreau," added Mr. Hankinson.

"As the designer and original supplier of the CANDU 6 reactor at Point Lepreau, AECL is a technology leader capable of delivering complete project management and engineering services," said R. Allen Kilpatrick, President and CEO of AECL.

"We have tremendous confidence in the capability of the CANDU design. This strategic relationship will help develop a design framework for life extension of the CANDU 6," Kilpatrick said.

"The operators of nuclear generating stations in the United States have markedly improved the performance of their plants and many are looking for life extensions. NB Power will be the leader in refurbishing CANDU 6 power reactors," Kilpatrick added.

NB Power's CANDU 6, 635 MW unit at Point Lepreau began operation in 1982 and supplies up to 30% of the utility's generation. After hydro, nuclear is the lowest cost generator on NB PowerÂ’s system. It is also an important component of the utilityÂ’s climate change and sulphur dioxide management initiatives because it does not contribute to these emissions.

Over the past three years, Point Lepreau has instituted performance improvement initiatives to achieve more consistent, predictable operations. Since 1996, the station has achieved capacity factors of 72% (1999/00), 84% (1998/99) and 66% (1997/98).

For More Information, Contact: Marcella LeBlanc NB Power Director Public Affairs (506) 458-3777

Related News

Offshore wind is set to become a $1 trillion business

Offshore wind power accelerates low-carbon electrification, leveraging floating turbines, high capacity factors, HVDC transmission, and hydrogen production to decarbonize grids, cut CO2, and deliver competitive, reliable renewable energy near demand centers.


Key Points

Offshore wind power uses offshore turbines to deliver low-carbon electricity with high capacity factors and falling costs.

✅ Sea-based wind farms with 40-50% capacity factors

✅ Floating turbines unlock deep-water, far-shore resources

✅ Enables hydrogen production and strengthens grid reliability


The need for affordable low-carbon technologies is greater than ever

Global energy-related CO2 emissions reached a historic high in 2018, driven by an increase in coal use in the power sector. Despite impressive gains for renewables, fossil fuels still account for nearly two-thirds of electricity generation, the same share as 20 years ago. There are signs of a shift, with increasing pledges to decarbonise economies and tackle air pollution, and with World Bank support helping developing countries scale wind, but action needs to accelerate to meet sustainable energy goals. As electrification of the global energy system continues, the need for clean and affordable low-carbon technologies to produce this electricity is more pressing than ever. This World Energy Outlook special report offers a deep dive on a technology that today has a total capacity of 23 GW (80% of it in Europe) and accounts for only 0.3% of global electricity generation, but has the potential to become a mainstay of the world's power supply. The report provides the most comprehensive analysis to date of the global outlook for offshore wind, its contributions to electricity systems and its role in clean energy transitions.


The offshore wind market has been gaining momentum

The global offshore wind market grew nearly 30% per year between 2010 and 2018, benefitting from rapid technology improvements. Over the next five years, about 150 new offshore wind projects are scheduled to be completed around the world, pointing to an increasing role for offshore wind in power supplies. Europe has fostered the technology's development, led by the UK offshore wind sector alongside Germany and Denmark. The United Kingdom and Germany currently have the largest offshore wind capacity in operation, while Denmark produced 15% of its electricity from offshore wind in 2018. China added more capacity than any other country in 2018.


The untapped potential of offshore wind is vast

The best offshore wind sites could supply more than the total amount of electricity consumed worldwide today. And that would involve tapping only the sites close to shores. The IEA initiated a new geospatial analysis for this report to assess offshore wind technical potential country by country. The analysis was based on the latest global weather data on wind speed and quality while factoring in the newest turbine designs. Offshore wind's technical potential is 36 000 TWh per year for installations in water less than 60 metres deep and within 60 km from shore. Global electricity demand is currently 23 000 TWh. Moving further from shore and into deeper waters, floating turbines could unlock enough potential to meet the world's total electricity demand 11 times over in 2040. Our new geospatial analysis indicates that offshore wind alone could meet several times electricity demand in a number of countries, including in Europe, the United States and Japan. The industry is adapting various floating foundation technologies that have already been proven in the oil and gas sector. The first projects are under development and look to prove the feasibility and cost-effectiveness of floating offshore wind technologies.


Offshore wind's attributes are very promising for power systems

New offshore wind projects have capacity factors of 40-50%, as larger turbines and other technology improvements are helping to make the most of available wind resources. At these levels, offshore wind matches the capacity factors of gas- and coal-fired power plants in some regions – though offshore wind is not available at all times. Its capacity factors exceed those of onshore wind and are about double those of solar PV. Offshore wind output varies according to the strength of the wind, but its hourly variability is lower than that of solar PV. Offshore wind typically fluctuates within a narrower band, up to 20% from hour to hour, than solar PV, which varies up to 40%.

Offshore wind's high capacity factors and lower variability make its system value comparable to baseload technologies, placing it in a category of its own – a variable baseload technology. Offshore wind can generate electricity during all hours of the day and tends to produce more electricity in winter months in Europe, the United States and China, as well as during the monsoon season in India. These characteristics mean that offshore wind's system value is generally higher than that of its onshore counterpart and more stable over time than that of solar PV. Offshore wind also contributes to electricity security, with its high availability and seasonality patterns it is able to make a stronger contribution to system needs than other variable renewables. In doing so, offshore wind contributes to reducing CO2 and air pollutant emissions while also lowering the need for investment in dispatchable power plants. Offshore wind also has the advantage of avoiding many land use and social acceptance issues that other variable renewables are facing.


Offshore wind is on track to be a competitive source of electricity

Offshore wind is set to be competitive with fossil fuels within the next decade, as well as with other renewables including solar PV. The cost of offshore wind is declining and is set to fall further. Financing costs account for 35% to 50% of overall generation cost, and supportive policy frameworks are now enabling projects to secure low cost financing in Europe, with zero-subsidy tenders being awarded. Technology costs are also falling. The levelised cost of electricity produced by offshore wind is projected to decline by nearly 60% by 2040. Combined with its relatively high value to the system, this will make offshore wind one of the most competitive sources of electricity. In Europe, recent auctions indicate that offshore wind will soon beat new natural gas-fired capacity on cost and be on a par with solar PV and onshore wind. In China, offshore wind is set to become competitive with new coal-fired capacity around 2030 and be on par with solar PV and onshore wind. In the United States, recent project proposals indicate that offshore wind will soon be an affordable option, even as the 1 GW timeline continues to evolve, with potential to serve demand centres along the country's east coast.

Innovation is delivering deep cost reductions in offshore wind, and transmission costs will become increasingly important. The average upfront cost to build a 1 gigawatt offshore wind project, including transmission, was over $4 billion in 2018, but the cost is set to drop by more than 40% over the next decade. This overall decline is driven by a 60% reduction in the costs of turbines, foundations and their installation. Transmission accounts for around one-quarter of total offshore wind costs today, but its share in total costs is set to increase to about one-half as new projects move further from shore. Innovation in transmission, for example through work to expand the limits of direct current technologies, will be essential to support new projects without raising their overall costs.


Offshore wind is set to become a $1 trillion business

Offshore wind power capacity is set to increase by at least 15-fold worldwide by 2040, becoming a $1 trillion business. Under current investment plans and policies, the global offshore wind market is set to expand by 13% per year, reflecting its growth despite Covid-19 in recent years, passing 20 GW of additions per year by 2030. This will require capital spending of $840 billion over the next two decades, almost matching that for natural gas-fired or coal-fired capacity. Achieving global climate and sustainability goals would require faster growth: capacity additions would need to approach 40 GW per year in the 2030s, pushing cumulative investment to over $1.2 trillion. 

The promising outlook for offshore wind is underpinned by policy support in an increasing number of regions. Several European North Seas countries – including the United Kingdom, Germany, the Netherlands and Denmark – have policy targets supporting offshore wind. Although a relative newcomer to the technology, China is quickly building up its offshore wind industry, aiming to develop a project pipeline of 10 GW by 2020. In the United States, state-level targets and federal incentives are set to kick-start the U.S. offshore wind surge in the coming years. Additionally, policy targets are in place and projects under development in Korea, Japan, Chinese Taipei and Viet Nam.

 The synergies between offshore wind and offshore oil and gas activities provide new market opportunities. Since offshore energy operations share technologies and elements of their supply chains, oil and gas companies started investing in offshore wind projects many years ago. We estimate that about 40% of the full lifetime costs of an offshore wind project, including construction and maintenance, have significant synergies with the offshore oil and gas sector. That translates into a market opportunity of $400 billion or more in Europe and China over the next two decades. The construction of foundations and subsea structures offers potential crossover business, as do practices related to the maintenance and inspection of platforms. In addition to these opportunities, offshore oil and gas platforms require electricity that is often supplied by gas turbines or diesel engines, but that could be provided by nearby wind farms, thereby reducing CO2 emissions, air pollutants and costs.


Offshore wind can accelerate clean energy transitions

Offshore wind can help drive energy transitions by decarbonising electricity and by producing low-carbon fuels. Over the next two decades, its expansion could avoid between 5 billion and 7 billion tonnes of CO2 emissions from the power sector globally, while also reducing air pollution and enhancing energy security by reducing reliance on imported fuels. The European Union is poised to continue leading the wind energy at sea in Europe industry in support of its climate goals: its offshore wind capacity is set to increase by at least fourfold by 2030. This growth puts offshore wind on track to become the European Union's largest source of electricity in the 2040s. Beyond electricity, offshore wind's high capacity factors and falling costs makes it a good match to produce low-carbon hydrogen, a versatile product that could help decarbonise the buildings sector and some of the hardest to abate activities in industry and transport. For example, a 1 gigawatt offshore wind project could produce enough low-carbon hydrogen to heat about 250 000 homes. Rising demand for low-carbon hydrogen could also dramatically increase the market potential for offshore wind. Europe is looking to develop offshore "hubs" for producing electricity and clean hydrogen from offshore wind.


It's not all smooth sailing

Offshore wind faces several challenges that could slow its growth in established and emerging markets, but policy makers and regulators can clear the path ahead. Developing efficient supply chains is crucial for the offshore wind industry to deliver low-cost projects. Doing so is likely to call for multibillion-dollar investments in ever-larger support vessels and construction equipment. Such investment is especially difficult in the face of uncertainty. Governments can facilitate investment of this kind by establishing a long-term vision for offshore wind and by drawing on U.K. policy lessons to define the measures to be taken to help make that vision a reality. Long-term clarity would also enable effective system integration of offshore wind, including system planning to ensure reliability during periods of low wind availability.

The success of offshore wind depends on developing onshore grid infrastructure. Whether the responsibility for developing offshore transmission lies with project developers or transmission system operators, regulations should encourage efficient planning and design practices that support the long-term vision for offshore wind. Those regulations should recognise that the development of onshore grid infrastructure is essential to the efficient integration of power production from offshore wind. Without appropriate grid reinforcements and expansion, there is a risk of large amounts of offshore wind power going unused, and opportunities for further expansion could be stifled. Development could also be slowed by marine planning practices, regulations for awarding development rights and public acceptance issues.

The future of offshore wind looks bright but hinges on the right policies

The outlook for offshore wind is very positive as efforts to decarbonise and reduce local pollution accelerate. While offshore wind provides just 0.3% of global electricity supply today, it has vast potential around the world and an important role to play in the broader energy system. Offshore wind can drive down CO2 emissions and air pollutants from electricity generation. It can also do so in other sectors through the production of clean hydrogen and related fuels. The high system value of offshore wind offers advantages that make a strong case for its role alongside other renewables and low-carbon technologies. Government policies will continue to play a critical role in the future of offshore wind and  the overall pace of clean energy transitions around the world.


Related News

View more

Cost, safety drive line-burying decisions at Tucson Electric Power

TEP Undergrounding Policy prioritizes selective underground power lines to manage wildfire risk, engineering costs, and ratepayer impacts, balancing transmission and distribution reliability with right-of-way, safety, and vegetation management per Arizona regulators.


Key Points

A selective TEP approach to bury lines where safety, engineering, and cost justify undergrounding.

✅ Selective undergrounding for feeders near substations

✅ Balances wildfire mitigation, reliability, and ratepayer costs

✅ Follows ACC rules, BLM and USFS vegetation management


Though wildfires in California caused by power lines have prompted calls for more underground lines, Tucson Electric Power Co. plans to keep to its policy of burying lines selectively for safety.

Like many other utilities, TEP typically doesn’t install its long-range, high-voltage transmission lines, such as the TransWest Express project, and distribution equipment underground because of higher costs that would be passed on to ratepayers, TEP spokesman Joe Barrios said.

But the company will sometimes bury lower-voltage lines and equipment where it is cost-effective or needed for safety as utilities adapt to climate change across North America, or if customers or developers are willing to pay the higher installation costs

Underground installations generally include additional engineering expenses, right-of-way acquisition for projects like the New England Clean Power Link in other regions, and added labor and materials, Barrios said.

“This practice avoids passing along unnecessary costs to customers through their rates, so that all customers are not asked to subsidize a discretionary expenditure that primarily benefits residents or property owners in one small area of our service territory,” he said, adding that the Arizona Corporation Commission has supported the company’s policy.

Even so, TEP will place equipment underground in some circumstances if engineering or safety concerns, including electrical safety tips that utilities promote during storm season, justify the additional cost of underground installation, Barrios said.

In fact, lower-voltage “feeder” lines emerging from distribution substations are typically installed underground until the lines reach a point where they can be safely brought above ground, he added.

While in California PG&E has shut off power during windy weather to avoid wildfires in forested areas traversed by its power lines after events like the Drum Fire last June, TEP doesn’t face the same kind of wildfire risk, Barrios said.

Most of TEP’s 5,000 miles of transmission and distribution lines aren’t located in heavily forested areas that would raise fire concerns, though large urban systems have seen outages after station fires in Los Angeles, he said.

However, TEP has an active program of monitoring transmission lines and trimming vegetation to maintain a fire-safety buffer zone and address risks from vandalism such as copper theft where applicable, in compliance with federal regulations and in cooperation with the U.S. Bureau of Land Management and the U.S. Forest Service.


Related News

View more

Canadian Scientists say power utilities need to adapt to climate change

Canada Power Grid Climate Resilience integrates extreme weather planning, microgrids, battery storage, renewable energy, vegetation management, and undergrounding to reduce outages, harden infrastructure, modernize utilities, and safeguard reliability during storms, ice events, and wildfires.


Key Points

Canada's grid resilience hardens utilities against extreme weather using microgrids, storage, renewables, and upgrades.

✅ Grid hardening: microgrids, storage, renewable integration

✅ Vegetation management reduces storm-related line contact

✅ Selective undergrounding where risk and cost justify


The increasing intensity of storms that lead to massive power outages highlights the need for Canada’s electrical utilities to be more robust and innovative, climate change scientists say.

“We need to plan to be more resilient in the face of the increasing chances of these events occurring,” University of New Brunswick climate change scientist Louise Comeau said in a recent interview.

The East Coast was walloped this week by the third storm in as many days, with high winds toppling trees and even part of a Halifax church steeple, underscoring the value of storm-season electrical safety tips for residents.

Significant weather events have consistently increased over the last five years, according to the Canadian Electricity Association (CEA), which has tracked such events since 2003.

#google#

Nearly a quarter of total outage hours nationally in 2016 – 22 per cent – were caused by two ice storms, a lightning storm, and the Fort McMurray fires, which the CEA said may or may not be classified as a climate event.

“It (climate change) is putting quite a lot of pressure on electricity companies coast to coast to coast to improve their processes and look for ways to strengthen their systems in the face of this evolving threat,” said Devin McCarthy, vice president of public affairs and U.S. policy for the CEA, which represents 40 utilities serving 14 million customers.

The 2016 figures – the most recent available – indicate the average Canadian customer experienced 3.1 outages and 5.66 hours of outage time.

McCarthy said electricity companies can’t just build their systems to withstand the worst storm they’d dealt with over the previous 30 years. They must prepare for worse, and address risks highlighted by Site C dam stability concerns as part of long-term planning.

“There needs to be a more forward looking approach, climate science led, that looks at what do we expect our system to be up against in the next 20, 30 or 50 years,” he said.

Toronto Hydro is either looking at or installing equipment with extreme weather in mind, Elias Lyberogiannis, the utility’s general manager of engineering, said in an email.

That includes stainless steel transformers that are more resistant to corrosion, and breakaway links for overhead service connections, which allow service wires to safely disconnect from poles and prevents damage to service masts.

Comeau said smaller grids, tied to electrical systems operated by larger utilities, often utilize renewable energy sources such as solar and wind as well as battery storage technology to power collections of buildings, homes, schools and hospitals.

“Capacity to do that means we are less vulnerable when the central systems break down,” Comeau said.

Nova Scotia Power recently announced an “intelligent feeder” pilot project, which involves the installation of Tesla Powerwall storage batteries in 10 homes in Elmsdale, N.S., and a large grid-sized battery at the local substation. The batteries are connected to an electrical line powered in part by nearby wind turbines.

The idea is to test the capability of providing customers with back-up power, while collecting data that will be useful for planning future energy needs.

Tony O’Hara, NB Power’s vice-president of engineering, said the utility, which recently sounded an alarm on copper theft, was in the late planning stages of a micro-grid for the western part of the province, and is also studying the use of large battery storage banks.

“Those things are coming, that will be an evolution over time for sure,” said O’Hara.

Some solutions may be simpler. Smaller utilities, like Nova Scotia Power, are focusing on strengthening overhead systems, mainly through vegetation management, while in Ontario, Hydro One and Alectra are making major investments to strengthen infrastructure in the Hamilton area.

“The number one cause of outages during storms, particularly those with high winds and heavy snow, is trees making contact with power lines,” said N.S. Power’s Tiffany Chase.

The company has an annual budget of $20 million for tree trimming and removal.

“But the reality is with overhead infrastructure, trees are going to cause damage no matter how robust the infrastructure is,” said Matt Drover, the utility’s director for regional operations.

“We are looking at things like battery storage and a variety of other reliability programs to help with that.”

NB Power also has an increased emphasis on tree trimming and removal, and now spends $14 million a year on it, up from $6 million prior to 2014.

O’Hara said the vegetation program has helped drive the average duration of power outages down since 2014 from about three hours to two hours and 45 minutes.

Some power cables are buried in both Nova Scotia and New Brunswick, mostly in urban areas. But both utilities maintain it’s too expensive to bury entire systems – estimated at $1 million per kilometre by Nova Scotia Power.

The issue of burying more lines was top of mind in Toronto following a 2013 ice storm, but that’s city’s utility also rejected the idea of a large-scale underground system as too expensive – estimating the cost at around $15 billion, while Ontario customers have seen Hydro One delivery rates rise in recent adjustments.

“Having said that, it is prudent to do so for some installations depending on site specific conditions and the risks that exist,” Lyberogiannis said.

Comeau said lowering risks will both save money and disruption to people’s lives.

“We can’t just do what we used to do,” said Xuebin Zhang, a senior climate change scientist at Environment and Climate Change Canada.

“We have to build in management risk … this has to be a new norm.”


Related News

View more

During this Pandemic, Save Money - How To Better Understand Your Electricity Bill

Commercial Electric Tariffs explain utility rate structures, peak demand charges, kWh vs kW pricing, time-of-use periods, voltage, delivery, capacity ratchets, and riders, guiding facility managers in tariff analysis for accurate energy savings.


Key Points

Commercial electric tariffs define utility pricing for energy, demand, delivery, time-of-use periods, riders, and ratchet charges.

✅ Separate kWh charges from kW peak demand fees.

✅ Verify time-of-use windows and demand interval length.

✅ Review riders, capacity ratchets, and minimum demand clauses.


Especially during these tough economic times, as major changes to electric bills are debated in some states, facility executives who don’t understand how their power is priced have been disappointed when their energy projects failed to produce expected dollar savings. Here’s how not to be one of them.

Your electric rate is spelled out in a document called a “tariff” that can be downloaded from your utility’s web page. A tariff should clearly spell out the costs for each component that is part of your rate, reflecting cost allocation practices in your region. Don’t be surprised to learn that it contains a bunch of them. Unlike residential electric rates, commercial electric bills are not based solely on the quantity of kilowatt-hours (kWh) consumed in a billing period (in the United States, that’s a month). Instead, different rates may apply to how your power is supplied, how it is delivered via electricity delivery charges, when it was consumed, its voltage, how fast it was used (in kW), and other factors.

If a tariff’s lingo and word structure are too opaque, spend some time with a utility account rep to translate it. Many state utility commissions also have customer advocates that may assist as they explore new utility rate designs that affect customers. Alternatively, for a fee, facility managers can privately chat with an energy consultant.

Common mistakes

Many facility managers try to estimate savings based on an averaged electric rate, i.e., annual electric spend divided by annual kWh. However, in markets where electricity demand is flat, such a number may obscure the fastest rising cost component: monthly peak demand charges, measured in dollars per kW (or kilo-volt-amperes, kVA).

This charge is like a monthly speeding ticket, based solely on the highest speed you drove during that time. In some areas, peak demand charges now account for 30 to 60 percent of a facility’s annual electric spend. When projecting energy cost savings, failing to separately account for kW peak demand and kWh consumption may result in erroneous results, and a lot of questions from the C-suite.

How peak demand charges are calculated varies among utilities. Some base it on the highest average speed of use across one hour in a month, while others may use the highest average speed during a 15- or 30-minute period. Others may average several of the highest speeds within a defined time period (for example, 8 a.m. to 6 p.m. on weekdays). It is whatever your tariff says it is.

Because some power-consuming (or producing) devices, including those tied to smart home electricity networks, vary in their operation or abilities, they may save money on a few — but not all — of those rate components. If an equipment vendor calculates savings from its product by using an average electric rate, take pause. Tell the vendor to return after the proposal has been redone using tariff-based numbers.

When a vendor is the only person calculating potential savings from using a product, there’s also a built-in conflict of interest: The person profiting from an equipment sale should not also be the one calculating its expected financial return. Before signing any energy project contracts, it’s essential that someone independent of the deal reviews projected savings. That person (typically an energy or engineering consultant) should be quite familiar with your facility’s electric tariff, including any special provisions, riders, discounts, etc., that may pertain. When this doesn’t happen, savings often don’t occur as planned. 

For example, some utilities add another form of demand charge, based on the highest kW in a year. It has various names: capacity, contract demand, or the generic term “ratchet charge.” Some utilities also have a minimum ratchet charge which may be based on a percent of a facility’s annual kW peak. It ensures collection of sufficient utility revenue to cover the cost of installed transmission and distribution even when a customer significantly cuts its peak demand.


Related News

View more

Congressional Democrats push FERC to act on aggregated DERs

FERC DER Aggregation advances debates over distributed energy resources as Congress presses action on Order 841, grid resilience, and wholesale market access, including rooftop solar, storage, and virtual power plant participation across PJM and ISO-NE.


Key Points

FERC DER Aggregation enables grouped distributed resources to join wholesale markets, providing capacity and flexibility.

✅ Opens wholesale market access for aggregated DER portfolios

✅ Aligns with Order 841, storage, and grid resilience goals

✅ Raises jurisdictional questions between FERC and state regulators


The Monday letter from Congressional Democrats illustrates growing frustration in Washington over the lack of FERC action on multiple power sector issues, including the aging U.S. grid and related challenges.

Last May, after the FERC technical conference, 16 Democratic Senators wrote to then-Chairman Kevin McIntyre urging him to develop guidance for grid operators on aggregated DERs.

In July, McIntyre responded, saying that FERC was "diligently reviewing the record," but the commission has taken no action since.

Since then, "DER adoption and renewable energy aggregation have continued to grow," House and Senate lawmakers wrote in their identical Monday letters, "driven not only by state and federal policies, but consumer interest in choosing cost-competitive technologies such as rooftop solar, smart thermostats and customer-sited energy generation and storage, reflecting key utility trends in the sector."

The lawmakers wrote they were "encouraged" by FERC Chairman Neil Chatterjee's comments in June 2018, writing that he "specifically cited the role DERs will play in our continued grid transition."

In that speech at the S&P Global Platts 2018 Transmission Planning and Development Conference, Chatterjee noted "growing interest" in non-transmission alternatives, including "DERs and storage."

"How the Commission treats filings associated with those first-of-kind projects could prove an important factor in investors’ assessments of whether similar non-traditional projects are bankable or not — and more broadly signal whether FERC is open to innovation in the transmission sector,” he said.

In addition to the DER order and rehearing decision on Order 841, FERC has multiple other power sector initiatives that have not seen official action in months, even as major changes to electricity pricing are debated by stakeholders.

The highest profile is its open proceeding on grid resilience, set up last January after FERC rejected a coal and nuclear bailout proposal from the Department of Energy. In October, the CEO of the PJM Interconnection, the nation’s largest wholesale power market, urged FERC to issue a final order in the docket, calling for "leadership" from the commission.

Chatterjee, however, has not indicated when FERC could decide on the case. In December, Commissioner Rich Glick told a Washington audience he is "not entirely sure where the chairman wants to go with that proceeding yet."

Outside of resilience, FERC also has open reviews of both its pipeline certificate policy and implementation of the Public Utilities Regulatory Policy Act, a key law supporting renewable energy. McIntrye set those reviews in motion during his tenure as chairman, but after his death in January the timing of both remains unclear.

In recent months, Chatterjee has also delayed FERC votes on major export facilities for liquefied natural gas and a political spending case involving PJM after impasses between Republicans and Democrats on FERC.

Two members from each party currently sit on the commission. That allows Democrats to deadlock commission votes on natural gas facilities and other issues — a partisan divide on display this week when they clashed with the chairman over offshore wind.

As the commission considers final guidance on DERs, the boundaries of federal jurisdiction are likely to be a key issue. At the technical conference, states from the Midcontinent ISO argued FERC should allow them to choose whether to let aggregated DERs participate in retail and wholesale markets. Other states argued the value proposition of distributed resources may rely on that sort of dual participation.

Despite the lack of action from FERC, some grid operators are moving forward with aggregated distributed resources in New England market reform efforts and elsewhere, demonstrating momentum. Last week, a residential solar-plus-storage aggregation cleared the ISO-NE capacity auction for the first time, committing to provide 20 MW of capacity beginning in 2022.

On the Senate side, Sens. Sheldon Whitehouse, R.I., and Ed Markey, Mass., led the letter to FERC. In the House, Reps. Peter Welch, Vt., and Mike Levin, Calif., led the signatories.


Related News

View more

Electric vehicles are a hot topic in southern Alberta

Canada Electric Vehicle Adoption is accelerating as EV range doubles, fast-charging networks expand along the Trans-Canada Highway, and drivers shift from internal combustion to clean transportation to cut emissions and support climate goals.


Key Points

Canada Electric Vehicle Adoption reflects rising EV uptake, longer range, and expanding fast-charging infrastructure.

✅ Average EV range in Canada has nearly doubled in six years.

✅ Fast chargers expanding along Trans-Canada and major corridors.

✅ Gasoline and diesel demand projected to fall sharply by 2040.


As green technology for vehicles continues to grow in popularity, with a recent EV event in Regina drawing strong interest, attendance at a seminar in southern Alberta Wednesday showed plenty people want to switch to electric.

FreeU, a series of informal education sessions about electric power and climate change, including electricity vs hydrogen considerations, helped participants to learn more about the world-changing technology.

Also included at the talks was a special electric vehicle meet up, where people interested in the technology could learn about it, first hand, from drivers who've already gone gasless despite EV shortages and wait times in many regions.

"That's kind of a warning or a caution or whatever you want to call it. You get addicted to these things and that's a good example."

James Byrne, a professor of geography at the University of Lethbridge says people are much more willing these days to look to alternatives for their driving needs, though cost remains a key barrier for many.

"The internal combustion engine is on its way out. It served us well, but electric vehicles are much cleaner, aligning with Canada's EV goals set by policymakers today."

According to the Canada Energy Regulator, the average range of electric vehicles in Canada have almost doubled in the past six years.

The agency also predicts a massive decrease in gasoline and diesel use (359 petajoules and 92 petajoules respectively) in Canada by 2040. In that same timeframe, electricity use, even though fossil-fuel share remains, is expected to increase by 118 petajoules.

The country is also developing its network of fast charging stations, so running out of juice will be less of a worry for prospective buyers, even as 2035 EV mandate debate continues among analysts.

"They have just about Interstate in the U.S. covered," Marshall said. "In Canada, they're building out the [Trans-Canada Highway] right now."


Related News

View more

Sign Up for Electricity Forum’s Newsletter

Stay informed with our FREE Newsletter — get the latest news, breakthrough technologies, and expert insights, delivered straight to your inbox.

Electricity Today T&D Magazine Subscribe for FREE

Stay informed with the latest T&D policies and technologies.
  • Timely insights from industry experts
  • Practical solutions T&D engineers
  • Free access to every issue

Live Online & In-person Group Training

Advantages To Instructor-Led Training – Instructor-Led Course, Customized Training, Multiple Locations, Economical, CEU Credits, Course Discounts.

Request For Quotation

Whether you would prefer Live Online or In-Person instruction, our electrical training courses can be tailored to meet your company's specific requirements and delivered to your employees in one location or at various locations.