Aclara system chosen for Smart Meter AMI program

By Electricity Forum


NFPA 70b Training - Electrical Maintenance

Our customized live online or in‑person group training can be delivered to your staff at your location.

  • Live Online
  • 12 hours Instructor-led
  • Group Training Available
Regular Price:
$599
Coupon Price:
$499
Reserve Your Seat Today
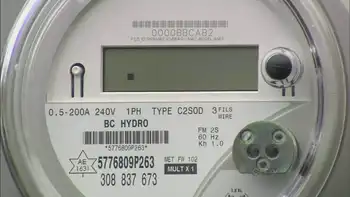
Aclara announced that Pacific Gas and Electric Company (PG&E) has selected the STAR Network system from Aclara RF Systems Inc. (formerly Hexagram), a subsidiary of ESCO Technologies Inc., to provide additional electric advanced metering infrastructure (AMI) products for PG&Â’s SmartMeter Program.

PG&E began evaluating Aclara's RF electric solution in June 2007 with a 2,000 unit field trial intended to demonstrate and validate the capabilities of Aclara's electric RF fixed network. The successful performance of this technology throughout the field trial was a significant factor in PG&E's decision to expand the deployment of this product.

PG&E has ordered 88,000 Aclara RF electric devices to be installed in the Central Valley region of northern California, which extends from Modesto to Sacramento. These units will include a ZigBee connector as well as an interface to a connect/disconnect function integrated in the meter. PG&E has indicated it is their intent to order a significant quantity of Aclara RF electric AMI devices throughout 2008, in addition to the nearly 400,000 TWACS power-line based electric AMI devices being installed in the Bakersfield and Vacaville areas.

This electric deployment is in addition to PG&E's ongoing gas AMI installations utilizing Aclara products. The RF electric units will operate under PG&E's installed STAR Network AMI system which currently manages data from over 200,000 gas meters already installed in the Central Valley.

Related News

Surging electricity demand is putting power systems under strain around the world

Global Electricity Demand Surge strains power markets, fuels price volatility, and boosts coal and gas generation as renewables lag, driving emissions, according to the IEA, with grids and clean energy investment crucial through 2024.


Key Points

A surge in power use that strained supply, raised prices, and drove power-sector CO2 emissions to record highs.

✅ 6% demand growth in 2021; largest absolute rise ever

✅ Coal up 9%; gas +2%; renewables +6% could not meet demand

✅ Prices doubled vs 2020; volatility hit EU, China, India


Global electricity demand surged above pre-pandemic levels in 2021, creating strains in major markets, pushing prices to unprecedented levels and driving the power sector’s emissions to a record high. Electricity is central to modern life and clean electricity is pivotal to energy transitions, but in the absence of faster structural change in the sector, rising demand over the next three years could result in additional market volatility and continued high emissions, according an IEA report released today.

Driven by the rapid economic rebound, and more extreme weather conditions than in 2020, including a colder than average winter, last year’s 6% rise in global electricity demand was the largest in percentage terms since 2010 when the world was recovering from the global financial crisis. In absolute terms, last year’s increase of over 1 500 terawatt-hours was the largest ever, according to the January 2022 edition of the IEA’s semi-annual Electricity Market Report.

The steep increase in demand outstripped the ability of sources of electricity supply to keep pace in some major markets, with shortages of natural gas and coal leading to volatile prices, demand destruction and negative effects on power generators, retailers and end users, notably in China, Europe and India. Around half of last year’s global growth in electricity demand took place in China, where demand grew by an estimated 10%, highlighting that Asia is set to use half of global electricity by 2025 according to the IEA. China and India suffered from power cuts at certain points in the second half of the year because of coal shortages.

“Sharp spikes in electricity prices in recent times have been causing hardship for many households and businesses around the world and risk becoming a driver of social and political tensions,” said IEA Executive Director Fatih Birol. “Policy makers should be taking action now to soften the impacts on the most vulnerable and to address the underlying causes. Higher investment in low-carbon energy technologies including renewables, energy efficiency and nuclear power – alongside an expansion of robust and smart electricity grids – can help us get out of today’s difficulties.”

The IEA’s price index for major wholesale electricity markets almost doubled compared with 2020 and was up 64% from the 2016-2020 average. In Europe, average wholesale electricity prices in the fourth quarter of 2021 were more than four times their 2015-2020 average, and wind and solar generated more electricity than gas in the EU during the year.  Besides Europe, there were also sharp price increases in Japan and India, while they were more moderate in the United States where gas supplies were less perturbed.

Electricity produced from renewable sources grew by 6% in 2021, but it was not enough to keep up with galloping demand. Coal-fired generation grew by 9%, with soaring electricity and coal use serving more than half of the increase in demand and reaching a new all-time peak as high natural gas prices led to gas-to-coal switching. Gas-fired generation grew by 2%, while nuclear increased by 3.5%, almost reaching its 2019 levels. In total, carbon dioxide (CO2) emissions from power generation rose by 7%, also reaching a record high, after having declined the two previous years.

“Emissions from electricity need to decline by 55% by 2030 to meet our Net Zero Emissions by 2050 Scenario, but in the absence of major policy action from governments, those emissions are set to remain around the same level for the next three years,” said Dr Birol. “Not only does this highlight how far off track we currently are from a pathway to net zero emissions by 2050, but it also underscores the massive changes needed for the electricity sector to fulfil its critical role in decarbonising the broader energy system.”

For 2022-2024, the report anticipates electricity demand growing 2.7% a year on average, although the Covid-19 pandemic and high energy prices bring some uncertainty to this outlook. Renewables are set to grow by 8% per year on average, and low-emissions sources are expected to serve more than 90% of net demand growth during this period. We expect nuclear-based generation to grow by 1% annually during the same period.

As a consequence of slowing electricity demand growth and significant renewables additions, fossil fuel-based generation is expected to stagnate in the coming years, and renewables are set to surpass coal by 2025 with coal-fired generation falling slightly as phase-outs and declining competitiveness in the United States and Europe are balanced by growth in markets like China, where electricity demand trends remain a puzzle in recent analyses, and India. Gas-fired generation is seen growing by around 1% a year.


Related News

View more

Neste increases the use of wind power at its Finnish production sites to nearly 30%

Neste wind power agreement boosts renewable electricity in Finland, partnering with Ilmatar and Fortum to supply Porvoo and Naantali sites, cutting Scope 2 emissions and advancing a 2035 carbon-neutral production target via long-term PPAs.


Key Points

A PPA to source wind power for sites, cutting Scope 2 emissions and supporting Neste's 2035 carbon-neutral goal.

✅ 10-year PPA with Ilmatar; + Fortum boosts renewable electricity share.

✅ Supplies ~7% of Porvoo-Naantali electricity; capacity >20 MW.

✅ Cuts Scope 2 emissions by ~55 kt CO2e per year toward 2035 neutrality.


Neste is committed to reaching carbon neutral production by 2035, mirroring efforts such as Olympus 100% renewable electricity commitments across industry.

As part of this effort, the company is increasing the use of renewable electricity at its production sites in Finland, reflecting trends such as Ireland's green electricity targets across Europe, and has signed a wind power agreement with Ilmatar, a wind power company. The agreement has been made together with Borealis, Neste's long-term partner in the Kilpilahti area in Porvoo, Finland.

As a result of the agreement with Ilmatar, as well as that signed with Fortum at the end of 2019, and in line with global growth such as Enel's 450 MW wind project in the U.S., nearly 30% of the energy used at Neste's production sites in Porvoo and Naantali will be renewable wind power in 2022.

'Neste's purpose is to create a healthier planet for our children. Our two climate commitments play an important role in living up to this ambition, and one of them is to reach carbon neutral production by 2035. It is an enormous challenge and requires several concrete measures and investments, including innovations like offshore green hydrogen initiatives. Wind power, including advances like UK offshore wind projects, is one of the over 70 measures we have identified to reduce our production's greenhouse gas emissions,' Neste's President and CEO Peter Vanacker says.

With the ten year contract, Neste is committed to purchase about one-third of the production of Ilmatar's two wind farms, reflecting broader market moves such as BC Hydro wind deals in Canada. The total capacity of the agreement is more than 20 MW, and the energy produced will correspond to around 7% of the electricity consumption at Neste's sites in Porvoo and Naantali. The wind power deliveries are expected to begin in 2022.

The two wind power agreements help Neste to reduce the indirect greenhouse gas emissions (Scope 2 emissions defined by the Greenhouse Gas Protocol) of electricity purchases at its Finnish production sites, a trend mirrored by Dutch green electricity growth across Europe, annually by approximately 55 kilotons. 55 kt/a CO2e equals annual carbon footprint of more than 8,500 EU citizens.


Related News

View more

Idaho gets vast majority of electricity from renewables, almost half from hydropower

Idaho Renewable Energy 2018 saw over 80% in-state utility-scale power from hydropower, wind, solar, biomass, and geothermal, per EIA, with imports declining as Snake River Plain resources and Hells Canyon hydro lead.


Key Points

Idaho produced over 80% in-state power from renewables in 2018, led by hydropower, wind, solar, and biomass.

✅ Hydropower supplies about half of capacity; Hells Canyon leads.

✅ Wind provides nearly 20% of capacity along the Snake River Plain.

✅ Utility-scale solar surged since 2016; biomass and geothermal add output.


More than 80% of Idaho’s in-state utility-scale electricity generation came from renewable resources in 2018, behind only Vermont, according to recently released data from the U.S. Energy Information Administration’s Electric Power Monthly and broader trends showing that solar and wind reached about 10% of U.S. generation in the first half of 2018.

Idaho generated 17.4 million MWh of electricity in 2018, of which 14.2 million MWh came from renewable sources, while nationally January power generation jumped 9.3% year over year according to EIA. Idaho uses a variety of renewable resources to generate electricity:

Hydroelectricity. Idaho ranked seventh in the U.S. in electricity generation from hydropower in 2018. About half of Idaho’s electricity generating capacity is at hydroelectric power plants, and utility actions such as the Idaho Power settlement could influence future resource choices, and seven of the state’s 10 largest power plants (in terms of electricity generation) are hydroelectric facilities. The largest privately owned hydroelectric generating facility in the U.S. is a three-dam complex on the Snake River in Hells Canyon, the deepest river gorge in North America.

Wind. Nearly one-fifth of Idaho’s electricity generating capacity and one-sixth of its generation comes from wind turbines. Idaho has substantial wind energy potential, and nationally the EIA expects solar and wind to be larger sources this summer, although only a small percentage of the state's land area is well-suited for wind development. All of the state’s wind farms are located in the southern half of the state along the Snake River Plain.

Solar. Almost 5% of Idaho’s electricity generating capacity and 3% of its generation come from utility-scale solar facilities, and nationally over half of new capacity in 2023 will be solar according to projections. The state had no utility-scale solar generation as recently as 2015. Between 2016 and 2017, Idaho’s utility-scale capacity doubled and generation increased from 30,000 MWh to more than 450,000 MWh. Idaho’s small-scale solar capacity also doubled since 2017, generating 33,000 MWh in 2018.

Biomass. Biomass-fueled power plants account for about 2% of the state’s utility-scale electricity generating capacity and 3% of its generation, contributing to a broader U.S. shift where 40% of electricity came from non-fossil sources in 2021. Wood waste from the state’s forests is the primary fuel for these plants.

Geothermal. Idaho is one of seven states with utility-scale geothermal electricity generation. Idaho has one 18-MW geothermal facility, located near the state’s southern border with Utah.

EIA says Idaho requires significant electricity imports, totaling about one-third of demand, to meet its electricity needs. However, Idaho’s electricity imports have decreased over time, and Georgia's recent import levels illustrate how regional dynamics can vary. Almost all of these imports are from neighboring states, as electricity imports from Canada accounted for less than 0.1% of Idaho’s total electricity supply in 2017.


Related News

View more

Beating Covid Is All About Electricity

Hospital Electricity Reliability underpins ICU operations, ventilators, medical devices, and diagnostics, reducing power outages risks via grid power and backup generators, while energy poverty and blackouts magnify COVID-19 mortality in vulnerable regions.


Key Points

Hospital electricity reliability is steady power that keeps ICU care, ventilators and medical devices operating.

✅ ICU loads: ventilators, monitors, infusion pumps, diagnostics

✅ Grid power plus backup generators minimize outage risk

✅ Energy poverty increases COVID-19 mortality and infection


Robert Bryce, Contributor

During her three-year career as a registered nurse, my friend, C., has cared for tuberculosis patients as well as ones with severe respiratory problems. She’s now caring for COVID-19 patients at a hospital in Ventura County, California, where debates about keeping the lights on continue amid the state’s energy transition. Is she scared about catching the virus? “No,” she replied during a phone call on Thursday. “I’m pretty unflappable.”

What would scare her? She quickly replied, “a power outage,” a threat that grows during summer blackouts when heat waves drive demand. About a year ago, while working in Oregon, the hospital she was working in lost power for about 45 minutes. “It was terrifying,” she said. 

C., who wasn’t authorized by her hospital to talk to the media, and thus asked me to only use the initial of her first name, said that COVID-19 patients are particularly reliant on electrical devices. She quickly ticked off the machines: “The bed, the IV machine, vital signs monitor, heart monitor, the sequential compression devices...” COVID-19 patients are hooked up to a minimum of five electrical devices, she said, and if the virus-stricken patient needs high-pressure oxygen or a ventilator, the number of electrical devices could be two or three times that number. “You name it, it plugs in,” she said.  

Today In: Energy

The virus has infected some 2.2 million people around the world and killed more than 150,000,including more than 32,000 people here in the U.S. While those numbers are frightening, it is apparent that the toll would be far higher without adequate supplies of reliable electricity. Modern healthcare systems depend on electricity. Hospitals are particularly big consumers. Power demand in hospitals is about 36 watts per square meter, which is about six times higher than the electricity load in a typical American home, and utilities are turning to AI to adapt to electricity demands during surges. 

Beating the coronavirus is all about electricity. Indeed, nearly every aspect of coronavirus detection, testing, and treatment requires juice. Second, it appears that the virus is more deadly in places where electricity is scarce or unreliable. Finally, if there are power outages in virus hotspots or hospitals, a real risk in a grid with more blackouts than other developed countries, the damage will be even more severe. 

As my nurse friend in Ventura County made clear, her ability to provide high-quality care for patients is wholly dependent on reliable electricity. The thermometers used to check for fever are powered by electricity. The monitors she uses to keep track of her patients, as well as her Vocera, the walkie-talkie that she uses to communicate with her colleagues, runs on batteries. Testing for the virus requires electricity. One virus-testing machine, Abbott Labs’ m2000, is a 655-pound appliance that, according to its specification sheet, runs on either 120 or 240 volts of electricity. The operating manual for a ventilator made by Hamilton Medical is chock full of instructions relating to electricity, including how to manage the machine’s batteries and alarms. 

While it may be too soon to make a direct connection between lack of electricity and the lethality of the coronavirus, the early signs from the Navajo reservation indicate that energy poverty amplifies the danger. The sprawling reservation has about 175,000 residents, but it has a higher death toll from the virus than 13 states. About 10 percent of Navajos do not have electricity in their homes and more than 30 percent lack indoor plumbing. 

The death rate from the virus on the reservation now stands at 3.4 percent, which is nearly twice the global average. In the middle of last week, the entire population of Native American tribes in the U.S. accounted for about 1,100 confirmed cases of the virus and about 44 deaths. Navajos accounted for the majority of those, with 830 confirmed cases of coronavirus and 28 deaths. 

On Saturday night, the Navajo Times reported a major increase, with 1,197 positive cases of COVID-19 on the reservation and 44 deaths. Other factors may contribute to the high infection and mortality rates on the reservation, including  high rates of diabetes, obesity, and crowded residential living situations. That said, electricity and water are essential to good hygiene and health authorities say that frequent hand washing helps cut the risk of contracting the virus. 

The devastation happening on Navajoland provides a window into what may happen in crowded, electricity-poor countries like India, Pakistan, and Bangladesh. It also shows what could happen if a tornado or hurricane were to wipe out the electric grid in virus hotspots like New Orleans, as extreme weather increasingly afflicts the grid nationwide. Sure, most American hospitals have backup generators to help assure reliable power. But those generators can fail. Further, they usually burn diesel fuel which needs to be replenished every few days. 

The essential point here is that our hospitals and critical health care machines aren’t running on solar panels and batteries. Instead, they are running on grid power that’s being provided by reliable sources — coal, natural gas, hydro, and nuclear power — which together produce about 89 percent of the electricity consumed in this country, even as Russian hacking of utilities highlights cyber risks. The pandemic — which is inflicting trillions of dollars of damage on our economy and tens of thousands of deaths — underscores the criticality of abundant and reliable electricity to our society and the tremendous damage that would occur if our health care infrastructure were to be hit by extended blackouts during the fight to stop COVID-19.

In a follow-up interview on Saturday with my friend, C., she told me that while caring for patients, she and her colleagues “are entirely dependent on electricity. We take it for granted. It’s a hidden assumption in our work,” a reminder echoed by a grid report card that warns of dangerous vulnerabilities. She quickly added she and her fellow nurses “aren’t trained or equipped to deal with circumstances that would come with shoddy power. If we lost power completely, people will die.”


Related News

View more

California's solar energy gains go up in wildfire smoke

California Wildfire Smoke Impact on Solar reduces photovoltaic output, as particulate pollution, soot, and haze dim sunlight and foul panels, cutting utility-scale generation and grid reliability across CAISO during peak demand and heatwaves.


Key Points

How smoke and soot cut solar irradiance and foul panels, slashing PV generation and straining CAISO grid operations.

✅ Smoke blocks sunlight; soot deposition reduces panel efficiency.

✅ CAISO reported ~30% drop versus July during peak smoke.

✅ Longer fire seasons threaten solar reliability and capacity planning.


Smoke from California’s unprecedented wildfires was so bad that it cut a significant chunk of solar power production in the state, even as U.S. solar generation rose in 2022 nationwide. Solar power generation dropped off by nearly a third in early September as wildfires darkened the skies with smoke, according to the US Energy Information Administration.

Those fires create thick smoke, laden with particles that block sunlight both when they’re in the air and when they settle onto solar panels. In the first two weeks of September, soot and smoke caused solar-powered electricity generation to fall 30 percent compared to the July average, according to the California Independent System Operator (CAISO), which oversees nearly all utility-scale solar energy in California, where wind and solar curtailments have been rising amid grid constraints. It was a 13.4 percent decrease from the same period last year, even though solar capacity in the state has grown about 5 percent since September 2019.

California depends on solar installations for nearly 20 percent of its electricity generation, and has more solar capacity than the next five US states trailing it combined as it works to manage its solar boom sustainably. It will need even more renewable power to meet its goal of 100 percent clean electricity generation by 2045, building on a recent near-100% renewable milestone that underscored the transition. The state’s emphasis on solar power is part of its long-term efforts to avoid more devastating effects of climate change. But in the short term, California’s renewables are already grappling with rising temperatures.

Two records were smashed early this September that contributed to the loss of solar power. California surpassed 2 million acres burned in a single fire season for the first time (1.7 million more acres have burned since then). And on September 15th, small particle pollution reached the highest levels recorded since 2000, according to the California Air Resources Board. Winds that stoked the flames also drove pollution from the largest fires in Northern California to Southern California, where there are more solar farms.

Smaller residential and commercial solar systems were affected, too, and solar panels during grid blackouts typically shut off for safety, although smoke was the primary issue here. “A lot of my systems were producing zero power,” Steve Pariani, founder of the solar installation company Solar Pro Energy Systems, told the San Mateo Daily Journal in September.

As the planet heats up, California’s fire seasons have grown longer, and blazes are tearing through more land than ever before, while grid operators are also seeing rising curtailments as they integrate more renewables. For both utilities and smaller solar efforts, wildfire smoke will continue to darken solar energy’s otherwise bright future, even as it becomes the No. 3 renewable source in the U.S. by generation.


Related News

View more

Electricity Demand In The Time Of COVID-19

COVID-19 Impact on U.S. Power Demand shows falling electricity load, lower wholesale prices, and resilient utilities in competitive markets, with regional differences tied to weather, renewable energy, stay-at-home orders, and hedging strategies.


Key Points

It outlines reduced load and prices, while regulatory design and hedging support utility stability across regions.

✅ Load down in NY, New England, PJM; weather drives South up.

✅ Wholesale prices fall 8-10% in key markets.

✅ Decoupling, contracts, hedging support utility earnings.


On March 27, Bloomberg New Energy Finance (BNEF) released a report on electricity demand and wholesale market prices impact from COVID-19 fallout. The model compares expected load based largely on weather with actual observed electricity demand changes.

So far, the hardest hit power grid is New York, with load down 7 and prices off by 10 percent. That’s expected, given New York City is the current epicenter of the US health crisis.

Next is New England, with 5 percent lower demand and 8 percent reduced wholesale prices for the week from March 19-25. BNEF says the numbers could go higher following advisories and orders issued March 24 for some 70 percent of the region’s population to stay at home.

Demand on the biggest grid in the US, the PJM (Pennsylvania/Jersey/Maryland), is 4 percent lower, with prices dropping 8 percent, as recent capacity auction payouts fell sharply. BNEF believes there will be more impact as stay at home orders are ramped up in several states.

California’s power demand for March 19-25 was 5 percent below what BNEF’s model expects without COVID-19 impact. That reflects a full week of stay-at-home orders from Governor Newsom issued March 19.

Health officials in Los Angeles and elsewhere expect a spike in COVID-19 cases in coming weeks. But BNEF’s model now actually projects rising electricity load for the state, due to what it calls "freakishly mild weather a year ago."

Rounding out the report, power demand is up for a band of southern states stretching from Florida to the desert Southwest, with weather more than offsetting public response to COVID-19 so far. BNEF says the Northwest’s grid "has not yet been highly impacted," while the Southeast is "generally in line" with pre-virus expectations.

Clearly, all of this data can change quickly and radically. Only California and New York are currently in full shutdown mode. Following them are New England (70 percent), the Midwest (65 percent), Texas (50 percent), PJM (50 percent) and the Northwest (50 percent).

In contrast, only small parts of Florida, the Southeast and Southwest are restricting movement. That could mean a big future increase for shut-ins, with heightened risks of electricity shut-offs that burden households and a corresponding impact on power demand.

Also, weather will play a major role on what happens to actual electricity demand, just as it always does. A very hot summer, for example, could offset virus-related shut-ins, just as it apparently is now in states like Texas. And it should be pointed out that regions vary widely by exposure to recession-sensitive sources of demand, such as heavy industry.

Most important for investors, however, is the built in protection US utility earnings enjoy from declining power demand, even amid broader energy crisis pressures facing the sector. For one thing, US power grids in California, ERCOT (Texas), MISO (Midwest), New England, New York and PJM have wholesale power markets, where producers compete for sales and the lowest bidder sets the price.

In those states, most regulated utilities don’t produce power at all. In fact, companies’ revenue is decoupled entirely from demand in California, as well as much of New England. In the roughly three-dozen states where utilities still operate as integrated monopolies, demand does affect revenue, and in many regions flat electricity demand already persists. But the cost of electricity is passed through directly to customers, whether produced or purchased.

A number of US electric companies have invested in renewable energy facilities as part of broader electrification trends nationwide. These sell their output under long-term contracts primarily with other utilities and government entities.

This isn’t a risk free business: For the past year, generators selling electricity to bankrupt PG&E Corp (PCG) have had their cash trapped at the power plant level as surety for lenders. But even PG&E has honored its contracts. And with states continuing aggressive mandates for renewable energy adoption, growth doesn’t appear at risk to COVID-19 fallout either.

The wholesale price of power from natural gas, coal and many nuclear plants was already sliding before COVID-19, due to renewables adoption and low natural gas prices, even as coal and nuclear disruptions raise reliability concerns. But here too, big producers like Exelon Corp (EXC) and Vistra Energy (VST) have employed aggressive price hedging near term, with regulated utilities and retail businesses protecting long-term health, respectively.

Bottom line: It’s early days for the COVID-19 crisis and much can still change. But so far at least, the US power industry is absorbing the blow of reduced demand, just as it’s done in previous crises.

That means future selloffs in the ongoing bear market are buying opportunities for best in class electric utilities, not a reason to sell. For top candidates, see the Conrad’s Utility Investor Portfolios and Dream Buy List in the March issue. 


Related News

View more

Sign Up for Electricity Forum’s Newsletter

Stay informed with our FREE Newsletter — get the latest news, breakthrough technologies, and expert insights, delivered straight to your inbox.

Electricity Today T&D Magazine Subscribe for FREE

Stay informed with the latest T&D policies and technologies.
  • Timely insights from industry experts
  • Practical solutions T&D engineers
  • Free access to every issue

Live Online & In-person Group Training

Advantages To Instructor-Led Training – Instructor-Led Course, Customized Training, Multiple Locations, Economical, CEU Credits, Course Discounts.

Request For Quotation

Whether you would prefer Live Online or In-Person instruction, our electrical training courses can be tailored to meet your company's specific requirements and delivered to your employees in one location or at various locations.