Initiative Ads aim to spark grid improvement

By Electricity Forum


Protective Relay Training - Basic

Our customized live online or in‑person group training can be delivered to your staff at your location.

  • Live Online
  • 12 hours Instructor-led
  • Group Training Available
Regular Price:
$699
Coupon Price:
$599
Reserve Your Seat Today
According to “Sad Socket,” it is time for Americans to plug into a new electric power system.

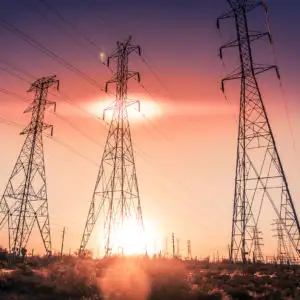
The Galvin Electricity Initiative launched the “Sad Socket” public education campaign to draw attention to the dangers and inefficiencies of the outdated U.S. electric power system and encourage policy makers and state regulators to change the way utilities do business. The ads will appear in The Wall Street Journal, The Boston Globe, the Chicago Tribune and The Washington Post. An accompanying Web site — www.galvinpower.org/socket — offers policy solutions and suggests what consumers can do to conserve electricity, save money and join the movement to renew our electricity grid.

Responding to defects in the current electricity grid, the campaign asserts seven policy priorities that will remove regulatory obstacles to modernizing the grid and create a more reliable, efficient and secure electric power system:

1) Base utility compensation on reliability, efficiency and customer service.

2) Give utilities incentives to provide customers with time-of-use rates.

3) Foster competitive free markets for electricity delivery and distribution.

4) Enable smart microgrids.

5) Require higher reliability standards for electricity distribution grids.

6) Establish new energy efficiency standards that conserve power.

7) Set-up tax codes to foster grid innovation.

“It is too costly, not to mention unsafe and entirely wasteful, to continue powering our digital economy on antiquated technology,” said Robert W. Galvin, founder of the Galvin Electricity Initiative and retired CEO and chairman of Motorola, Inc. “The technology to transform the electric power system exists right now. But until all of us demand state policies that put smart technology, cost structures based on time-of-use, plus true retail service competition into place, we’ll be stuck with the costly, inefficient dinosaur of a system we have now.”

Political will and changes in regulatory policy are necessary to facilitate these advances and transform a power system that costs U.S. businesses, public institutions and homes more than $150 billion a year in waste and power outages. While federal support for smart grid research and investment, as provided for in the Energy Independence and Security Act of 2007, is important, the “Sad Socket” campaign insists that states hold the key to motivating electricity distribution utilities to give consumers the power of choice, and to make changes that urgently modernize the grid.

“’Sad Socket’ highlights states that are making progress in grid transformation,” said Kurt Yeager, executive director of the Galvin Electricity Initiative. “We are working with change leaders, developers and universities in Massachusetts, Illinois and New Mexico to transform the quality of power delivery while collaborating with policy makers and regulators to remove outmoded policy and regulatory barriers so that everyone benefits from system renewal. Broad public understanding and support is crucial to success.”

Related News

Canadian power crews head to Irma-hit Florida to help restore service

Canadian Power Crews Aid Florida after Hurricane Irma, supporting power restoration for Tampa Electric and Florida Power & Light. Hydro One and Nova Scotia Power teams provide mutual aid to speed outage repairs across communities.


Key Points

Mutual aid effort sending Canadian utility crews to restore power and repair outages in Florida after Hurricane Irma.

✅ Hydro One and Nova Scotia Power deploy line technicians

✅ Support for Tampa Electric and Florida Power & Light

✅ Goal: rapid power restoration and outage repairs statewide


Hundreds of Canadian power crews are heading to Florida to help restore power to millions of people affected by Hurricane Irma.

Two dozen Nova Scotia Power employees were en route Tampa on Tuesday morning. An additional 175 Hydro One employees from across Ontario are also heading south. Tuesday to assist after receiving a request for assistance from Tampa Electric.

Nearly 7½ million customers across five states were without power Tuesday morning as Irma — now a tropical storm — continued inland, while a power outage update from the Carolinas underscored the regional strain.

In an update On Tuesday, Florida Power & Light said its "army" of crews had already restored power to 40 per cent of the five million customers affected by Irma in the first 24 hours.

FPL said it expects to have power restored in nearly all of the eastern half of the state by the end of this coming weekend. Almost everyone should have power restored by the end of day on Sept. 22, except for areas still under water.Jason Cochrane took a flight from Halifax Stanfield International Airport along with 19 other NSP power line technicians, two supervisors and a restoration team lead, drawing on lessons from the Maritime Link first power project between Newfoundland and Nova Scotia. "It's different infrastructure than what we have to a certain extent, so there'll be a bit of a learning curve there as well," Cochrane said. "But we'll be integrated into their workforce, so we'll be assisting them to get everything put back together."

The NSP team will join 86 other Nova Scotians from their parent company, Emera, who are also heading to Tampa. Halifax-based Emera, whose regional projects include the Maritime Link, owns a subsidiary in Tampa.

"We're going to be doing anything that we can to help Tampa Electric get their customers back online," said NSP spokesperson Tiffany Chase. "We know there's been significant damage to their system as a result of that severe storm and so anything that our team can do to assist them, we want to do down in Tampa."

Crews have been told to expect to be on the ground in the U.S. for two weeks, but that could change as they get a better idea of what they're dealing with.

'It's neat to have an opportunity like this to go to another country and to help out.'- Jason Cochrane, power line technician

"It's neat to have an opportunity like this to go to another country and to help out and to get the power back on safely," said Cochrane.

Chase said she doesn't know how much the effort will cost but it will be covered by Tampa Electric. She also said Nova Scotia Power will pull its crews back if severe weather heads toward Atlantic Canada, as utilities nationwide work to adapt to climate change in their planning.


Related News

View more

Blizzard and Extreme Cold Hit Calgary and Alberta

Calgary Winter Storm and Extreme Cold delivers heavy snowfall, ECCC warnings, blowing snow, icy roads, and dangerous wind chill across southern Alberta, as a low-pressure system and northerly inflow fuel hazardous travel and frostbite risks.


Key Points

A severe Alberta storm with heavy snow, strong winds, ECCC warnings, dangerous wind chill, and high frostbite risk.

✅ ECCC extends snowfall and winter storm warnings regionwide.

✅ Wind chill -28 to -47; frostbite possible within 5-30 minutes.

✅ AMA rescues surge; non-essential travel strongly discouraged.


Calgary and much of southern Alberta faced a significant winter storm that brought heavy snowfall, strong winds, and dangerously low temperatures. Environment and Climate Change Canada (ECCC) issued extended and expanded snowfall and winter storm warnings as persistent precipitation streamed along the southern borders. The combination of a low-pressure system off the West Coast, where a B.C. 'bomb cyclone' had left tens of thousands without power, and a northerly inflow at the surface led to significant snow accumulations in a short period.

The storm resulted in poor driving conditions across much of southern Alberta, with snow-packed and icy roads, as well as limited visibility due to blowing snow. ECCC advised postponing non-essential travel until conditions improved. As of 10 a.m. on January 17, the 511 Alberta map showed poor driving conditions throughout the region, while B.C. electricity demand hit an all-time high amid the cold.

In Calgary, the city recorded four centimeters of snow on January 16, with an additional four centimeters expected on January 17. Temperatures remained far below seasonal averages until the end of the week, and Calgary electricity use tends to surge during such cold snaps according to Enmax, with improvements starting on Sunday.

The extreme cold posed significant risks, with wind chills of -28 to -39 capable of causing frostbite in 10 to 30 minutes, as a Quebec power demand record illustrated during the deep freeze. When wind chills dropped to -40 to -47, frostbite could occur in as little as five to 10 minutes. Residents were advised to watch for signs of frostbite, including color changes on fingers and toes, pain, numbness, tingling sensations, or swelling. Those most at risk included young children, older adults, people with chronic illnesses, individuals working or exercising outdoors, and those without proper shelter.

In response to the severe weather, the Alberta Motor Association (AMA) experienced a surge in calls for roadside assistance. Between January 12 and 14, there were approximately 32,000 calls, with about 22,000 of those requiring rescues between January 12 and 14. The high volume of requests led the AMA to temporarily cease providing wait time updates on their website due to the inability to provide accurate information, while debates over Alberta electricity prices also intensified during the cold.

The storm also had broader implications across Canada. Heavy snow was expected to fall across wide swaths of southern British Columbia and parts of southern Alberta, as BC Hydro's winter payment plan offered billing relief to customers during the stretch. Northern Alberta was under extreme cold warnings, with temperatures expected to dip to -40°C through the rest of the week. Similar extreme cold was forecast for southern Ontario, with wind chill values reaching -30°C.

As the storm progressed, conditions began to improve. The wind warning for central Alberta ended by January 17, though a blowing snow advisory remained in effect for the southeast corner of the province. Northwest winds gusting up to 90 km/h combined with falling snow continued to cause poor visibility in some areas, while California power outages and landslides were reported amid concurrent severe storms along the coast. Conditions were expected to improve by mid-morning.

In the aftermath of the storm, residents were reminded of the importance of preparedness and caution during severe winter weather. Staying informed through official weather advisories, adjusting travel plans, and taking necessary precautions can help mitigate the risks associated with such extreme conditions.


Related News

View more

Electricity demand set to reduce if UK workforce self-isolates

UK Energy Networks Coronavirus Contingency outlines ESO's lockdown electricity demand forecast, reduced industrial and commercial load, rising domestic use, Ofgem guidance needs, grid resilience, control rooms, mutual aid, and backup centers.


Key Points

A coordinated plan with ESO forecasts, safeguards, and mutual aid to keep power and gas services during a lockdown.

✅ ESO forecasts lower industrial use, higher domestic demand

✅ Control rooms protected; backup sites and cross-trained staff

✅ Mutual aid and Ofgem coordination bolster grid resilience


National Grid ESO is predicting a reduction in electricity demand, consistent with residential use trends observed during the pandemic, in the case of the coronavirus spread prompting a lockdown across the country.

Its analysis shows the reduction in commercial and industrial use would outweigh an upsurge in domestic demand, mirroring Ontario demand data seen as people stayed home, according to similar analyses.

The prediction was included in an update from the Energy Networks Association (ENA), in which it sought to reassure the public that contingency plans are in place, reflecting utility disaster planning across electric and gas networks, to ensure services are unaffected by the coronavirus spread.

The body, which represents the UK's electricity and gas network companies, said "robust measures" had been put in place to protect control rooms and contact centres, similar to staff lockdown protocols considered by other system operators, to maintain resilience. To provide additional resilience, engineers have been trained across multiple disciplines and backup centres exist should operations need to be moved if, for example, deep cleaning is required, the ENA said.

Networks also have industry-wide mutual aid arrangements, similar to grid response measures outlined in the U.S., for people and the equipment needed to keep gas and electricity flowing.

ENA chief executive, David Smith, said, echoing system reliability assurances from other markets: "The UK's electricity and gas network is one of the most reliable in the world and network operators are working with the authorities to ensure that their contingency plans are reviewed and delivered in accordance with the latest expert advice. We are following this advice closely and reassuring customers that energy networks are continuing to operate as normal for the public."

Utility Week spoke to a senior figure at one of the networks who reiterated the robust measures in place to keep the lights on, even as grid alerts elsewhere highlight the importance of contingency planning. However, they pleaded for more clarity from Ofgem and government on how its workers will be treated if the coronavirus spread becomes a pandemic in the UK.


Related News

View more

Solar + Wind = 10% of US Electricity Generation in 1st Half of 2018

US Electricity Generation H1 2018 saw wind and solar gains but hydro declines, as natural gas led the grid mix and coal fell; renewables' share, GWh, emissions, and capacity additions shaped the power sector.


Key Points

It is the H1 2018 US power mix, where natural gas led, coal declined, and wind and solar grew while hydro fell.

✅ Natural gas reached 32% of generation, highest share

✅ Coal fell; renewables roughly tied nuclear at ~20%

✅ Wind and solar up; hydro output down vs 2017


To complement our revival of US electricity capacity reports, here’s a revival of our reports on US electricity generation.

As with the fresh new capacity report, things are not looking too bright when it comes to electricity generation. There’s still a lot of grey — in the bar charts below, in the skies near fossil fuel power plants, and in the human and planetary outlook based on how slowly we are cutting fossil fuel electricity generation.

As you can see in the charts above, wind and solar energy generation increased notably from the first half of 2017 to the first half of 2018, and the EIA expected larger summer solar and wind generation in subsequent months, reinforcing that momentum.

A large positive when it comes to the environment and human health is that coal generation dropped a great deal year over year — by even more than renewables increased, though the EIA later noted an increase in coal-fired generation in a subsequent year, complicating the trend. However, on the down side, natural gas soared as it became the #1 source of electricity generation in the United States (32% of US electricity). Furthermore, coal was still solidly in the #2 position (27% of US electricity). Renewables and nuclear were essentially in a tie at 19.8% of generation, with renewables just a tad above nuclear.

Actually, combined with an increase in nuclear power generation, natural gas electricity production increased so much that the renewable energy share of electricity generation actually dropped in the first half of 2018 versus the first half of 2017, even amid declining electricity use in some periods. It was 19.8% this year and 20% last year.

Again, solar and wind saw a significant growth in its market share, from 9% to 9.9%, but hydro brought the whole category down due to a decrease from 9% to 8%.

The visuals above are probably the best way to examine it all. The H1 2018 chart was still dominated by fossil fuels, which together accounted for approximately 60% of electricity generation, even though by 2021 non-fossil sources supplied about 40% of U.S. electricity, highlighting the longer-term shift. In H1 2017, the figure was 59.7%. Furthermore, if you switch to the “Change H1 2018 vs H1 2017 (GWh)” chart, you can watch a giant grey bar representing natural gas take over the top of the chart. It almost looks like it’s part of the border of the chart. The biggest glimmer of positivity in that chart is seeing the decline in coal at the bottom.

What will the second half of the year bring? Well, the gigantic US electricity generation market shifts slowly, even as monthly figures can swing, as January generation jumped 9.3% year over year according to the EIA, reminding us about volatility. There is so much base capacity, and power plants last so long, that it takes a special kind of magic to create a rapid transition to renewable energy. As you know from reading this quarter’s US renewable energy capacity report, only 43% of new US power capacity in the first half of the year was from renewables. The majority of it was from natural gas. Along with other portions of the calculation, that means that electricity generation from natural gas is likely to increase more than electricity generation from renewables.

Jump into the numbers below and let us know if you have any more thoughts.


Related News

View more

Gaza’s sole electricity plant shuts down after running out of fuel

Gaza Power Plant Shutdown underscores the Gaza Strip's fuel ban, Israeli blockade, and electricity crisis, cutting megawatts, disrupting hospitals and quarantine centers, and exposing fragile energy supply, GEDCO warnings, and public health risks.


Key Points

An abrupt halt of Gaza's sole power plant due to a fuel ban, deepening the electricity crisis and straining hospitals.

✅ Israeli fuel ban halts Gaza's only power plant

✅ Available supply drops far below 500 MW demand

✅ Hospitals and COVID-19 quarantine centers at risk


The only electricity plant in the Gaza Strip shut down yesterday after running out of fuel banned from entering the besieged enclave by the Israeli occupation, Gaza Electricity Distribution Company announced.

“The power plant has shut down completely,” the company said in a brief statement, as disruptions like China power cuts reveal broader grid vulnerabilities.

Israel banned fuel imports into Gaza as part of punitive measures over the launching incendiary balloons from the Strip.

On Sunday, GEDCO warned that the industrial fuel for the electricity plant would run out, mirroring Lebanon's fuel shortage challenges, on Tuesday morning.

Since 2007, the Gaza Strip suffered under a crippling Israeli blockade that has deprived its roughly two million inhabitants of many vital commodities, including food, fuel and medicine, and regional strains such as Iraq's summer electricity needs highlight broader power insecurity.

As a result, the coastal enclave has been reeling from an electricity crisis, similar to when the National Grid warned of short supply in other contexts.

The Gaza Strip needs some 500 megawatts of electricity – of which only 180 megawatts are currently available – to meet the needs of its population, while Iran supplies about 40% of Iraq's electricity in the region.

Spokesman of the Ministry of Health in Gaza, Ashraf Al Qidra, said the lack of electricity undermines offering health services across Gaza’s hospitals.

He also warned that the lack of electricity would affect the quarantine centres used for coronavirus patients, reinforcing the need to keep electricity options open during the pandemic.

Gaza currently has three sources of electricity: Israel, which provides 120 megawatts and is advancing coal use reduction measures; Egypt, which supplies 32 megawatts; and the Strip’s sole power plant, which generates between 40 and 60 megawatts.


Related News

View more

Learn how fees and usage impacts your electricity bill in new online CER tool

CER Interactive Electricity Bill Tool compares provincial electricity prices, fees, taxes, and usage. Explore household appliance costs, hydroelectric generation, and consumption trends across Canada with interactive calculators and a province-by-province breakdown.


Key Points

An online CER report with calculators comparing electricity prices, fees, and usage to explain household energy costs.

✅ Province-by-province bill, price, and consumption comparison

✅ Calculator for appliance and electronics energy costs

✅ Explains fees, taxes, regulation, and generation sources


Canadians have a new way to assess their electricity bill in a new, interactive online report released by the Canada Energy Regulator (CER).

The report titled What is in a residential electricity bill? features a province-to-province comparison of electricity bills, generation and consumption. It also explains electricity prices across the country, including how Calgary electricity prices have changed, allowing people to understand why costs vary depending on location, fees, regulation and taxes.  

Learn how fees and usage impacts your electricity bill in new online CER tool
Interactive tools allow people to calculate the cost of household appliances and electronic use for each province and territory, and to understand how Ontario rate increases may affect monthly bills. For example, an individual can use the tools to find out that leaving a TV on for 24-hours in Quebec costs $5.25 per month, while that same TV on for a whole day would cost $12.29 per month in Saskatchewan, $20.49 per month in the Northwest Territories, and $15.30 per month in Nova Scotia.

How Canadians use energy varies as much as how provinces and territories produce it, especially in regions like Nunavut where unique conditions influence costs. Millions of Canadians rely on electricity to power their household appliances, charge their electronics, and heat their homes. Provinces with abundant hydro-electric resources like Quebec, B.C., Manitoba, and Newfoundland and Labrador use electricity for home heating and tend to consume the most electricity.

By gathering data from various sources, this report is the first Canadian publication that features interactive tools to allow for a province-by-province comparison of electricity bills while highlighting different elements within an electricity bill, a helpful context as Canada faces a critical supply crunch in the years ahead.

The CER monitors energy markets and assesses Canadian energy requirements and trends, including clean electricity regulations developments that shape pricing. This report is part of a portfolio of publications on energy supply, demand and infrastructure that the CER publishes regularly as part of its ongoing market monitoring.

"No matter where you go in the country, Canadians want to know how much they pay for power and why, especially amid price spikes in Alberta this year," says lead author Colette Craig. "This innovative, interactive report really explains electricity bills to help everyone understand electricity pricing and consumption across Canada."

Quick Facts

  • Quebec ranks first in electricity consumption per capita at 21.0 MW.h, followed by Saskatchewan at 20.0 MW.h, Newfoundland and Labrador at 19.3 MW.h.
  • About 95% of Quebec's electricity is produced from hydroelectricity.
  • Provinces that use electricity for home heating tend to consume the most electricity.
  • Canada's largest consuming sector for electricity was industrial at 238 TW.h. The residential and commercial sectors consumed 168 TW.h and 126 TW.h, respectively.
  • In 2018, Canada produced 647.7 terawatt hours (TW.h) of electricity. More than half of the electricity in Canada (61%) is generated from hydro sources. The remainder is produced from a variety of sources, such as fossil fuels (natural gas and petroleum), nuclear, wind, coal, biomass, solar.
  • Canada is a net exporter of electricity. In 2019, net exports to the U.S. electricity market totaled 47.0 TW.h.
  • The total value of Canada's electricity exports was $2.5 billion Canadian dollars and the value of imports was $0.6 billion Canadian dollars, resulting in 2019 net exports of $1.9 billion.
  • All regions in Canada are reflected in this report but it does not include data that reflects the COVID-19 lockdown and its effects on residential electricity bills.


Related News

View more

Sign Up for Electricity Forum’s Newsletter

Stay informed with our FREE Newsletter — get the latest news, breakthrough technologies, and expert insights, delivered straight to your inbox.

Electricity Today T&D Magazine Subscribe for FREE

Stay informed with the latest T&D policies and technologies.
  • Timely insights from industry experts
  • Practical solutions T&D engineers
  • Free access to every issue

Download the 2025 Electrical Training Catalog

Explore 50+ live, expert-led electrical training courses –

  • Interactive
  • Flexible
  • CEU-cerified