Nuclear power plant: Tax bill is too much

By Newburyport News


CSA Z462 Arc Flash Training - Electrical Safety Essentials

Our customized live online or in‑person group training can be delivered to your staff at your location.

  • Live Online
  • 6 hours Instructor-led
  • Group Training Available
Regular Price:
$249
Coupon Price:
$199
Reserve Your Seat Today
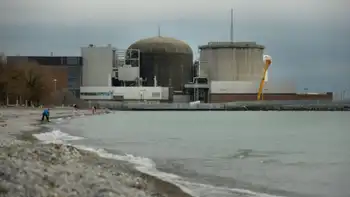
The Seabrook Station nuclear plant pays almost half of the property taxes in town, but the company that owns the plant is arguing that its $15.3 million tax bill is simply way too much.

Florida Power and Light, the company that owns the major portion of the Seabrook nuclear power plant, recently filed an abatement appeal with selectmen over the new taxable value of its facility.

According to Seabrook Town Manager Barry Brenner, the town received Florida Power and Light's appeal of the town's new $1.65 billion assessment of the plant, making the deadline for such abatement appeals. The prior agreed-upon worth of the plant was $1.043 billion, meaning the new value represents an increase of $607 million.

"March 1 was the deadline for all assessment appeals," Brenner said. "It's the same deadline for any property owner who wants to appeal the assessed value of their property. All property owners have the right to file an appeal on tax assessments."

Brenner said Florida Power and Light had to file the appeal to keep its options open or lose the right to appeal.

Of the appeal, power plant spokesman Alan Griffith said, "FPL Energy Seabrook Station has always been committed to being a good neighbor and paying our fair share of property taxes. Since the town rejected (our) most recent settlement offer, we withdrew that offer and have filed the abatement appeal to preserve our rights in this process. We look forward to continuing the professional and respectful negotiations with the town, and we are hopeful that we can reach an amicable solution on the valuation of Seabrook Station."

In today's market, the nuclear plant's value is about half of what it was at its zenith. For example, according to Seabrook Tax Collector Lillian Knowles, in 1986, the plant's total taxable value was about $3.060 billion, or 94 percent of the town's total tax base. Owned mostly by Public Service of New Hampshire at the time, the plant paid Seabrook more than $19 million in taxes in 1986.

In 2007, with a worth of $1.043 billion, the plant represented about 38 percent of the town's tax base, with its consortium of owners paying $10.9 million in taxes, she said.

The newly assessed 2008 value of $1.65 billion represents about 48 percent of the town's tax base, Knowles said, with tax payments of $15,377,761 unless the worth is lowered in the future through the appeal.

Seabrook officials and the owners of FPL Energy Seabrook Power Station have been in negotiations to reach an agreement on the plant's 2008 worth since early last year, Brenner said, but no signed agreement resulted by April 1. However, to set the tax rate on time, all property in town had to be assessed at its "full and fair value" as of April 1, 2008, in order for tax bills to be mailed out on time in December.

As a result, after considerable research, Seabrook Assessor Angela Silva placed a value on the plant as of April 1, 2008, in conjunction with advice from the town's utility appraisal consultant Glenn Walker, Brenner said. Since the cost of energy had risen considerably as of April 2008, the value of the plant rose sharply as well.

According to information released by Robert Ciandella, the attorney Seabrook employs on utility issues, to establish the value of the plant, the town and its consultant looked at a number of measurements. One factor was the high electric prices that existed in the early part of 2008, which were at $90 per megawatt hour.

Although electric prices have dropped since then to $70 per megawatt hour, New Hampshire law requires Seabrook to asses the plant based on full and fair value as of April 1, 2008, and the energy market conditions existing at the time. Given the energy market in April of 2008, the town is "confident" its calculations are correct, Ciandella said.

Seabrook and the owners of the power plant had haggled over the worth of the plant for more than a decade after the plant was finished, even ending up in court occasionally. But since 1998, in hopes of ending costly legal disputes, Seabrook and the plant's owners have reached agreements on its worth through negotiations. A number of multiyear tax agreements have been reached in that fashion, the last covered the plant's value for 2006 and 2007.

According to Brenner, FPL's appeal of the new valuation isn't putting a halt to the current negotiations, and the town hopes a new multiyear agreement will be forthcoming.

"We're continuing to negotiate to reach an agreement (on the plant's worth)," Brenner said. "But Florida Power and Light had to file the appeal by the deadline or not be able to appeal at all."

Related News

Solar Plus Battery Storage Cheaper Than Conventional Power in Germany

Germany Solar-Plus-Storage Cost Parity signals grid parity as solar power with battery storage undercuts conventional electricity. Falling LCOE, policy incentives, and economies of scale accelerate the energy transition and decarbonization across Germany's power market.


Key Points

The point at which solar power with battery storage is cheaper than conventional grid electricity across Germany.

✅ Lower LCOE from tech advances and economies of scale

✅ EEG incentives and streamlined installs cut total costs

✅ Enhances energy security, reduces fossil fuel dependence


Germany, a global leader in renewable energy adoption, with clean energy supplying about half of its electricity in recent years, has reached a significant milestone: the cost of solar power combined with battery storage has now fallen below that of conventional electricity sources. This development marks a transformative shift in the energy landscape, showcasing the increasing affordability and competitiveness of renewable energy technologies and reinforcing Germany’s position as a pioneer in the transition to sustainable energy.

The decline in costs for solar power paired with battery storage represents a breakthrough in Germany’s energy sector, especially amid the recent solar power boost during the energy crisis, where the transition from traditional fossil fuels to cleaner alternatives has been a central focus. Historically, conventional power sources such as coal, natural gas, and nuclear energy have dominated electricity markets due to their established infrastructure and relatively stable pricing. However, the rapid advancements in solar technology and energy storage solutions are altering this dynamic, making renewable energy not only environmentally preferable but also economically advantageous.

Several factors contribute to the cost reduction of solar power with battery storage:

  1. Technological Advancements: The technology behind solar panels and battery storage systems has evolved significantly over recent years. Solar panel efficiency has improved, allowing for greater energy generation from smaller installations. Similarly, cheaper batteries have advanced, with reductions in cost and increases in energy density and lifespan. These improvements mean that solar installations can produce more electricity and store it more effectively, enhancing their economic viability.

  2. Economies of Scale: As demand for solar and battery storage systems has grown, manufacturers have scaled up production, leading to economies of scale. This scaling has driven down the cost of both solar panels and batteries, making them more affordable for consumers. As the market for these technologies expands, prices are expected to continue decreasing, further enhancing their competitiveness.

  3. Government Incentives and Policies: Germany’s commitment to renewable energy has been supported by robust government policies and incentives. The country’s Renewable Energy Sources Act (EEG) and other supportive measures, alongside efforts to remove barriers to PV in Berlin that could accelerate adoption, have provided financial incentives for the adoption of solar power and battery storage. These policies have encouraged investment in renewable technologies and facilitated their integration into the energy market, contributing to the overall reduction in costs.

  4. Falling Installation Costs: The cost of installing solar power systems and battery storage has decreased as the industry has matured. Advances in installation techniques, increased competition among service providers, and streamlined permitting processes have all contributed to lower installation costs. This reduction in upfront expenses has made solar with battery storage more accessible and financially attractive to both residential and commercial consumers.

The economic benefits of solar power with battery storage becoming cheaper than conventional power are substantial. For consumers, this shift translates into lower electricity bills and reduced reliance on fossil fuels. Solar installations with battery storage allow households and businesses to generate their own electricity, store it for use during times of low sunlight, and even sell excess power back to the grid, reflecting how solar is reshaping electricity prices in Northern Europe as markets adapt. This self-sufficiency reduces exposure to fluctuating energy prices and enhances energy security.

For the broader energy market, the decreasing cost of solar power with battery storage challenges the dominance of conventional power sources. As renewable energy becomes more cost-effective, it creates pressure on traditional energy providers to adapt and invest in cleaner technologies, including responses to instances of negative electricity prices during renewable surpluses. This shift can accelerate the transition to a low-carbon energy system and contribute to the reduction of greenhouse gas emissions.

Germany’s achievement also has implications for global energy markets. The country’s success in making solar with battery storage cheaper than conventional power serves as a model for other nations pursuing similar energy transitions. As the cost of renewable technologies continues to decline, other countries can leverage these advancements to enhance their own energy systems, reduce carbon emissions, and achieve energy independence amid over 30% of global electricity now from renewables trends worldwide.

The impact of this development extends beyond economics. It represents a significant step forward in addressing climate change and promoting sustainability. By reducing the cost of renewable energy technologies, Germany is accelerating the shift towards a cleaner and more resilient energy system. This progress aligns with the country’s ambitious climate goals and reinforces its role as a leader in global efforts to combat climate change.

Looking ahead, several challenges remain. The integration of renewable energy into existing energy infrastructure, grid stability, and the management of energy storage are all areas that require continued innovation and investment. However, the decreasing cost of solar power with battery storage provides a strong foundation for addressing these challenges and advancing the transition to a sustainable energy future.

In conclusion, the fact that solar power with battery storage in Germany has become cheaper than conventional power is a groundbreaking development with wide-ranging implications. It underscores the technological advancements, economic benefits, and environmental gains associated with renewable energy technologies. As Germany continues to lead the way in clean energy adoption, this achievement highlights the potential for renewable energy to drive global change and reshape the future of energy.


Related News

View more

Is nuclear power really in decline?

Nuclear Energy Growth accelerates as nations pursue decarbonization, complement renewables, displace coal, and ensure grid reliability with firm, low-carbon baseload, benefiting from standardized builds, lower cost of capital, and learning-curve cost reductions.


Key Points

Expansion of nuclear capacity to cut CO2, complement renewables, replace coal, and stabilize grids at low-carbon cost.

✅ Complements renewables; displaces coal for faster decarbonization

✅ Cuts system costs via standardization and lower cost of capital

✅ Provides firm, low-carbon baseload and grid reliability


By Kirill Komarov, Chairman, World Nuclear Association.

As Europe and the wider world begins to wake up to the need to cut emissions, Dr Kirill Komarov argues that tackling climate change will see the use of nuclear energy grow in the coming years, not as a competitor to renewables but as a competitor to coal.

The nuclear industry keeps making headlines and spurring debates on energy policy, including the green industrial revolution agenda in several countries. With each new build project, the detractors of nuclear power crowd the bandwagon to portray renewables as an easy and cheap alternative to ‘increasingly costly’ nuclear: if solar and wind are virtually free why bother splitting atoms?

Yet, paradoxically as it may seem, if we are serious about policy response to climate change, nuclear energy is seeing an atomic energy resurgence in the coming decade or two.

Growth has already started to pick up with about 3.1 GW new capacity added in the first half of 2018 in Russia and China while, at the very least, 4GW more to be completed by the end of the year – more than doubling the capacity additions in 2017.

In 2019 new connections to the grid would exceed 10GW by a significant margin.

If nuclear is in decline, why then do China, India, Russia and other countries keep building nuclear power plants?

To begin with, the issue of cost, argued by those opposed to nuclear, is in fact largely a bogus one, which does not make a fully rounded like for like comparison.

It is true that the latest generation reactors, especially those under construction in the US and Western Europe, have encountered significant construction delays and cost overruns.

But the main, and often the only, reason for that is the ‘first-of-a-kind’ nature of those projects.

If you build something for the first time, be it nuclear, wind or solar, it is expensive. Experience shows that with series build, standardised construction economies of scale and the learning curve from multiple projects, costs come down by around one-third; and this is exactly what is already happening in some parts of the world.

Furthermore, those first-of-a-kind projects were forced to be financed 100% privately and investors had to bear all political risks. It sent the cost of capital soaring, increasing at one stroke the final electricity price by about one third.

While, according to the International Energy Agency, at 3% cost of capital rate, nuclear is the cheapest source of energy: on average 1% increase adds about US$6-7 per MWh to the final price.

When it comes to solar and wind, the truth, inconvenient for those cherishing the fantasy of a world relying 100% on renewables, is that the ‘plummeting prices’ (which, by the way, haven’t changed much over the last three years, reaching a plateau) do not factor in so-called system and balancing costs associated with the need to smooth the intermittency of renewables.

Put simply, the fact the sun doesn’t shine at night and wind doesn’t blow all the time means wind and solar generation needs to be backed up.

According to a study by the Potsdam Institute for Climate Impact Research, integration of intermittent renewables into the grid is estimated in some cases to be as expensive as power generation itself.

Delivering the highest possible renewable content means customers’ bills will have to cover: renewable generation costs, energy storage solutions, major grid updates and interconnections investment, as well as gas or coal peaking power plants or ‘peakers’, which work only from time to time when needed to back up wind and solar.

The expected cost for kWh for peakers, according to investment bank Lazard is about twice that of conventional power plants due to much lower capacity factors.

Despite exceptionally low fossil fuel prices, peaking natural gas generation had an eye-watering cost of $156-210 per MWh in 2017 while electricity storage, replacing ‘peakers’, would imply an extra cost of $186-413 per MWh.

Burning fossil fuels is cheaper but comes with a great deal of environmental concern and extensive use of coal would make net-zero emissions targets all but unattainable.

So, contrary to some claims, nuclear does not compete with renewables. Moreover, a recent study by the MIT Energy Initiative showed, most convincingly, that renewables and load following advanced nuclear are complementary.

Nuclear competes with coal. Phasing out coal is crucial to fighting climate change. Putting off decisions to build new nuclear capacities while increasing the share of intermittent renewables makes coal indispensable and extends its life.

Scientists at the Brattle group, a consultancy, argue that “since CO2 emissions persist for many years in the atmosphere, near-term emission reductions are more helpful for climate protection than later ones”.

The longer we hesitate with new nuclear build the more difficult it becomes to save the Earth.

Nuclear power accounta for about one-tenth of global electricity production, but as much as one-third of generation from low-carbon sources. 1GWe of installed nuclear capacity prevents emissions of 4-7 million metric tons of CO2 emissions per year, depending on the region.

The International Energy Agency (IEA) estimates that in order to limit the average global temperature increase to 2°C and still meet global power demand, we need to connect to the grid at least 20GW of new nuclear energy each year.

The World Nuclear Association (WNA) sets the target even higher with the total of 1,000 GWe by 2050, or about 10 GWe per year before 2020; 25 GWe per year from 2021 to 2025; and on average 33 GWe from 2026 to 2050.

Regulatory and political challenges in the West have made life for nuclear businesses in the US and in Europe's nuclear sector very difficult, driving many of them to the edge of insolvency; but in the rest of the world nuclear energy is thriving.

Nuclear vendors and utilities post healthy profits and invest heavily in next-gen nuclear innovation and expansion. The BRICS countries are leading the way, taking over the initiative in the global climate agenda. From their perspective, it’s the opposite of decline.

Dr Kirill Komarov is first deputy CEO of Russian state nuclear energy operator Rosatom and chairman of the World Nuclear Association.


Related News

View more

Parsing Ontario's electricity cost allocation

Ontario Global Adjustment and ICI balance hydro rates, renewable cost shift, and peak demand. Class A and Class B customers face demand response decisions amid pandemic occupancy uncertainty and volatile GA charges through 2022.


Key Points

A pricing model where GA costs and ICI peak allocation shape Class A/B bills, driven by renewables cost shifts.

✅ Renewable cost shift trims GA; larger Class A savings expected.

✅ Class A peak strategy returns; occupancy uncertainty persists.

✅ Class B faces volatile GA; limited levers beyond efficiency.


Ontario’s large commercial electricity customers can approach the looming annual decision about their billing structure for the 12 months beginning July 1 with the assurance of long-term relief on a portion of their costs, amid changes coming for electricity consumers that could affect planning. That’s to be weighed against uncertainties around energy demand and whether a locked-in cost allocation formula that looked favourable in pre-pandemic times will remain so until June 30, 2022.

“The biggest unknown is we just don’t know when the people are coming back,” Jon Douglas, director of sustainability with Menkes Property Management Services, reflected during a webinar sponsored by the Building Owners and Managers Association (BOMA) of Greater Toronto last week. “The occupancy in our office buildings this fall, and going into the new year, could really impact the outcome of the decision.”

After a year of operational upheaval and more modifications to provincial electricity pricing policies, BOMA Toronto’s regularly scheduled workshop ahead of the June 15 deadline for eligible customers to opt into the Industrial Conservation Initiative (ICI) program had a lot of ground to cover. Notably, beginning in January, all commercial customers have seen a reduction in the global adjustment (GA) component of their monthly hydro bills after the Ontario government shifted costs associated with contracted non-hydroelectric renewable supply to reduce the burden on industrial ratepayers from electricity rates to the general provincial account — a move that trims approximately $258 million per month from the total GA charged to industrial and commercial customers. However, they won’t garner the full benefit of that until 2022 since they’re currently repaying about $333 million in GA costs that were deferred in April, May and June of 2020.

Renewable cost shift pares the global adjustment
For now, Ontario government officials estimate the renewable cost shift equates to a 12 per cent discount relative to 2020 prices, even as typical bills may rise about 2% as fixed pricing ends in some cases. Once last year’s GA deferral is repaid at the end of 2021, they project the average Class A customer participating in the ICI program should realize a 16 per cent saving on the total hydro bill, while Class B customers paying the GA on a volumetric per kilowatt-hour (kWh) basis will see a slightly more moderate 15 per cent decrease.

“This is the biggest change to electricity pricing that’s happened since the introduction of ICI,” Tim Christie, director of electricity policy, economics and system planning for Ontario’s Ministry of Energy, Northern Development and Mines, told online workshop attendees. “The government is funding the out-of-market costs of renewables. It does tail off into the 2030s as those contracts (for wind, solar and biomass generation) expire, but over the next eight-ish years, it’s pretty steady at around just over $3 billion per year.”

Extrapolating from 2020 costs, he pegged average electricity costs at roughly 9.1 cents/kWh for Class A commercial customers and 13.2 cents/kWh for Class B, a point of concern for Ontario manufacturers facing high rates as well. However, energy management specialists suggest actual 2021 numbers haven’t proved that out.

“In commercial buildings, we’re averaging 10 to 12 cents for Class A in 2021, and we’re seeing more than that for about 14, 15 cents for Class B,” reported Scott Rouse, managing partner with the consulting firm, Energy@Work.

GA costs for Class B customers dropped nearly 30 per cent in the first four months of 2021 compared to the last four months of 2020, when they averaged 11.8 cents/kWh. Thus far, though, there have been significant month-to-month fluctuations, with a low of 5.04 cents/kWh in February and a high of 10.9 cents/kWh in April contributing to the four-month average of 8.3 cents/kWh.

“In 2020, system-wide GA very often averaged more than $1 billion per month,” Rouse said. “This February it dropped to $500 million, which was really quite surprising. So it is a very volatile cost.”

Although welcome, the renewable cost shift does alter the payback on energy-saving investments, particularly for demand response mechanisms like energy storage. When combined with pandemic-related uncertainty and a series of policy and program reversals alongside calls to clean up Ontario’s hydro policy in recent years, the industry’s appetite for some more capital-intensive technologies appears to be flagging.

“Volatility puts a pause on some of the innovation,” said Terry Flynn, general manager with BentallGreenOak and chair of BOMA Toronto’s energy committee. “It could be a leading edge, but it might be a bleeding edge that won’t bear any fruit because the way the commodity costs are structured will change.”

“There’s kind of a wait-and-see approach on some of these bigger investments,” Douglas concurred.

Industrial Conservation Initiative underpins commercial class divide
Turning to the ICI, Class A customers — defined as those with average monthly energy demand of at least 1 megawatt (MW) — encountered some unexpected changes to the program rules during 2020. Meanwhile, Class B customers — encompassing the vast share of commercial properties smaller than about 350,000 square feet — confront the persistent reality of electricity cost allocation that offloads the burden from larger players onto them.

Through the ICI, participating Class A customers pay a share of the global adjustment that’s prorated to their energy use during the five hours of the period from May 1 to April 30 when the highest overall system demand is recorded. This gives Class A customers the opportunity to lock in a favourable factor for calculating their share of monthly system-wide global adjustment costs if they can successful project and curtail energy loads during those five hours of peak demand. On the flipside, Class B customers pay the remainder of those system-wide costs, on a straightforward per-kWh basis, once Class A payments have been reconciled.

“Class B has sometimes been regarded as the forgotten middle child of the customer classes in Ontario where all the shifted costs in the system kind of pile up,” acknowledged Mark Olsheski, vice president, energy and environment, with Sussex Strategy Group. “Likewise, there can be big unpredictable and uncontrollable swings in the global adjustment rate from month to month and, outside of pure energy efficiency, there really is precious little opportunity or empowerment for a Class B customer to take actions to lower their bills.”

Nevertheless, COVID-19 presents a few extra hiccups for Class A customers this year. Conventionally, late May is when they receive notification of the cost allocation factor that would be used to determine their GA for the upcoming July 1 to June 30 period. This year, though, all current ICI participants will retain the factor they secured by responding to the five hours of peak demand during the 12 months from May 1, 2019 to April 30, 2020 after the Ontario government placed a temporary halt on the peak demand response aspect of the program last summer. Regardless, eligible ICI participants must formally opt into the program by June 15 or they will be billed as Class B customers.

Peak chasing resumes for summer 2021
Since peak demand hours conventionally occur from June to September, Class A customers will once again be studying forecasts intently and preparing to respond via Peak Perks as the heat wave season sets in. That should help alleviate some of the system stresses that arose last summer — prompting policy-makers to reject lobbying for a continued pause on peak demand response.

“The policy rationale was to allow consumers to focus on their operations when recovering from COVID as opposed to reducing peaks. The other issue was that we did not expect the peaks to be high last summer given COVID shutdowns,” Christie recounted. “But due to some hot weather, more people at home and also the lack of ICI response, we saw peaks we haven’t seen in many, many years come up last summer. So the peak hiatus has ended and this summer we’ll be back to responding to ICI as per normal.”

Among Class A customers, owners/managers of office and retail facilities generally have the most to lose from a billing formula tied to the energy demand of more densely occupied buildings in the summer of 2019. However, they could be much more competitively positioned for 2022-23 if their buildings remain below full occupancy and energy demand stays lower than usual this summer.

“Where we can improve is the IESO (Independent Electricity System Operator) and the LDCs (local distribution companies) need to help customers get their real-time data, especially in light of the phantom demand issue, interpret their bills and their Class A versus B scenarios much more easily and comprehensively,” urged Lee Hodgkinson, vice president, technical services, sustainability and ESG, with Dream Unlimited. “ I look for APIs (application programming interface) and direct data flow from the LDCs to the building owners so that we can access that data really easily.”

Given Class A’s historic advantages, few eligible ICI participants are expected to migrate out to Class B. From a sustainability perspective, there’s perhaps more cause to question how the ICI’s 1-MW threshold encourages strategies to move in the other direction.

“You could jack up demand in some buildings and get them into Class A basically by firing up the chillers on the weekend and then pouring cooling outside to get rid of it,” Douglas noted. “That has nothing to do with climate change strategy or sustainability, but it’s a cost- saving strategy, and, sometimes, when you look at the math, it’s hundreds of thousands of dollars you can save.”

Brian Hewson, vice president, consumer protection and industry performance with the Ontario Energy Board (OEB), confirmed the OEB is currently scrutinizing the discrepancy that leaves Class B as the only consumer group with no flexibility to curtail energy load during higher-priced periods, and will be providing advice to the Ministry of Energy. In the interim, that status does, at least, simplify tactics.

“Just reduce your kWh and it doesn’t matter what time of day because you’re paying that fixed rate for 24 hours a day. So if you can curb your demand at night, you get a big bang for your dollar,” Rouse advised.

“We do talk about rates a lot, but if you’re not using it, you’re not paying for it,” Flynn agreed. “A lot of our focus is still on really to try to reduce the number of kilowatts that we use. That seems to be the best thing to do.”


Related News

View more

Annual U.S. coal-fired electricity generation will increase for the first time since 2014

U.S. coal-fired generation 2021 rose as higher natural gas prices, stable coal costs, and a recovering power sector shifted the generation mix; capacity factors rebounded despite low coal stocks and ongoing plant retirements.


Key Points

Coal output rose 22% on high gas prices and higher capacity factors; a 5% decline is expected in 2022.

✅ Natural gas delivered cost averaged $4.93/MMBtu, more than double 2020

✅ Coal capacity factor rose to ~51% from 40% in 2020

✅ 2022 coal generation forecast to fall about 5%


We expect 22% more U.S. coal-fired generation in 2021 than in 2020, according to our latest Short-Term Energy Outlook (STEO). The U.S. electric power sector has been generating more electricity from coal-fired power plants this year as a result of significantly higher natural gas prices and relatively stable coal prices, even as non-fossil sources reached 40% of total generation. This year, 2021, will yield the first year-over-year increase in coal generation in the United States since 2014, highlighted by a January power generation jump earlier in the year.

Coal and natural gas have been the two largest sources of electricity generation in the United States. In many areas of the country, these two fuels compete to supply electricity based on their relative costs and sensitivity to policies and gas prices as well. U.S. natural gas prices have been more volatile than coal prices, so the cost of natural gas often determines the relative share of generation provided by natural gas and coal.

Because natural gas-fired power plants convert fuel to electricity more efficiently than coal-fired plants, record natural gas generation has at times underscored that advantage, and natural gas-fired generation can have an economic advantage even if natural gas prices are slightly higher than coal prices. Between 2015 and 2020, the cost of natural gas delivered to electric generators remained relatively low and stable. This year, however, natural gas prices have been much higher than in recent years. The year-to-date delivered cost of natural gas to U.S. power plants has averaged $4.93 per million British thermal units (Btu), more than double last year’s price.

The overall decline in electricity demand in 2020 and record-low natural gas prices led coal plants to significantly reduce the percentage of time that they generated power. In 2020, the utilization rate (known as the capacity factor) of U.S. coal-fired generators averaged 40%. Before 2010, coal capacity factors routinely averaged 70% or more. This year’s higher natural gas prices have increased the average coal capacity factor to about 51%, which is almost the 2018 average, a year when wind and solar reached 10% nationally.

Although rising natural gas prices have resulted in more U.S. coal-fired generation than last year, this increase in coal generation will most likely not continue as solar and wind expand in the generation mix. The electric power sector has retired about 30% of its generating capacity at coal plants since 2010, and no new coal-fired capacity has come online in the United States since 2013. In addition, coal stocks at U.S. power plants are relatively low, and production at operating coal mines has not been increasing as rapidly as the recent increase in coal demand. For 2022, we forecast that U.S. coal-fired generation will decline about 5% in response to continuing retirements of generating capacity at coal power plants and slightly lower natural gas prices.


Related News

View more

What 2018 Grid Edge Trends Reveal About 2019

2019 Grid Edge Trends highlight evolving demand response, DER orchestration, real-time operations, AMI data, and EV charging, as wholesale markets seek flexibility and resiliency amid tighter reserve margins and fossil baseload retirements.


Key Points

Shifts toward DER-enabled demand response and real-time, behind-the-meter flexibility.

✅ Real-time DER dispatch enhances reliability during tight reserves

✅ AMI and ICT improve forecasting, monitoring, and control of resources

✅ Demand response shifts toward aggregated behind-the-meter orchestration


Which grid edge trends will continue into 2019 as the digital grid matures and what kind of disruption is on the horizon in the coming year?

From advanced metering infrastructure endpoints to electric-vehicle chargers, grid edge venture capital investments to demand response events, hundreds of data points go into tracking new trends at the edge of the grid amid ongoing grid modernization discussions across utilities.

Trends across these variables tell a story of transition, but perhaps not yet transformation. Customers hold more power than ever before in 2019, with utilities and vendors innovating to take advantage of new opportunities behind the meter. Meanwhile, external factors can always throw things off-course, including the data center boom that is posing new power challenges, and reliability is top of mind in light of last year's extreme weather events. What does the 2018 data say about 2019?

For one thing, demand response evolved, enabled by new information and communications technology. Last year, wholesale market operators increasingly sought to leverage the dispatch of distributed energy resource flexibility in close to real time. Three independent system operators and regional transmission organizations called on demand response five times in total for relief in the summer of 2018, including the NYISO.

The demand response events called in the last 18 months send a clear message: Grid operators will continue to call events year-round. This story unfolds as reserve margins continue to tighten, fossil baseload generation retirements continue, and system operators are increasingly faced with proving the resiliency and reliability of their systems while efforts to invest in a smarter electricity infrastructure gain momentum across the country.

In 2019, the total amount of flexible demand response capacity for wholesale market participation will remain about the same. However, the way operators and aggregators are using demand response is changing as information and communications technology systems improve and utilities are using AI to adapt to electricity demands, allowing the behavior of resources to be more accurately forecasted, monitored and controlled.

These improvements are allowing customer-sited resources to offer  flexibility services closer to real-time operations and become more reactive to system needs. At the same time, traditional demand response will continue to evolve toward the orchestration of DERs as an aggregate flexible resource to better enable growing levels of renewable energy on the grid.


Related News

View more

Hot Houston summer and cold winter set new electricity records

US Electricity Demand 2018-2050 projects slower growth as energy consumption, power generation, air conditioning, and electric heating shift with efficiency standards, commercial floor space, industrial load, and household growth across the forecast horizon.


Key Points

A forecast of US power use across homes, commercial space, industrial load, and efficiency trends from 2018 to 2050.

✅ 2018 generation hit record; residential sales up 6%.

✅ Efficiency curbs demand; growth lags population and floor space.

✅ Commercial sales up 2%; industrial demand fell 3% in 2018.


Last year's Houston cold winter and hot summer drove power use to record levels, especially among households that rely on electricity for air conditioning during extreme weather conditions.

Electricity generation increased 4 per cent nationwide in 2018 and produced 4,178 million megawatt hours, driven in part by record natural gas generation across the U.S., surpassing the previous peak of 4,157 megawatt hours set in 2007, the Energy Department reported.

U.S. households bought 6 percent more electricity in 2018 than they did the previous year, despite longer-term declines in national consumption, reflecting the fact 87 percent of households cool their homes with air conditioning and 35 percent use electricity for heating.

Electricity sales to the commercial sector increased 2 percent in 2018 compared to the previous year while the industrial sector bought 3 percent less last year.

Going forward, the Energy Department forecasts that electricity consumption will grow at a slower pace than in recent decades, aligning with falling sales projections as technology improves and energy efficiency standards moderate consumption.

The economy and population growth are primary drivers of demand and the government predicts the number of households will grow at 0.7 percent per year from now until 2050 but electricity demand will grow only by 0.4 percent annually.

Likewise, commercial floor space is expected to increase 1 percent per year from now until 2050 but electricity sales will increase only by half that amount.

Globally, surging electricity demand is putting power systems under strain, providing context for these domestic trends.


Related News

View more

Sign Up for Electricity Forum’s Newsletter

Stay informed with our FREE Newsletter — get the latest news, breakthrough technologies, and expert insights, delivered straight to your inbox.

Electricity Today T&D Magazine Subscribe for FREE

Stay informed with the latest T&D policies and technologies.
  • Timely insights from industry experts
  • Practical solutions T&D engineers
  • Free access to every issue

Download the 2025 Electrical Training Catalog

Explore 50+ live, expert-led electrical training courses –

  • Interactive
  • Flexible
  • CEU-cerified