London, Ontario Power Outage disrupts the electricity grid, causing a citywide blackout, stalled commuters, dark traffic signals, and closed businesses, as London Hydro crews race restoration after a transformer malfunction and infrastructure failures.
Key Points
A blackout caused by a transformer malfunction, disrupting commuters, businesses, and traffic across London, Ontario.
✅ Traffic signals dark; delays and congestion citywide
✅ London Hydro crews repairing malfunctioning transformer
✅ Businesses closed; transit routes delayed and rerouted
A widespread power outage early Monday morning left thousands of residents in London, Ontario, without electricity, causing significant disruption for commuters and businesses at the start of the workday. The outage, which affected several neighborhoods across the city, lasted for hours, creating a chaotic morning as residents scrambled to adjust to the unexpected interruption.
The Outage Strikes
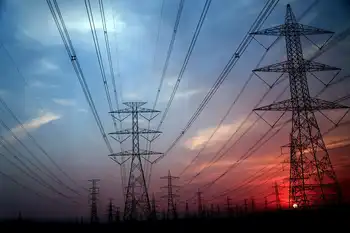
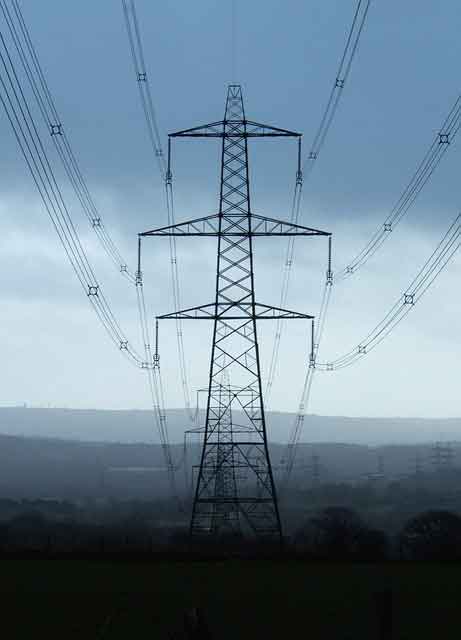
The power failure was first reported at approximately 6:30 a.m., catching many off guard as they began their day. The affected areas included several busy neighborhoods, with power lines down and substations impacted, issues that windstorms often exacerbate for utilities. Early reports indicated that the outage was caused by a combination of issues, including technical failures and possible equipment malfunctions. London Hydro, the city's primary electricity provider, responded quickly to the situation, assuring residents that crews were dispatched to restore power as soon as possible.
"Crews are on site and working hard to restore power to those affected," a spokesperson for London Hydro said. "We understand the frustration this causes and are doing everything we can to get the power back on as soon as possible."
Impact on Commuters and Businesses
The power outage had an immediate impact on the morning commute. Traffic lights across the affected areas were down, leading to delays and rush-hour disruptions at major intersections. Drivers were forced to navigate through intersections without traffic control, creating an additional layer of complexity for those trying to get to work or school.
Public transit was also affected, with some bus routes delayed due to the power loss at key transit stations. The situation added further stress to commuters already dealing with the challenges of a typical Monday morning rush.
Businesses in the affected neighborhoods faced a variety of challenges. Some were forced to close early or delay their opening hours due to a lack of electricity. Many shops and offices struggled with limited access to the internet and phone lines, which hindered their ability to process orders and serve customers. Local coffee shops, often a go-to for busy workers, were also unable to operate their coffee machines or provide basic services, forcing customers to go without their usual morning caffeine fix.
"For a lot of people, it's their first stop in the morning," said one local business owner. "It’s frustrating because we rely on power to function, and with no warning, we had to turn away customers."
The Response
As the hours ticked by, residents were left wondering when the power would return. London Hydro’s social media accounts were filled with updates, keeping residents informed about the restoration efforts, a practice echoed when BC Hydro crews responded during an atypical storm. The utility company urged those who were experiencing issues to report them online to help prioritize repair efforts.
"We are aware that many people are affected, and our teams are working tirelessly to restore power," the utility posted on Twitter. "Please stay safe, and we thank you for your patience."
Throughout the morning, the power was gradually restored to different areas of the city. However, some parts remained without electricity well into the afternoon, a situation reminiscent of extended outages that test city resilience. London Hydro confirmed that the outage was caused by a malfunctioning transformer, and the necessary repairs would take time to complete.
Long-Term Effects and Community Concerns
While the immediate effects of the outage were felt most acutely during the morning hours, some residents expressed concern about the potential long-term effects. The city’s reliance on a stable electricity grid became a focal point of discussion, with many wondering if similar outages could occur in the future, as seen in the North Seattle outage earlier this year.
"I understand that things break, but it’s frustrating that it took so long for power to come back," said a London resident. "This isn’t the first time something like this has happened, and it makes me wonder about the reliability of our infrastructure."
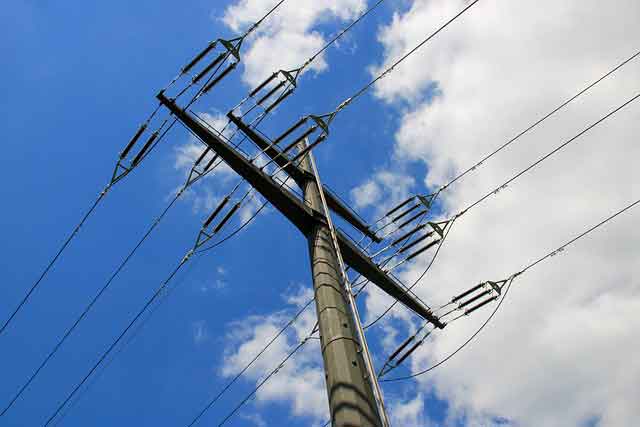
City officials responded by reassuring residents that efforts are underway to upgrade the city's infrastructure to prevent such outages from happening in the future. A report released by London Hydro highlighted ongoing investments in upgrading transformers and other key components of the city's power grid. Province-wide, Hydro One restored power to more than 277,000 customers after damaging storms, underscoring the scale of upgrades needed. Despite these efforts, however, experts warn that older infrastructure in some areas may still be vulnerable to failure, especially during extreme weather events or other unforeseen circumstances.
The morning outage serves as a reminder of how reliant modern cities are on stable electricity networks. While the response from London Hydro was swift and effective in restoring power, it’s clear that these types of events can cause significant disruptions to daily life. As the city moves forward, many are calling for increased investment in infrastructure and proactive measures to prevent future outages, especially after Toronto outages persisted following a spring storm in the region.
In the meantime, Londoners have adapted, finding ways to go about their day as best they can. For some, it’s a reminder of the importance of preparedness in an increasingly unpredictable world. Whether it’s an extra flashlight or a backup power source, residents are learning to expect the unexpected and be ready for whatever the next workday might bring.
Related News