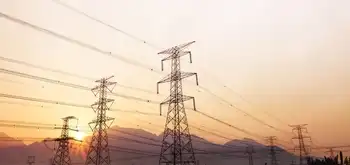
Florida Hurricane Irma Power Outages strain the grid as utilities plan rebuilds; FPL and Duke Energy deploy crews to restore transmission lines, substations, and service amid flooding, storm surge, and widespread disruptions statewide.
Key Points
Large-scale post-storm power losses in Florida requiring grid rebuilds, thousands of crews, and phased restoration.
✅ Utilities prioritize plants, transmission, substations, then critical facilities
✅ 50,000-60,000 workers mobilized; bucket trucks wait for safe winds
✅ Remote rerouting and hardening aid faster restoration amid flooding
Parts of Florida could be without electricity for more than a week, as damage from Hurricane Irma will require a complete rebuild of portions of the electricity grid, utility executives said on Monday.
Irma has knocked out power to 6.5 million Florida electricity customers, or nearly two-thirds of the state, since making landfall this weekend. In major areas such as Miami-Dade, 74 percent of the county was without power, according to Florida's division of emergency management.
Getting that power back online may require the help of 50,000 to 60,000 workers from all over the United States and Canadian power crews as well, according to Southern Company CEO and Chairman Thomas Fanning. He is also co-chair of the Electricity Subsector Coordinating Council, which coordinates the utility industry and government response to disasters and cyberthreats.
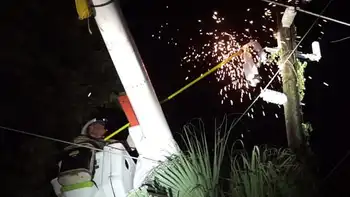
While it is not uncommon for severe storms to down power lines and damage utility poles, Irma's heavy winds and rain batted some of the state's infrastructure to the ground, Fanning said.
"'Restore' may not capture the full sense of where we are. For the very hard impacted areas, I think you're in a 'rebuild' area," he told CNBC's "Squawk Box."
"That's a big deal. People need to understand this is going to take perhaps weeks, not days, in some areas," Fanning said.
Parts of northern Florida, including Jacksonville, experienced heavy flooding, which will temporarily prevent crews from accessing some areas.
Duke Energy, which serves 1.8 million customers in parts of central and northwestern Florida, is trying to restore service to 1.2 million residences and businesses.
Florida Power & Light Company, which provides power to an estimated 4.9 million accounts across the state, had about 3.5 million customers without electricity as of Monday afternoon, said Rob Gould, vice president and chief communications officer at FPL.
The initial damage assessments suggest power can be restored to parts of the state's east coast in just days, but some of the west coast will require rebuilding that could stretch out for weeks, Gould told CNBC's "Power Lunch."
"This is not a typical restoration that you're going to see. We actually for the first time in our company history have our entire 27,000-square-mile, 35-county territory under assault by Irma," he said.
FPL said it would first repair any damage to power plants, transmission lines and substations as part of its massive response to Irma, then prioritize critical facilities such as hospitals and water treatment plants. The electricity company would then turn its attention to areas that are home to supermarkets, gas stations and other community services.
Florida utilities invested billions into their systems after devastating hurricane seasons in 2004 and 2005 in order to make them more resilient and easier to restore after a storm. Irma, which ranked among the most powerful storms in the Atlantic, has nevertheless tested those systems.
The upgrades have allowed FPL to automatically reroute power and address about 1.5 million outages, Gould said. The company strategically placed 19,500 restoration workers before the storm hit, but it cannot use bucket trucks to fix power lines until winds die down, he said.
Some parts of Florida's distribution system — the lines that deliver electricity from power plants to businesses and residences — run underground. However, the state's long coastline and the associated danger of storm surge and seawater incursion make it impractical to run lines beneath the surface in some areas.
Duke Energy has equipped 28 percent of its system with smart grid technology to reroute power remotely, according to Harry Sideris, Duke's state president for Florida. He said the company would continue to build out that capability in the future.
Duke deployed more than 9,000 linesmen and support crew members to Irma-struck areas, but cannot yet say how long some customers will be without power.
Separately, Gulf Power crews reported restoring service to more than 32,000 customers.
"At this time we do not know the exact restoration times. However, we're looking at a week or longer from the first look at the widespread damage that we had," Sideris told CNBC's "Closing Bell."
FPL said on Monday it was doing final checks before bringing back nuclear reactors that were powered down as Hurricane Irma hit Florida.
"We are in the process now of doing final checks on a few of them; we will be bringing those up," FPL President and CEO Eric Silagy told reporters.
Related News