Thermoelectric Materials convert waste heat into electricity via the Seebeck effect; quantum computations and semiconductors accelerate discovery, enabling clean energy, higher efficiency, and scalable heat-to-power conversion from abundant, non-toxic, cost-effective compounds.
Key Points
Thermoelectric materials turn waste heat into electricity via the Seebeck effect, improving energy efficiency.
✅ Convert waste heat to electricity via the Seebeck effect
✅ Quantum computations rapidly identify high-performance candidates
✅ Target efficient, low-thermal-conductivity, non-toxic, abundant compounds
The need to transition to clean energy is apparent, urgent and inescapable. We must limit Earth’s rising temperature to within 1.5 C to avoid the worst effects of climate change — an especially daunting challenge in the face of the steadily increasing global demand for energy and the need for reliable clean power, with concepts that can generate electricity at night now being explored worldwide.
Part of the answer is using energy more efficiently. More than 72 per cent of all energy produced worldwide is lost in the form of heat, and advances in turning thermal energy into electricity could recover some of it. For example, the engine in a car uses only about 30 per cent of the gasoline it burns to move the car. The remainder is dissipated as heat.
Recovering even a tiny fraction of that lost energy would have a tremendous impact on climate change. Thermoelectric materials, which convert wasted heat into useful electricity, can help, especially as researchers pursue low-cost heat-to-electricity materials for scalable deployment.
Until recently, the identification of these materials had been slow. My colleagues and I have used quantum computations — a computer-based modelling approach to predict materials’ properties — to speed up that process and identify more than 500 thermoelectric materials that could convert excess heat to electricity, and help improve energy efficiency.
Making great strides towards broad applications
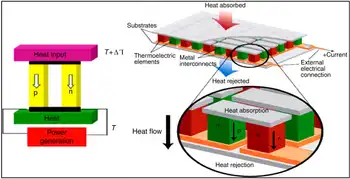
The transformation of heat into electrical energy by thermoelectric materials is based on the “Seebeck effect.” In 1826, German physicist Thomas Johann Seebeck observed that exposing the ends of joined pieces of dissimilar metals to different temperatures generated a magnetic field, which was later recognized to be caused by an electric current.
Shortly after his discovery, metallic thermoelectric generators were fabricated to convert heat from gas burners into an electric current. But, as it turned out, metals exhibit only a low Seebeck effect — they are not very efficient at converting heat into electricity.
In 1929, the Russian scientist Abraham Ioffe revolutionized the field of thermoelectricity. He observed that semiconductors — materials whose ability to conduct electricity falls between that of metals (like copper) and insulators (like glass) — exhibit a significantly higher Seebeck effect than metals, boosting thermoelectric efficiency 40-fold, from 0.1 per cent to four per cent.
This discovery led to the development of the first widely used thermoelectric generator, the Russian lamp — a kerosene lamp that heated a thermoelectric material to power a radio.
Are we there yet?
Today, thermoelectric applications range from energy generation in space probes to cooling devices in portable refrigerators, and include emerging thin-film waste-heat harvesters for electronics as well. For example, space explorations are powered by radioisotope thermoelectric generators, converting the heat from naturally decaying plutonium into electricity. In the movie The Martian, for example, a box of plutonium saved the life of the character played by Matt Damon, by keeping him warm on Mars.
In the 2015 film, The Martian, astronaut Mark Watney (Matt Damon) digs up a buried thermoelectric generator to use the power source as a heater.
Despite this vast diversity of applications, wide-scale commercialization of thermoelectric materials is still limited by their low efficiency.
What’s holding them back? Two key factors must be considered: the conductive properties of the materials, and their ability to maintain a temperature difference, as seen in nighttime electricity from cold concepts, which makes it possible to generate electricity.
The best thermoelectric material would have the electronic properties of semiconductors and the poor heat conduction of glass. But this unique combination of properties is not found in naturally occurring materials. We have to engineer them, drawing on advances such as carbon nanotube energy harvesters to guide design choices.
Searching for a needle in a haystack
In the past decade, new strategies to engineer thermoelectric materials have emerged due to an enhanced understanding of their underlying physics. In a recent study in Nature Materials, researchers from Seoul National University, Aachen University and Northwestern University reported they had engineered a material called tin selenide with the highest thermoelectric performance to date, nearly twice that of 20 years ago. But it took them nearly a decade to optimize it.
To speed up the discovery process, my colleagues and I have used quantum calculations to search for new thermoelectric candidates with high efficiencies. We searched a database containing thousands of materials to look for those that would have high electronic qualities and low levels of heat conduction, based on their chemical and physical properties. These insights helped us find the best materials to synthesize and test, and calculate their thermoelectric efficiency.
We are almost at the point where thermoelectric materials can be widely applied, but first we need to develop much more efficient materials. With so many possibilities and variables, finding the way forward is like searching for a tiny needle in an enormous haystack.
Just as a metal detector can zero in on a needle in a haystack, quantum computations can accelerate the discovery of efficient thermoelectric materials. Such calculations can accurately predict electron and heat conduction (including the Seebeck effect) for thousands of materials and unveil the previously hidden and highly complex interactions between those properties, which can influence a material’s efficiency.
Large-scale applications will require themoelectric materials that are inexpensive, non-toxic and abundant. Lead and tellurium are found in today’s thermoelectric materials, but their cost and negative environmental impact make them good targets for replacement.
Quantum calculations can be applied in a way to search for specific sets of materials using parameters such as scarcity, cost and efficiency, and insights can even inform exploratory devices that generate electricity out of thin air in parallel fields. Although those calculations can reveal optimum thermoelectric materials, synthesizing the materials with the desired properties remains a challenge.
A multi-institutional effort involving government-run laboratories and universities in the United States, Canada and Europe has revealed more than 500 previously unexplored materials with high predicted thermoelectric efficiency. My colleagues and I are currently investigating the thermoelectric performance of those materials in experiments, and have already discovered new sources of high thermoelectric efficiency.
Those initial results strongly suggest that further quantum computations can pinpoint the most efficient combinations of materials to make clean energy from wasted heat and the avert the catastrophe that looms over our planet.
Related News