Eskom resorts to land expropriation

By Engineering News


Arc Flash Training CSA Z462 - Electrical Safety Essentials

Our customized live online or in‑person group training can be delivered to your staff at your location.

  • Live Online
  • 6 hours Instructor-led
  • Group Training Available
Regular Price:
$249
Coupon Price:
$199
Reserve Your Seat Today
State power utility Eskom claims to be expediting regulations to enable it to expropriate land it requires for transmission-line servitudes, because the acquisition process is said to be taking too long.

The utility has also made it apparent that most of the delays relate to land owned by non-South Africans, many of whom are absentee landlords.

Earlier in the year, CEO Jacob Maroga indicated that the acquisition of land and servitude rights had emerged as a major challenge. "Timelines are tight," Maroga warned, pointing out that Eskom was aiming to spend some R15,5-billion on long-distance transmission lines up until 2012.

Now, Eskom Enterprises CEO Brian Dames - who has overall responsibility for the corporation's R200-billion-plus capital programme, involving both generation and transmission infrastructure - has again confirmed that there is growing anxiety at Eskom over the issue.

He also indicated that resorting to legal resolution was now viewed as the only realistic route to deal with the matter.

Speaking to the South African contractor community recently, Dames said that, while there were some initial difficulties in obtaining environmental approvals for transmission projects, land acquisition had since emerged as the most serious constraint.

"Most of the land is owned by farmers, and a lot of these farmers are foreigners, and that is where we are having most of our problems," Dames reported, adding that it was now looking to secure the land through an expropriation process.

"There is one line where we have just five kilometres missing, because the land owner is refusing to give us access. This is effectively holding back the expansion in the platinum basin. We cannot have this as a country and that alignment needs to happen very, very quickly," Dames asserted.

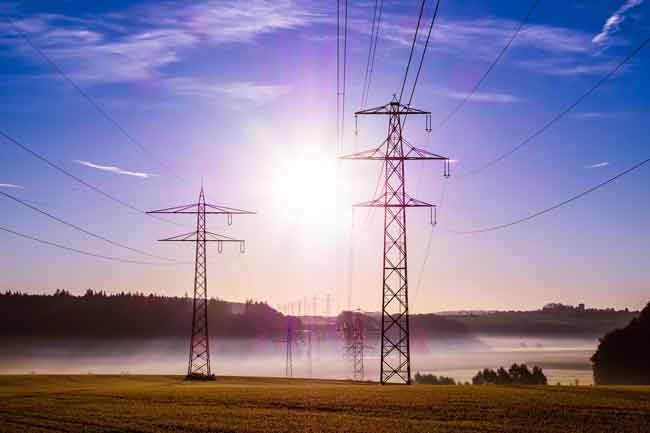
He also stressed that the transmission aspect of Eskom's expenditure, while far smaller than that required to expand the generation system, was as crucial for dealing with the current electricity-supply constraints.

For instance, it was vital that servitudes were secured to link the R78,6-billion Medupi, to be built in Limpopo province, into the system in Gauteng.

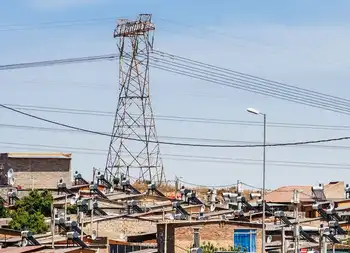
Transmission strengthening and expansion projects currently under way included a 1 500 km, 765kV line from Johannesburg to Cape Town, where tower lifting had started. These 42-m high and 39-t towers were being installed by a Japanese/South African joint venture and stringing should begin within weeks.

The utility had also recently completed a 400-km, 400-kV line into the Eastern Cape, which was the longest 400-kV line in the country, as well as some system strengthening into the Western Cape.

Work was being planned for another line into the Eastern Cape to feed into the Coega Industrial Development Zone (IDZ), incorporating the $2,7-billion Rio Tinto Alcan aluminium project, which is the anchor tenant for the IDZ, near Port Elizabeth, while there were further strengthening and expansion projects scheduled for both the Western Cape and KwaZulu-Natal.

Related News

Climate change: Greenhouse gas concentrations again break records

Rising Greenhouse Gas Concentrations drive climate change, with CO2, methane, and nitrous oxide surging; WMO data show higher radiative forcing, elevated pre-industrial baselines, and persistent atmospheric concentrations despite Paris Agreement emissions pledges.


Key Points

Increasing atmospheric CO2, methane, and nitrous oxide levels that raise radiative forcing and drive warming.

✅ WMO data show CO2 at 407.8 ppm in 2018, above decade average

✅ Methane and nitrous oxide surged, elevating total radiative forcing

✅ Concentrations differ from emissions; sinks absorb about half


The World Meteorological Organization (WMO) says the increase in CO2 was just above the average rise recorded over the last decade.

Levels of other warming gases, such as methane and nitrous oxide, have also surged by above average amounts.

Since 1990 there's been an increase of 43% in the warming effect on the climate of long lived greenhouse gases.

The WMO report looks at concentrations of warming gases in the atmosphere rather than just emissions.

The difference between the two is that emissions refer to the amount of gases that go up into the atmosphere from the use of fossil fuels, such as burning coal for coal-fired electricity generation and from deforestation.

Concentrations are what's left in the air after a complex series of interactions between the atmosphere, the oceans, the forests and the land. About a quarter of all carbon emissions are absorbed by the seas, and a similar amount by land and trees, while technologies like carbon capture are being explored to remove CO2.

Using data from monitoring stations in the Arctic and all over the world, researchers say that in 2018 concentrations of CO2 reached 407.8 parts per million (ppm), up from 405.5ppm a year previously.

This increase was above the average for the last 10 years and is 147% of the "pre-industrial" level in 1750.

The WMO also records concentrations of other warming gases, including methane and nitrous oxide, and some countries have reported declines in certain potent gases, as noted in US greenhouse gas controls reports, though global levels remain elevated. About 40% of the methane emitted into the air comes from natural sources, such as wetlands, with 60% from human activities, including cattle farming, rice cultivation and landfill dumps.

Methane is now at 259% of the pre-industrial level and the increase seen over the past year was higher than both the previous annual rate and the average over the past 10 years.

Nitrous oxide is emitted from natural and human sources, including from the oceans and from fertiliser-use in farming. According to the WMO, it is now at 123% of the levels that existed in 1750.

Last year's increase in concentrations of the gas, which can also harm the ozone layer, was bigger than the previous 12 months and higher than the average of the past decade.

What concerns scientists is the overall warming impact of all these increasing concentrations. Known as total radiative forcing, this effect has increased by 43% since 1990, and is not showing any indication of stopping.

There is no sign of a slowdown, let alone a decline, in greenhouse gases concentration in the atmosphere despite all the commitments under the Paris agreement on climate change and the ongoing global energy transition efforts," said WMO Secretary-General Petteri Taalas.

"We need to translate the commitments into action and increase the level of ambition for the sake of the future welfare of mankind," he added.

"It is worth recalling that the last time the Earth experienced a comparable concentration of CO2 was three to five million years ago. Back then, the temperature was 2-3C warmer, sea level was 10-20m higher than now," said Mr Taalas.

The UN Environment Programme will report shortly on the gap between what actions countries are taking to cut carbon, for example where Australia's emissions rose 2% recently, and what needs to be done to keep under the temperature targets agreed in the Paris climate pact.

Preliminary findings from this study, published during the UN Secretary General's special climate summit last September, indicated that emissions continued to rise during 2018, although global emissions flatlined in 2019 according to the IEA.

Both reports will help inform delegates from almost 200 countries who will meet in Madrid next week for COP25, following COP24 in Katowice the previous year, the annual round of international climate talks.


Related News

View more

Canada Extends Net-Zero Target to 2050

Canada Clean Electricity Regulations 2050 balance net-zero goals with grid reliability and affordability, setting emissions caps, enabling offset credits, and flexible provincial pathways, including support for non-grid facilities during the clean energy transition.


Key Points

A federal plan for a net-zero grid by 2050 with emissions caps, offsets, and flexible provincial compliance.

✅ Emissions cap targeting 181 Mt CO2 from the power sector by 2050

✅ Offset credits and annual limits enable compliance flexibility

✅ Support for remote, non-grid facilities and regional pathways


In December 2024, the Government of Canada announced a significant policy shift regarding its clean electricity objectives. The initial target to achieve a net-zero electricity grid by 2035 has been extended to 2050. This decision reflects the government's response to feedback from provinces and energy industry stakeholders, who expressed concerns about the feasibility of meeting the 2035 deadline.

Revised Clean Electricity Regulations

The newly finalized Clean Electricity Regulations (CER) outline the framework for Canada's transition to a net-zero electricity grid by 2050, advancing the goal of 100 per cent clean electricity nationwide.

  • Emissions Reduction Targets: The regulations set a cap on emissions from the electricity sector, targeting a reduction of 181 megatonnes of CO₂ by 2050. This is a decrease from the previous goal of 342 megatonnes, reflecting a more gradual approach to emissions reduction.

  • Flexibility Mechanisms: To accommodate the diverse energy landscapes across provinces, the CER introduces flexibility measures. These include annual emissions limits and the option to use offset credits, allowing provinces to tailor their strategies while adhering to national objectives.

  • Support for Non-Grid Connected Facilities: Recognizing the unique challenges of remote and off-grid communities, the regulations provide accommodations for certain non-grid connected facilities, ensuring that all regions can contribute to the national clean electricity goals.

Implications for Canada's Energy Landscape

The extension of the net-zero electricity target to 2050 signifies a strategic recalibration of Canada's energy policy. This adjustment acknowledges the complexities involved in transitioning to a clean energy future, including:

  • Grid Modernization: Upgrading the electrical grid to accommodate renewable energy sources and ensure reliability is a critical component of the transition, especially as Ontario's EV wave accelerates across the province.

  • Economic Considerations: Balancing environmental objectives with economic impacts is essential. The government aims to create over 400,000 clean energy jobs, fostering economic growth while reducing emissions, supported by ambitious EV goals in the transport sector.

  • Regional Variations: Provinces have diverse energy profiles and resources, and British Columbia's power supply challenges highlight planning constraints. The CER's flexibility mechanisms are designed to accommodate these differences, allowing for tailored approaches that respect regional contexts.

Public and Industry Reactions

The policy shift has elicited varied responses:

  • Environmental Advocates: Some environmental groups express concern that the extended timeline may delay critical climate action, while debates over Quebec's push for EV dominance underscore policy trade-offs. They emphasize the need for more ambitious targets to address the escalating impacts of climate change.

  • Industry Stakeholders: The energy sector generally welcomes the extended timeline, viewing it as a pragmatic approach that allows for a more measured transition, particularly amid criticism of the 2035 EV mandate in transportation policy. The flexibility provisions are particularly appreciated, as they provide the necessary leeway to adapt to evolving market and technological conditions.

Looking Forward

As Canada moves forward with the implementation of the Clean Electricity Regulations, the focus will be on:

  • Monitoring Progress: Establishing robust mechanisms to track emissions reductions and ensure compliance with the new targets.

  • Stakeholder Engagement: Continuing dialogue with provinces, industry, and communities to refine strategies and address emerging challenges, including coordination on EV sales regulations as complementary measures.

  • Innovation and Investment: Encouraging the development and deployment of clean energy technologies through incentives and support programs.

The extension of Canada's net-zero electricity target to 2050 represents a strategic adjustment aimed at achieving a balance between environmental goals and practical implementation considerations. The Clean Electricity Regulations provide a framework that accommodates regional differences and industry concerns, setting the stage for a sustainable and economically viable energy future.


Related News

View more

Electricity turns garbage into graphene

Waste-to-Graphene uses flash joule heating to convert carbon-rich trash into turbostratic graphene for composites, asphalt, concrete, and flexible electronics, delivering scalable, low-cost, high-quality material from food scraps, plastics, and tires with minimal processing.


Key Points

A flash heating method converting waste carbon into turbostratic graphene for scalable, low-cost industrial uses.

✅ Converts food scraps, plastics, and tires into graphene

✅ Produces turbostratic flakes that disperse well in composites

✅ Scalable, low-cost process via flash joule heating


Science doesn’t usually take after fairy tales. But Rumpelstiltskin, the magical imp who spun straw into gold, would be impressed with the latest chemical wizardry. Researchers at Rice University report today in Nature that they can zap virtually any source of solid carbon, from food scraps to old car tires, and turn it into graphene—sheets of carbon atoms prized for applications ranging from high-strength plastic to flexible electronics, and debates over 5G electricity use continue to evolve. Current techniques yield tiny quantities of picture-perfect graphene or up to tons of less prized graphene chunks; the new method already produces grams per day of near-pristine graphene in the lab, and researchers are now scaling it up to kilograms per day.

“This work is pioneering from a scientific and practical standpoint” as it promises to make graphene cheap enough to use to strengthen asphalt or paint, says Ray Baughman, a chemist at the University of Texas, Dallas. “I wish I had thought of it.” The researchers have already founded a new startup company, Universal Matter, to commercialize their waste-to-graphene process, while others are digitizing the electrical system to modernize infrastructure.

With atom-thin sheets of carbon atoms arranged like chicken wire, graphene is stronger than steel, conducts electricity and heat better than copper, and can serve as an impermeable barrier preventing metals from rusting, while advances such as superconducting cables aim to cut grid losses. But since its 2004 discovery, high-quality graphene—either single sheets or just a few stacked layers—has remained expensive to make and purify on an industrial scale. That’s not a problem for making diminutive devices such as high-speed transistors and efficient light-emitting diodes. But current techniques, which make graphene by depositing it from a vapor, are too costly for many high-volume applications. And higher throughput approaches, such as peeling graphene from chunks of the mineral graphite, produce flecks composed of up to 50 graphene layers that are not ideal for most applications.

Graphene comes in many forms. Single sheets, which are ideal for electronics and optics, can be grown using a method called chemical vapor deposition. But it produces only tiny amounts. For large volumes, companies commonly use a technique called liquid exfoliation. They start with chunks of graphite, which is just myriad stacked graphene layers. Then they use acids and solvents, as well as mechanical grinding, to shear off flakes. This approach typically produces tiny platelets each made up of 20 to 50 layers of graphene.

In 2014, James Tour, a chemist at Rice, and his colleagues found they could make a pure form of graphene—each piece just a few layers thick—by zapping a form of amorphous carbon called carbon black with a laser. Brief pulses heated the carbon to more than 3000 kelvins, snapping the bonds between carbon atoms; for comparison, researchers have also generated electricity from falling snow using triboelectric effects. As the cloud of carbon cooled, it coalesced into the most stable structure possible, graphene. But the approach still produced only tiny qualities and required a lot of energy.

Two years ago, Luong Xuan Duy, one of Tour’s graduate students, read that other researchers had created metal nanoparticles by zapping a material with electricity, creating the same brief blast of heat behind the success of the laser graphene approach. “I wondered if I could use that to heat a carbon source and produce graphene,” Duy says. So, he put a dash of carbon black in a clear glass vial and zapped it with 400 volts, similar in spirit to electrical weed zapping approaches in agriculture, for about 200 milliseconds. Initially he got junk. But after a bit of tweaking, he managed to create a bright yellowish white flash, indicating the temperature inside the vial was reaching about 3000 kelvins. Chemical tests revealed he had produced graphene.

It turned out to be a type of graphene that is ideal for bulk uses. As the carbon atoms condense to form graphene, they don’t have time to stack in a regular pattern, as they do in graphite. The result is a material known as turbostatic graphene, with graphene layers jumbled at all angles atop one another. “That’s a good thing,” Duy says. When added to water or other solvents, turbostatic graphene remains suspended instead of clumping up, allowing each fleck of the material to interact with whatever composite it’s added to.

“This will make it a very good material for applications,” says Monica Craciun, a materials physicist at the University of Exeter. In 2018, she and her colleagues reported that adding graphene to concrete more than doubled its compressive strength. Tour’s team saw much the same result. When they added just 0.05% by weight of their flash-produced graphene to concrete, the compressive strength rose 25%; graphene added to polydimethylsiloxane, a common plastic, boosted its strength by 250%.

As digital control spreads across energy networks, research to counter ransomware-driven blackouts is increasingly important for grid resilience.

Those results could reignite efforts to use graphene in a wide range of composites. Researchers in Italy reported recently that adding graphene to asphalt dramatically reduces its tendency to fracture and more than doubles its life span. Last year, Iterchimica, an Italian company, began to test a 250-meter stretch of road in Milan paved with graphene-spiked asphalt. Tests elsewhere have shown that adding graphene to paint dramatically improves corrosion resistance.

These applications would require high-quality graphene by the ton. Fortunately, the starting point for flash graphene could hardly be cheaper or more abundant: Virtually any organic matter, including coffee grounds, food scraps, old tires, and plastic bottles, can be vaporized to make the material. “We’re turning garbage into graphene,” Duy says.


Related News

View more

Here are 3 ways to find out where your electricity comes from

US energy mix shows how the electric grid blends renewables, fossil fuels, nuclear, and hydro, varying by ISO/RTO markets, utilities, and state policies, affecting carbon emissions, pricing, reliability, and access.


Key Points

The US energy mix is the grid's source breakdown by region: fossil fuels, renewables, nuclear, and hydro.

✅ Check ISO or RTO dashboards for real-time generation by fuel source.

✅ Utilities may offer green power plans or RECs at modest premiums.

✅ Energy mix shifts with policy, pricing, and grid reliability needs.


There are few resources more important than energy. Sure, you may die if you don't eat for days. But your phone will die if you go too long without charging it. Energy feeds tech, the internet, city infrastructure, refrigerators, lights, and has evolved throughout U.S. history in profound ways. You get the idea. Yet unlike our other common needs, such as food, energy sources aren't exactly front of mind for most people. 

"I think a lot of people don't put a lot of bandwidth into thinking about this part of their lives," said Richard McMahon, the SVP of energy supply and finance at Edison Electric Institute, a trade group that represents investor-owned electric companies in the US. 

It makes sense. For most Americans, electricity is always there, and in many locations, there's not much of a choice involved, even as electricity demand is flat across the U.S. today. You sign up with a utility when you move into a new residence and pay your bills when they're due. 

But there's an important reality that indifference eschews: In 2018, a third of the energy-related carbon-dioxide emissions in the US came from the electric power sector, according to the US Energy Information Administration (EIA). 

A good chunk of that is from the residential sector, which consistently uses more energy than commercial customers, per EIA data.

Just as many people exercise choice when they eat, you typically also have a choice when it comes to your energy supply. That's not to say your current offering isn't what you want, or that switching will be easy or affordable, but "if you're a customer and want power with a certain attribute," McMahon said, "you can pretty much get it wherever you are." 

But first, you need to know the energy mix you have right now. As it turns out, it's not so straightforward. At all.

This brief guide may help. 

For some utility providers, you can find out if it publishes the energy mix online. Dominion Energy, which serves Idaho, North Carolina, Ohio, South Carolina, Utah, Virginia, West Virginia, and Wyoming, provides this information in a colored graphic. 

"Once you figure out who your utility is you can figure out what mix of resources they use," said Heidi Ratz, an electricity markets researcher at the World Resources Institute.

But not all utilities publish this information.

It has to do with their role in the grid and reflects utility industry trends in structure and markets. Some utility companies are vertically integrated; they generate power through nuclear plants or wind farms and distribute those electrons directly to their customers. Other utilities just distribute the power that different companies produce. 

Consider Consolidated Edison, or Con Ed, which distributes energy to parts of New York City. While reporting this story, Business Insider could not find information about the utility's energy mix online. When reached for comment, a spokesperson said, "we're indifferent to where it comes from."

That's because, in New York, distribution utilities like Con Ed often buy energy through a wholesale marketplace.

Take a look at this map. If you live in one of the colored regions, your electricity is sold on a wholesale market regulated by an organization called a regional transmission organization (RTO) or independent system operator (ISO). Distribution utilities like Con Ed often buy their energy through these markets, based on availability and cost, while raising questions about future utility revenue models as prices shift. 

Still, it's pretty easy to figure out where your energy comes from. Just look up the ISO or RTO website (such as NYISO or CAISO). Usually, these organizations will provide energy supply information in near-real time. 

That's exactly what Con Edison (which buys energy on the NYISO marketplace) suggested. As of Friday morning, roughly 40% of the energy on the market place was natural gas or other fossil fuels, 34% was nuclear, and about 22% was hydro. 

If you live in another region governed by an ISO or RTO, such as in most of California, you can do the same thing. Like NYISO, CAISO has a dashboard that shows (again, as of Friday morning) about 36% of the energy on the market comes from natural gas and more than 20% comes from renewables. 

In the map linked above, you'll notice that some of the ISOs and RTOs like MISO encompass enormous regions. That means that even if you figure out where the energy in your market comes from, it's not going to be geographically specific. But there are a couple of ways to drill down even further. 

The Environmental Protection Agency has a straightforward tool called Power Profiler. You can enter your zip code to see the fuel mix in your area. But it's not perfect. The data are from 2016 and, in some regions of the country like the upper Midwest, they aren't much more localized, and some import dirty electricity due to regional trading. 

The World Resources Institute also has a tool that allows you to see the electricity mix by state, based on 2017 data from EIA. These numbers represent power generation, not the electricity actually flowing into your sockets, but they offer a rough idea of what energy resources are operating in your state. 

One option is to check with your utility to see if it has a "green power" offering. Over 600 utilities across the country have one, according to the Climate Reality Project, though they often come at a slightly higher cost. It's typically on the scale of just a few more cents per kilowatt-hour. 

There are also independent, consumer-facing companies like Arcadia and Green Mountain Energy that allow you to source renewable energy, by virtually connecting you to community solar projects or purchasing Renewable Energy Certificates, or RECs, on your behalf, as America goes electric and more options emerge. 

"RECs measure an investment in a clean energy resource," Ratz said, in an email. "The goal of putting that resource on the grid is to push out the need for dirtier resources."

The good news: Even if you do nothing, your energy mix will get cleaner. Coal production has fallen to lows not seen since the 1980s, amid disruptions in coal and nuclear sectors that affect reliability and costs, while renewable electricity generation has doubled since 2008. So whether you like it or not, you'll be roped into the clean energy boom one way or another. 


Related News

View more

Reconciliation and a Clean Electricity Standard

Clean Electricity Standard (CES) sets utility emissions targets, uses tradable credits, and advances decarbonization via technology-agnostic benchmarks, carbon capture, renewable portfolio standards, upstream methane accounting, and cap-and-trade alternatives in reconciliation policy.


Key Points

CES sets utility emissions targets using tradable credits and benchmarks to drive power-sector decarbonization.

✅ Annual clean energy targets phased to 2050

✅ Tradable credits for compliance across utilities

✅ Includes upstream methane and lifecycle emissions


The Biden Administration and Democratic members of Congress have supported including a clean electricity standard (CES) in the upcoming reconciliation bill. A CES is an alternative to pricing carbon dioxide through a tax or cap-and-trade program and focuses on reducing greenhouse gas emissions produced during electricity generation by establishing targets, while early assessments show mixed results so far. In principle, it is a technology-agnostic approach. In practice, however, it pushes particular technologies out of the market.

The details of the CES are still being developed, but recent legislation may provide insight into how the CES could operate. In May, Senator Tina Smith and Representative Ben Ray Luján introduced the Clean Energy Standard Act of 2019 (CESA), while Minnesota's 100% carbon-free mandate offers a state-level parallel, and in January 2020, the House Energy and Commerce Committee released a discussion draft of the Climate Leadership and Environmental Action for our Nation’s (CLEAN) Future Act. Both bills increase the clean energy target annually until 2050 in order to phase out emissions. Both bills also create a credit system where clean sources of electricity as determined by a benchmark, carbon dioxide emitted per kilowatt-hour, receive credits. These credits may be transferred, sold, and auctioned so utilities that fail to meet targets can procure credits from others, as large energy customers push to accelerate clean energy globally.

The bills’ benchmarks vary, and while the CLEAN Future Act allows natural gas-fired generators to receive partial credits, CESA does not. Under both bills, these generators would be expected to install carbon capture technology to continue meeting increasing targets for clean electricity generation. Both bills go beyond considering the emissions resulting from generation and include upstream emissions for natural gas-fired generators. Natural gas, a greenhouse gas, that is leaked upstream of a generator during transportation is to be included among its emissions. The CLEAN Future Act also calls for newly constructed hydropower generators to account for the emissions associated with the facility’s construction despite producing clean electricity. These additional provisions demonstrate not only the CES’s inability to fully address the issue of emissions but also the slippery slope of expanding the program to include other markets, echoing cost and reliability concerns as California exports its energy policies across the West.

A majority of states have adopted clean energy, electricity, or renewable portfolio standards, with some considering revamping electricity rates to clean the grid, leaving legislators with plenty of examples to consider. As they weigh their options, legislators should consider if they are effectively addressing the problem at hand, economy-wide emissions reductions, and at what cost, drawing on examples like New Mexico's 100% clean electricity bill to inform trade-offs.


Related News

View more

US NRC issues final safety evaluation for NuScale SMR

NuScale SMR Design Certification marks NRC Phase 6 FSER approval, validating small modular reactor safety and design review, enabling UAMPS deployment at Idaho National Laboratory and advancing DOE partnerships and Canadian vendor assessments.


Key Points

It is the NRC FSER approval confirming NuScale SMR safety design, enabling licensed deployment and vendor reviews.

✅ NRC Phase 6 FSER concludes design certification review

✅ Valid 15 years; enables site-independent licensing

✅ 60 MW modules, up to 12 per plant; UAMPS project at Idaho National Laboratory


US-based NuScale Power announced on 28 August that the US Nuclear Regulatory Commission (NRC) had completed Phase 6 review—the last and final phase—of the Design Certification Application (DCA) for its small modular reactor (SMR) with the issuance of the Final Safety Evaluation Report (FSER).

The FSER represents completion of the technical review and approval of the NuScale SMR design. With this final phase of NuScale’s DCA now complete, customers can proceed with plans to develop NuScale power plants as Ontario breaks ground on first SMR projects advance, with the understanding that the NRC has approved the safety aspects of the NuScale design.

“This is a significant milestone not only for NuScale, but also for the entire US nuclear sector and the other advanced nuclear technologies that will follow,” said NuScale chairman and CEO John Hopkins.

“The approval of NuScale’s design is an incredible accomplishment and we would like to extend our deepest thanks to the NRC for their comprehensive review, to the US Department of Energy (DOE) for its continued commitment to our successful private-public partnership to bring the country’s first SMR to market, and to the many other individuals who have dedicated countless hours to make this extraordinary moment a reality,” he added. “Additionally, the cost-shared funding provided by Congress over the past several years has accelerated NuScale’s advancement through the NRC Design Certification process.”

NuScale’s design certification application was accepted by the NRC in March 2017. NuScale spent over $500 million, with the backing of Fluor, and over 2 million hours to develop the information needed to prepare its DCA application, an effort that, similar to Rolls-Royce’s MoU with Exelon, underscores private-sector engagement to advance nuclear innovation. The company also submitted 14 separate Topical Reports in addition to the over 12,000 pages for its DCA application and provided more than 2 million pages of supporting information for NRC audits.

NuScale’s SMR is a fully factory-fabricated, 60MW power module based on pressurised water reactor technology. The scalable design means a power plant can house up to 12 individual power modules, and jurisdictions like Ontario have announced plans for four SMRs at Darlington to leverage modularity.

The NuScale design is so far the only small modular reactor to undergo a design certification review by the NRC, while in the UK UK approval for Rolls-Royce SMR is expected by mid-2024, signaling parallel regulatory progress. The design certification process addresses the various safety issues associated with the proposed nuclear power plant design, independent of a specific site and is valid for 15 years from the date of issuance.

NuScale's first customer, Utah Associated Municipal Power Systems (UAMPS), is planning a 12-module SMR plant at a site at the Idaho National Laboratory as efforts like TerraPower's molten-salt mini-reactor advance in parallel. Construction was scheduled to start in 2023, with the first module expected to begin operation in 2026. However, UAMPS has informed NuScale it needs to push back the timeline for operation of the first module from 2026 to 2029, the Washington Examiner reported on 24 August.

The NuScale SMR is also undergoing a vendor design review with the Canadian Nuclear Safety Commission, amid provincial activity such as New Brunswick's SMR debate that highlights domestic interest. NuScale has signed agreements with entities in the USA, Canada, Romania, the Czech Republic, and Jordan.


Related News

View more

Sign Up for Electricity Forum’s Newsletter

Stay informed with our FREE Newsletter — get the latest news, breakthrough technologies, and expert insights, delivered straight to your inbox.

Electricity Today T&D Magazine Subscribe for FREE

Stay informed with the latest T&D policies and technologies.
  • Timely insights from industry experts
  • Practical solutions T&D engineers
  • Free access to every issue

Download the 2025 Electrical Training Catalog

Explore 50+ live, expert-led electrical training courses –

  • Interactive
  • Flexible
  • CEU-cerified