Berkshire Hathaway Energy Wind Power drives cheap electricity rates in Iowa via utility-scale wind turbines, integrated transmission, battery storage, and grid management, delivering renewable energy, stable pricing, and long-term rate freezes through 2028.
Key Points
A vertically integrated wind utility lowering Iowa rates via owned generation, transmission, and advanced grid control.
✅ Owned wind assets meet Iowa residential demand
✅ Integrated transmission lowers costs and losses
✅ Rate freeze through 2028 sustains cheap power
In his latest letter to Berkshire Hathaway shareholders, Warren Buffett used the 20th anniversary of Berkshire Hathaway Energy to tout its cheap electricity bills for customers.
When Berkshire purchased the majority share of BHE in 2000, the cost of electricity for its residential customers in Iowa was 8.8 cents per kilowatt-hour (kWh) on average. Since then, these electricity rates have risen at a paltry <1% per year, with a freeze on rate hikes through 2028. As anyone who pays an electricity bill knows, that is an incredible deal.
As Buffett himself notes with alacrity, “Last year, the rates [BHE’s competitor in Iowa] charged its residential customers were 61% higher than BHE’s. Recently, that utility received a rate increase that will widen the gap to 70%.”
The Winning Strategy
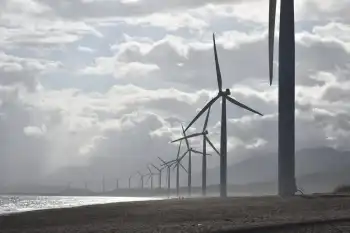
So, what’s Buffett’s secret to cheap electricity? Wind power.
“The extraordinary differential between our rates and theirs is largely the result of our huge accomplishments in converting wind into electricity,” Buffett explains.
Wind turbines in Iowa that BHE owns and operates are expected to generate about 25.2 million megawatt-hours (MWh) of electricity for its customers, as projects like Building Energy operations begin to contribute. By Buffett’s estimations, that will be enough to power all of its residential customers’ electricity needs in Iowa.
The company has plans to increase its renewable energy generation in other regions as well. This year, BHE Canada is expected to start construction on a 117.6MW wind farm in Alberta, Canada with its partner, Renewable Energy Systems, that will provide electricity to 79,000 homes in Canada’s oil country.
Observers note that Alberta is a powerhouse for both green energy and fossil fuels, underscoring the region's unique transition.
But I would argue that the secret to BHE’s success perhaps goes deeper than transitioning to sources of renewable energy. There are plenty of other utility companies that have adopted wind and solar power as an energy source. In the U.S., where renewable electricity surpassed coal in 2022, at least 50% of electricity customers have the option to buy renewable electricity from their power supplier, according to the Department of Energy. And some states, such as New York, have gone so far as to allow customers to pick from providers who generate their electricity.
What differentiates BHE from a lot of the competition in the utility space is that it owns the means to generate, store, transmit and supply renewable power to its customers across the U.S., U.K. and Canada, with lessons from the U.K. about wind power informing policy.
In its financial filings for 2019, the company reported that it owns 33,600MW of generation capacity and has 33,400 miles of transmission lines, as well as a 50% interest in Electric Transmission Texas (ETT) that has approximately 1,200 miles of transmission lines. This scale and integration enables BHE to be efficient in the distribution and sale of electricity, including selling renewable energy across regions.
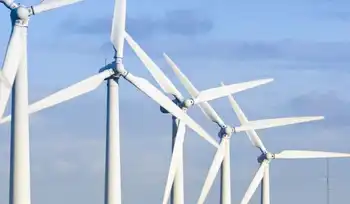
BHE is certainly not alone in building renewable-energy fueled electricity dominions. Its largest competitor, NextEra, built 15GW of wind capacity and has started to expand its utility-scale solar installations. Duke Energy owns and operates 2,900 MW of renewable energy, including wind and solar. Exelon operates 40 wind turbine sites across the U.S. that generate 1,500 MW.
Integrated Utilities Power Ahead
It’s easy to see why utility companies see wind as a competitive source of electricity compared to fossil fuels. As I explained in my previous post, Trump’s Wrong About Wind, the cost of building and generating wind energy have fallen significantly over the past decade. Meanwhile, improvements in battery storage and power management through new technological advancements have made it more reliable (Warren Buffett bet on that one too).
But what is also striking is that integrated power and transmission enables these utility companies to make those decisions; both in terms of sourcing power from renewable energy, as well as the pricing of the final product. Until wind and solar power are widespread, these utility companies are going to have an edge of the more fragmented ends of the industry who can’t make these purchasing or pricing decisions independently.
Warren Buffett very rarely misses a beat. He’s not the Oracle of Omaha for nothing. Berkshire Hathaway’s ownership of BHE has been immensely profitable for its shareholders. In the year ended December 31, 2019, BHE and its subsidiaries reported net income attributable to BHE shareholders of $2.95 billion.
There’s no question that renewable energy will transform the utility industry over the next decade. That change will be led by the likes of BHE, who have the power to invest, control and manage their own energy generation assets.
Related News