Future Fuels creates Pennsylvania clean coal project

By Business Wire


Arc Flash Training CSA Z462 - Electrical Safety Essentials

Our customized live online or in‑person group training can be delivered to your staff at your location.

  • Live Online
  • 6 hours Instructor-led
  • Group Training Available
Regular Price:
$249
Coupon Price:
$199
Reserve Your Seat Today
Future Fuels LLC has created a strategic investment with Immersive Media Corp. (IMC) in Future Power PA LLC, a wholly owned subsidiary of Future Fuels. The two parties intend to develop an electricity generation project using state-of-the-art clean coal gasification technology in Schuylkill County, Pennsylvania.

A strategic investment by IMC of $5 million should ensure adequate resources are available to successfully develop this project. The late Senator Jim Rhoades, who was familiar with the project from the start, stated, “We welcome clean power projects that utilize our abundant resources giving much-needed energy to our region.”

The joint venture aims to permit a small electricity generation facility which uses advanced IGCC (Integrated Gasification Combined Cycle) clean coal technology. Jim Palumbo, President of Quad 3 Engineering (an engineering firm working with Future Fuels on this project), stated, “Use of a local mine combined with low transmission costs for the electricity should provide the savings required to implement a technology far more eco-friendly than traditional methods.”

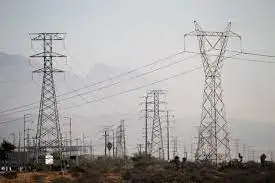
Pennsylvanians are faced with rising electric power costs as the rate cap system is expiring. “Demand for power has been growing while reliable supplies shrink due to older-style waste coal plants reaching the end of their useful lives. Schuylkill County, with its rich coal reserves, can prepare to meet the needs of its residents and even become an exporter of clean energy,” said Frank Zukas, President of the Schuylkill Economic Development Corporation (SEDCO).

Congressman Tim Holden supports the project and believes that “our nation needs to rely on all of our energy resources as a matter of economic and national security.”

State Representative Tim Seip, a member of the Environmental Resources and Energy Committee, points out, “The project falls right in line with the objectives of the Commonwealth’s recently passed $650 million energy bill. Projects like this will position Pennsylvania as a leader in clean energy solutions.”

Clean coal gasification technologies are deployed in many parts of the world but only in a few locations in the United States. The technology is an efficient and proven technique of converting coalÂ’s inherent energy to a liquid or gas instead of directly burning it as done in the past.

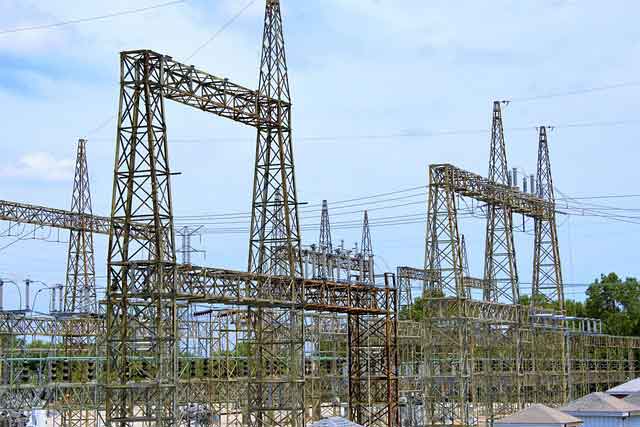
“We see this partnership as an opportunity for our shareholders to realize a better return for cash not immediately required by our core business. The United States energy infrastructure is strained and we can play a positive role in solving this with Future Fuels,” stated David Anderson, CFO of Immersive Media Corporation.

Related News

EIA expects solar and wind to be larger sources of U.S. electricity generation this summer

US Summer Electricity Outlook 2022 projects rising renewable energy generation as utility-scale solar and wind capacity additions surge, while coal declines and natural gas shifts amid higher fuel prices and regional supply constraints.


Key Points

An EIA forecast of summer 2022 power: more solar and wind, less coal, and shifting gas use amid higher fuel prices.

✅ Solar +10 million MWh; wind +8 million MWh vs last summer

✅ Coal generation -20 million MWh amid supply constraints, retirements

✅ Gas prices near $9/MMBtu; slight national gen decline


In our Summer Electricity Outlook, a supplement to our May 2022 Short-Term Energy Outlook, we expect the largest increases in U.S. electric power sector generation this summer will come from renewable energy sources such as wind and solar generation. These increases are the result of new capacity additions. We forecast utility-scale solar generation between June and August 2022 will grow by 10 million megawatthours (MWh) compared with the same period last summer, and wind generation will grow by 8 million MWh. Forecast generation from coal and natural gas declines by 26 million MWh this summer, although natural gas generation could increase in some electricity markets where coal supplies are constrained.

For recent context, overall U.S. power generation in January rose 9.3% year over year, the EIA reports.

Wind and solar power electric-generating capacity has been growing steadily in recent years. By the start of June, we estimate the U.S. electric power sector will have 65 gigawatts (GW) of utility-scale solar-generating capacity, a 31% increase in solar capacity since June 2021. Almost one-third of this new solar capacity will be built in the Texas electricity market. The electric power sector will also have an estimated 138 GW of wind capacity online this June, which is a 12% increase from last June.

Along with growth in renewables capacity, we expect that an additional 6 GW of new natural gas combined-cycle generating capacity will come online by June 2022, an increase of 2% from last summer. Despite this increase in capacity, we expect natural gas-fired electricity generation at the national level will be slightly (1.3%) lower than last summer.

We forecast the price of natural gas delivered to electric generators will average nearly $9 per million British thermal units between June and August 2022, which would be more than double the average price last summer. The higher expected natural gas prices and growth in renewable generation will likely lead to less natural gas-fired generation in some regions of the country.

In contrast to renewables and natural gas, the electricity industry has been steadily retiring coal-fired power plants over the past decade. Between June 2021 and June 2022, the electric power sector will have retired 6 GW (2%) of U.S. coal-fired generating capacity.

In previous years, higher natural gas prices would have resulted in more coal-fired electricity generation across the fleet. However, coal-fired power plants have been limited in their ability to replenish their historically low inventories in recent months as a result of mine closures, rail capacity constraints, and labor market tightness. These coal supply constraints, along with continued retirement of generating capacity, contribute to our forecast that U.S. coal-fired generation will decline by 20 million MWh (7%) this summer. In some regions of the country, these coal supply constraints may lead to increased natural gas-fired electricity generation despite higher natural gas prices.


Related News

View more

Energy Department Announces 20 New Competitors for the American-Made Solar Prize

American-Made Solar Prize Round 3 accelerates DOE-backed solar innovation, empowering entrepreneurs and domestic manufacturing with photovoltaics and grid integration support via National Laboratories, incubators, and investors to validate products, secure funding, and deploy backup power.


Key Points

A DOE challenge fast-tracking solar innovation to market readiness, boosting US manufacturing and grid integration.

✅ $50,000 awards to 20 teams for prototype validation

✅ Access to National Labs, incubators, investors, and mentors

✅ Focus on PV advances and grid integration solutions


The U.S. Department of Energy (DOE) announced the 20 competitors who have been invited to advance to the next phase of the American-Made Solar Prize Round 3, a competition designed to incentivize the nation’s entrepreneurs to strengthen American leadership in solar energy innovation and domestic manufacturing, a key front in the clean energy race today.

The American-Made Solar Prize is designed to help more American entrepreneurs thrive in the competitive global energy market. Each round of the prize brings new technologies to pre-commercial readiness in less than a year, ensuring new ideas enter the marketplace. As part of the competition, teams will have access to a network of DOE National Laboratories, technology incubators and accelerators, and related DOE efforts like next-generation building upgrades, venture capital firms, angel investors, and industry. This American-Made Network will help these competitors raise private funding, validate early-stage products, or test technologies in the field.

Each team will receive a $50,000 cash prize and become eligible to compete in the next phase of the competition. Through a rigorous evaluation process, teams were chosen based on the novelty of their ideas and how their solutions address a critical need of the solar industry. The teams were selected from 120 submissions and represent 11 states. These projects will tackle challenges related to new solar applications, like farming, as well as show how solar can be used to provide backup power when the grid goes down, aided by increasingly affordable batteries now reaching scale. Nine teams will advance solar photovoltaic technologies, and 11 will address challenges related to how solar integrates with the grid. The projects are as follows:

Photovoltaics:

  • Durable Antireflective and Self-Cleaning Glass (Pittsburgh, PA)
  • Pursuit Solar - More Power, Less Hassle (Denver, NC)
  • PV WaRD (San Diego, CA)
  • Remotely Deployed Solar Arrays (Charlottesville, VA)
  • Robotics Changing the Landscape for Solar Farms (San Antonio, TX)
  • TrackerSled (Chicago, IL)
  • Transparent Polymer Barrier Films for PV (Bristol, PA)
  • Solar for Snow (Duluth, MN)
  • SolarWall Power Tower (Buffalo, NY)


Systems Integration:

  • Affordable Local Solar Storage via Utility Virtual Power Plants (Parker, TX)
  • Allbrand Solar Monitor (Detroit, MI)
  • Beyond Monitoring – Next Gen Software and Hardware (Atlanta, GA)
  • Democratizing Solar with Artificial Intelligence Energy Management (Houston, TX)
  • Embedded, Multi-Function Maximum Power Point Tracker for Smart Modules (Las Vegas, NV)
  • Evergrid: Keep Solar Flowing When the Grid Is Down (Livermore, CA)
  • Inverter Health Scan (San Jose, CA)
  • JuiceBox: Integrated Solar Electricity for Americans Transitioning out of Homelessness and Recovering from Natural Disasters (Claremont, CA)
  • Low-Cost Parallel-Connected DC Power Optimizer (Blacksburg, VA)
  • Powerfly: A Plug-and-Play Solar Monitoring Device (Berkeley, CA)
  • Simple-Assembly Storage Kit (San Antonio, TX)

Read the descriptions of the projects to see how they contribute to efforts to improve solar and wind power worldwide.

Over the next six months, these teams will fast-track their efforts to identify, develop, and test disruptive solutions amid record solar and storage growth projected nationwide. During a national demonstration day at Solar Power International in September 2020, a panel of judges will select two final winners who will receive a $500,000 prize. Learn more at the American-Made Solar Prize webpage.

The American-Made Challenges incentivize the nation's entrepreneurs to strengthen American leadership in energy innovation and domestic manufacturing. These new challenges seek to lower the barriers U.S.-based innovators face in reaching manufacturing scale by accelerating the cycles of learning from years to weeks while helping to create partnerships that connect entrepreneurs to the private sector and the network of DOE’s National Laboratories across the nation, alongside recent wind energy awards that complement solar innovation.

Go here to learn how this work aligns with a tenfold solar expansion being discussed nationally.

https://www.energy.gov/eere/solar/solar-energy-technologies-office


Related News

View more

Climate change: Greenhouse gas concentrations again break records

Rising Greenhouse Gas Concentrations drive climate change, with CO2, methane, and nitrous oxide surging; WMO data show higher radiative forcing, elevated pre-industrial baselines, and persistent atmospheric concentrations despite Paris Agreement emissions pledges.


Key Points

Increasing atmospheric CO2, methane, and nitrous oxide levels that raise radiative forcing and drive warming.

✅ WMO data show CO2 at 407.8 ppm in 2018, above decade average

✅ Methane and nitrous oxide surged, elevating total radiative forcing

✅ Concentrations differ from emissions; sinks absorb about half


The World Meteorological Organization (WMO) says the increase in CO2 was just above the average rise recorded over the last decade.

Levels of other warming gases, such as methane and nitrous oxide, have also surged by above average amounts.

Since 1990 there's been an increase of 43% in the warming effect on the climate of long lived greenhouse gases.

The WMO report looks at concentrations of warming gases in the atmosphere rather than just emissions.

The difference between the two is that emissions refer to the amount of gases that go up into the atmosphere from the use of fossil fuels, such as burning coal for coal-fired electricity generation and from deforestation.

Concentrations are what's left in the air after a complex series of interactions between the atmosphere, the oceans, the forests and the land. About a quarter of all carbon emissions are absorbed by the seas, and a similar amount by land and trees, while technologies like carbon capture are being explored to remove CO2.

Using data from monitoring stations in the Arctic and all over the world, researchers say that in 2018 concentrations of CO2 reached 407.8 parts per million (ppm), up from 405.5ppm a year previously.

This increase was above the average for the last 10 years and is 147% of the "pre-industrial" level in 1750.

The WMO also records concentrations of other warming gases, including methane and nitrous oxide, and some countries have reported declines in certain potent gases, as noted in US greenhouse gas controls reports, though global levels remain elevated. About 40% of the methane emitted into the air comes from natural sources, such as wetlands, with 60% from human activities, including cattle farming, rice cultivation and landfill dumps.

Methane is now at 259% of the pre-industrial level and the increase seen over the past year was higher than both the previous annual rate and the average over the past 10 years.

Nitrous oxide is emitted from natural and human sources, including from the oceans and from fertiliser-use in farming. According to the WMO, it is now at 123% of the levels that existed in 1750.

Last year's increase in concentrations of the gas, which can also harm the ozone layer, was bigger than the previous 12 months and higher than the average of the past decade.

What concerns scientists is the overall warming impact of all these increasing concentrations. Known as total radiative forcing, this effect has increased by 43% since 1990, and is not showing any indication of stopping.

There is no sign of a slowdown, let alone a decline, in greenhouse gases concentration in the atmosphere despite all the commitments under the Paris agreement on climate change and the ongoing global energy transition efforts," said WMO Secretary-General Petteri Taalas.

"We need to translate the commitments into action and increase the level of ambition for the sake of the future welfare of mankind," he added.

"It is worth recalling that the last time the Earth experienced a comparable concentration of CO2 was three to five million years ago. Back then, the temperature was 2-3C warmer, sea level was 10-20m higher than now," said Mr Taalas.

The UN Environment Programme will report shortly on the gap between what actions countries are taking to cut carbon, for example where Australia's emissions rose 2% recently, and what needs to be done to keep under the temperature targets agreed in the Paris climate pact.

Preliminary findings from this study, published during the UN Secretary General's special climate summit last September, indicated that emissions continued to rise during 2018, although global emissions flatlined in 2019 according to the IEA.

Both reports will help inform delegates from almost 200 countries who will meet in Madrid next week for COP25, following COP24 in Katowice the previous year, the annual round of international climate talks.


Related News

View more

Trudeau vows to regulate oil and gas emissions, electric car sales

Canada Oil and Gas Emissions Cap sets five-year targets to cut sector emissions toward net-zero by 2050, alongside an EV mandate, carbon pricing signals, and support for carbon capture, clean energy jobs, climate policy.


Key Points

A federal policy to regulate and reduce oil and gas emissions via 5-year targets, reaching net-zero by 2050.

✅ Regulated 5-year milestones to cut oil and gas emissions to net-zero by 2050

✅ Interim EV mandate: 50% by 2030; 100% zero-emission sales by 2035

✅ $2B fund for clean energy jobs in oil- and gas-reliant communities


Liberal Leader Justin Trudeau vowed to regulate total emissions from Canada’s oil and gas producers as he laid out his first major climate change promises of the campaign Sunday, a plan that was welcomed by several environmental and climate organizations.

Trudeau said that if re-elected, the Liberals will set out regulated five-year targets for emissions from oil and gas production to get them to net-zero emissions by 2050, a goal that, according to an IEA report will require more electricity, but also create a $2 billion fund to create jobs in oil and gas-reliant communities in Alberta, Saskatchewan and Newfoundland and Labrador.

“Let’s be realistic, over a quarter of Canada’s emissions come from our oil and gas sector. We need the leadership of these industries to decarbonize our country,” Trudeau said.

“That’s why we’ll make sure oil and gas emissions don’t increase and instead go down with achievable milestones,” while ensuring local economies can prosper.“

The Liberals are also introducing an interim electric vehicle mandate, which will require half the cars sold in Canada to be zero-emission by 2030, and because cleaning up electricity is critical to meeting climate pledges, the policy pairs with power-sector decarbonization, ahead of the final mandated target of 100 per cent by 2035.

Trudeau spoke in Cambridge, Ont., where protesters once again made an appearance amid a visible police presence. Officers carried one woman off the property when she refused to leave when asked.

Trudeau alluded to the protesters and their actions, which included sounding sirens and chanting expletives, as he defended his government’s record on climate change including progress in the electricity sector nationally, and touted its new plan.

“Sirens in the background may remind us that this is a climate emergency. That’s why we will move faster and be bolder,” he said.

Canada’s largest oilsands producers have already committed to reaching net zero greenhouse gas emissions by 2050, but the policy proposed Sunday “calls the oil companies’ bluff” by making those goals a legislated requirement, said Keith Stewart, senior energy strategist with Greenpeace Canada.

The new timeline for electric vehicles also “sends a clear signal to auto companies to get cracking (and build them here),” he said on Twitter, even as proposals like a fully renewable grid by 2030 are debated today. “We’d like to see this happen faster but the shift away from voluntary targets to requirements is big.”


Merran Smith, executive director of Clean Energy Canada, a climate program at Simon Fraser University, said clean electricity, clean transportation and “phasing out oil and gas with accountable milestones” must be key priorities over the next decade, aligning with Canada’s race to net-zero and the role of renewable energy.

“Today’s announcement, which checks all of these boxes, is not just good ambition_it’s good policy. Policy that will drive down carbon pollution and drive up clean job growth and economic competitiveness. It is policy that will drive Canada forward with cleaner cars, power Canada with clean electricity, and invest in businesses that will last such as battery manufacturing, electric vehicle manufacturing and low carbon steel,” Smith said in an email.

Michael Bernstein, executive director of the climate policy organization Clean Prosperity, said the promises laid out Sunday offer a “strong boost” to the federal government’s previous climate commitments.

He said the organization prefers market incentives such as carbon pricing, that spur innovation over further regulation. But since the largest oilsands companies have already committed to reaching net-zero emissions, he said the newly unveiled policy could provide some support.

“ First, I would encourage the Liberal Party to release independent modelling showing the types of emissions reductions they expect to achieve with their new package of policies. Second, many policies are referred to in general terms so I hope the Liberal Party will provide further details in the coming days,” he said.

“Finally, the document does not specifically mention carbon capture or carbon dioxide removal technologies but both technologies will be critical to achieve some of the pledges in today’s announcement, especially reaching net-zero emissions in the oil a gas sector.”

NDP Leader Jagmeet Singh painted the announcement as the latest in a string of “empty promises” from the Liberals on climate change, saying Canada has the highest increase in greenhouse gas emissions among all G7 countries, and that provinces like B.C. risk missing 2050 targets as well, he argued.

“Climate targets mean nothing when you don’t act on them. We can’t afford more of Justin Trudeau’s empty words on climate change,” he said in a statement.

The Trudeau Liberals submitted new targets to the United Nations in July, promising that Canada will curb emissions by 40 to 45 per cent from 2005 levels by 2030, building on the net-zero by 2050 plan announced earlier, officials say.


Related News

View more

Shell says electricity to meet 60 percent of China's energy use by 2060

China 2060 Carbon-Neutral Energy Transition projects tripled electricity, rapid electrification, wind and solar dominance, scalable hydrogen, CCUS, and higher carbon pricing to meet net-zero goals while decarbonizing heavy industry and transport.


Key Points

Shell's outlook for China to reach net zero by 2060 via electrification, renewables, hydrogen, CCUS, and carbon pricing.

✅ Power supply to 60% of energy; generation triples by 2060.

✅ Wind and solar reach 80% of electricity; coal declines sharply.

✅ Hydrogen scales to 17 EJ; CCUS and carbon pricing expand.


China may triple electricity generation to supply 60 percent of the country's total energy under Beijing's carbon-neutral goal by 2060, up from the current 23 per cent, according to Royal Dutch Shell.

Shell is one of the largest global investors in China's energy sector, with business covering gas production, petrochemicals and a retail fuel network. A leading supplier of liquefied natural gas, it has recently expanded into low-carbon business such as hydrogen power and electric vehicle charging.

In a rare assessment of the country's energy sector by an international oil major, Shell said China needed to take quick action this decade to stay on track to reach the carbon-neutrality goal.

China has mapped out plans to reach peak emissions by 2030, and aims to reduce coal power production over the coming years, but has not yet revealed any detailed carbon roadmap for 2060.

This includes investing in a reliable and renewable power system, including compressed air generation, and demonstrating technologies that transform heavy industry using hydrogen, biofuel and carbon capture and utilization.

"With early and systematic action, China can deliver better environmental and social outcomes for its citizens while being a force for good in the global fight against climate change," Mallika Ishwaran, chief economist of Shell International, told a webinar hosted by the company's China business.

Shell expects China's electricity generation to rise three-fold to more than 60 exajoules (EJ) in 2060 from 20 EJ in 2020, even amid power supply challenges reported recently.

Solar and wind power are expected to surpass coal as the largest sources of electricity by 2034 in China, reflecting projections that renewables will eclipse coal globally by mid-decade, versus the current 10 percent, rising to 80 percent by 2060, Shell said.

Hydrogen is expected to scale up to 17 EJ, or equivalent to 580 million tonnes of coal by 2060, up from almost negligible currently, adding over 85 percent of the hydrogen will be produced through electrolysis, supported by PEM hydrogen R&D across the sector, powered by renewable and nuclear electricity, Shell said.

Hydrogen will meet 16 percent of total energy use in 2060 with heavy industry and long-distance transport as top hydrogen users, the firm added.

The firm also expects China's carbon price to rise to 1,300 yuan (CDN$256.36) per tonne in 2060 from 300 yuan in 2030.

Nuclear, on a steady development track, and biomass will have niche but important roles for power generation in the years to come, Shell said.

Electricity generated from biomass, combined with carbon, capture, utilization and storage (CCUS), provide a source of negative emissions for the rest of the energy system from 2053, it added.


Related News

View more

U.S. Residents Averaged Fewer Power Outages in 2022

2022 U.S. Power Outage Statistics show lower SAIDI as fewer major events hit, with SAIFI trends, electric reliability, outage duration and frequency shaped by hurricanes, winter storms, vegetation, and utility practices across states.


Key Points

They report SAIDI and SAIFI for 2022, showing outage duration, frequency, and impacts of major weather events.

✅ 2022 SAIDI averaged 5.6 hours; SAIFI averaged 1.4 interruptions.

✅ Fewer major events lowered outage duration versus 2021.

✅ Hurricanes and winter storms drove long outages in several states.


In 2022, U.S. electricity consumers on average experienced about 5.5 hours of power disruptions, a decrease from nearly two hours compared to 2021. This information comes from the latest Annual Electric Power Industry Report. The reduction in yearly power interruptions primarily resulted from fewer significant events in 2022 compared to the previous year, and utility disaster planning continues to support grid resilience as severe weather persists.

Since 2013, excluding major events, the annual average duration of power interruptions has consistently hovered around two hours. Factors contributing to major power disruptions include weather-related incidents, vegetation interference near power lines, and specific utility practices, while pandemic-related grid operations influenced workforce planning more than outage frequency. To assess the reliability of U.S. electric utilities, two key indexes are utilized:

  • The System Average Interruption Duration Index (SAIDI) calculates the total length (in hours) an average customer endures non-brief power interruptions over a year.
  • The System Average Interruption Frequency Index (SAIFI) tracks the number of times interruptions occur.

The influence of major events on electrical reliability is gauged by comparing affected states' SAIDI and SAIFI values against the U.S. average, which was 5.6 hours of outages and 1.4 outages per customer in 2022. The year witnessed 18 weather-related disasters in the U.S., each resulting in over $1 billion in damages, and COVID-19 grid assessments indicated the electricity system was largely safe from pandemic impacts. Noteworthy major events include:

  • Hurricane Ian in September 2022, leaving over 2.6 million Floridian customers without electricity, with restoration in some areas taking weeks rather than days.
  • Hurricane Nicole in November 2022, causing over 300,000 Florida customers to lose power.
  • Winter Storm Elliott in December 2022, affecting over 1.5 million customers in multiple states including Texas where utilities struggled after Hurricane Harvey to restore service, and Florida, and bringing up to four feet of snow in parts of New York.

In 2022, states like Florida, West Virginia, Maine, Vermont, and New Hampshire experienced the most prolonged power interruptions, with New Hampshire averaging 10.3 hours and Florida 19.1 hours, and FPL's Irma storm response illustrates how restoration can take days or weeks in severe cases. Conversely, the District of Columbia, Delaware, Rhode Island, Nebraska, and Iowa had the shortest total interruptions, with the District of Columbia averaging just 34 minutes and Iowa 85 minutes.

The frequency of outages, unlike their duration, is more often linked to non-major events. Across the nation, Alaska recorded the highest number of power disruptions per customer (averaging 3.5), followed by several heavily forested states like Tennessee and Maine. Power outages due to falling tree branches are common, particularly during winter storms that burden tree limbs and power lines, as seen in a North Seattle outage affecting 13,000 customers. The District of Columbia stood out with the shortest and fewest outages per customer.


Related News

View more

Sign Up for Electricity Forum’s Newsletter

Stay informed with our FREE Newsletter — get the latest news, breakthrough technologies, and expert insights, delivered straight to your inbox.

Electricity Today T&D Magazine Subscribe for FREE

Stay informed with the latest T&D policies and technologies.
  • Timely insights from industry experts
  • Practical solutions T&D engineers
  • Free access to every issue

Download the 2025 Electrical Training Catalog

Explore 50+ live, expert-led electrical training courses –

  • Interactive
  • Flexible
  • CEU-cerified