CO2 Removal Technologies address climate change via negative emissions, including carbon capture, reforestation, soil carbon, biochar, BECCS, DAC, and mineralization, helping meet Paris Agreement targets while managing costs, land use, and infrastructure demands.
Key Points
Methods to extract or sequester atmospheric CO2, combining natural and engineered approaches to limit warming.
✅ Includes reforestation, soil carbon, biochar, BECCS, DAC, mineralization
✅ Balances climate goals with costs, land, energy, and infrastructure
✅ Key to Paris Agreement targets under 1.5-2.0 °C warming
The world is, on average, 1.1 degrees Celsius warmer today than it was in 1850. If this trend continues, our planet will be 2 – 3 degrees hotter by the end of this century, according to the Intergovernmental Panel on Climate Change (IPCC).
The main reason for this temperature rise is higher levels of atmospheric carbon dioxide, which cause the atmosphere to trap heat radiating from the Earth into space. Since 1850, the proportion of CO2 in the air has increased, with record greenhouse gas concentrations documented, from 0.029% to 0.041% (288 ppm to 414 ppm).
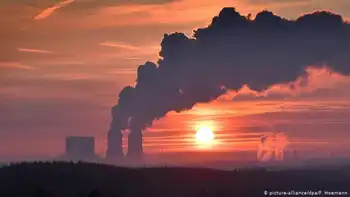
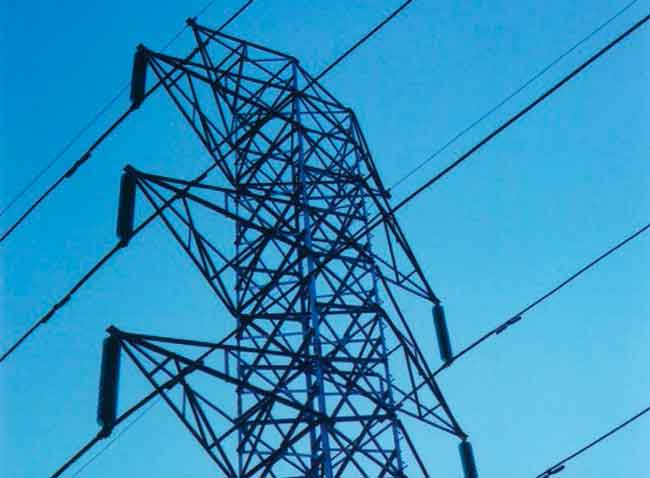
This is directly related to the burning of coal, oil and gas, which were created from forests, plankton and plants over millions of years. Back then, they stored CO2 and kept it out of the atmosphere, but as fossil fuels are burned, that CO2 is released. Other contributing factors include industrialized agriculture and slash-and-burn land clearing techniques, and emissions from SF6 in electrical equipment are also concerning today.
Over the past 50 years, more than 1200 billion tons of CO2 have been emitted into the planet's atmosphere — 36.6 billion tons in 2018 alone, though global emissions flatlined in 2019 before rising again. As a result, the global average temperature has risen by 0.8 degrees in just half a century.
Atmospheric CO2 should remain at a minimum
In 2015, the world came together to sign the Paris Climate Agreement which set the goal of limiting global temperature rise to well below 2 degrees — 1.5 degrees, if possible.
The agreement limits the amount of CO2 that can be released into the atmosphere, providing a benchmark for the global energy transition now underway. According to the IPCC, if a maximum of around 300 billion tons were emitted, there would be a 50% chance of limiting global temperature rise to 1.5 degrees. If CO2 emissions remain the same, however, the CO2 'budget' would be used up in just seven years.
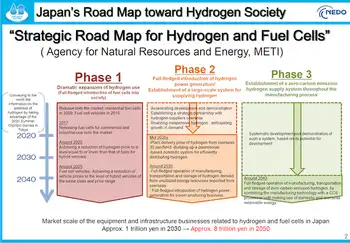
According to the IPCC's report on the 1.5 degree target, negative emissions are also necessary to achieve the climate targets.
Using reforestation to remove CO2
One planned measure to stop too much CO2 from being released into the atmosphere is reforestation. According to studies, 3.6 billion tons of CO2 — around 10% of current CO2 emissions — could be saved every year during the growth phase. However, a study by researchers at the Swiss Federal Institute of Technology, ETH Zurich, stresses that achieving this would require the use of land areas equivalent in size to the entire US.
Young trees at a reforestation project in Africa (picture-alliance/OKAPIA KG, Germany)
Reforestation has potential to tackle the climate crisis by capturing CO2. But it would require a large amount of space
More humus in the soil
Humus in the soil stores a lot of carbon. But this is being released through the industrialization of agriculture. The amount of humus in the soil can be increased by using catch crops and plants with deep roots as well as by working harvest remnants back into the ground and avoiding deep plowing. According to a study by the German Institute for International and Security Affairs (SWP) on using targeted CO2 extraction as a part of EU climate policy, between two and five billion tons of CO2 could be saved with a global build-up of humus reserves.
Biochar shows promise
Some scientists see biochar as a promising technology for keeping CO2 out of the atmosphere. Biochar is created when organic material is heated and pressurized in a zero or very low-oxygen environment. In powdered form, the biochar is then spread on arable land where it acts as a fertilizer. This also increases the amount of carbon content in the soil. According to the same study from the SWP, global application of this technology could save between 0.5 and two billion tons of CO2 every year.
Storing CO2 in the ground
Storing CO2 deep in the Earth is already well-known and practiced on Norway's oil fields, for example. However, the process is still controversial, as storing CO2 underground can lead to earthquakes and leakage in the long-term. A different method is currently being practiced in Iceland, in which CO2 is sequestered into porous basalt rock to be mineralized into stone. Both methods still require more research, however, with new DOE funding supporting carbon capture, utilization, and storage.
Capturing CO2 to be held underground is done by using chemical processes which effectively extract the gas from the ambient air, and some researchers are exploring CO2-to-electricity concepts for utilization. This method is known as direct air capture (DAC) and is already practiced in other parts of Europe. As there is no limit to the amount of CO2 that can be captured, it is considered to have great potential. However, the main disadvantage is the cost — currently around €550 ($650) per ton. Some scientists believe that mass production of DAC systems could bring prices down to €50 per ton by 2050. It is already considered a key technology for future climate protection.
The inside of a carbon capture facility in the Netherlands (RWE AG)
Carbon capture facilities are still very expensive and take up a huge amount of space
Another way of extracting CO2 from the air is via biomass. Plants grow and are burned in a power plant to produce electricity. CO2 is then extracted from the exhaust gas of the power plant and stored deep in the Earth, with new U.S. power plant rules poised to test such carbon capture approaches.
The big problem with this technology, known as bio-energy carbon capture and storage (BECCS) is the huge amount of space required. According to Felix Creutzig from the Mercator Institute on Global Commons and Climate Change (MCC) in Berlin, it will therefore only play "a minor role" in CO2 removal technologies.
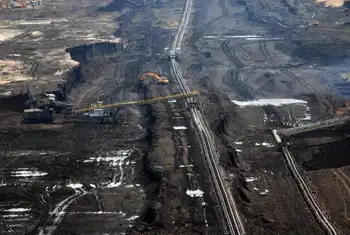
CO2 bound by rock minerals
In this process, carbonate and silicate rocks are mined, ground and scattered on agricultural land or on the surface water of the ocean, where they collect CO2 over a period of years. According to researchers, by the middle of this century it would be possible to capture two to four billion tons of CO2 every year using this technique. The main challenges are primarily the quantities of stone required, and building the necessary infrastructure. Concrete plans have not yet been researched.
Not an option: Fertilizing the sea with iron
The idea is use iron to fertilize the ocean, thereby increasing its nuturient content, which would allow plankton to grow stronger and capture more CO2. However, both the process and possible side effects are very controversial. "This is rarely treated as a serious option in research," concludes SWP study authors Oliver Geden and Felix Schenuit.
Related News