WAPA buying wind power from Basin

By Associated Press


NFPA 70b Training - Electrical Maintenance

Our customized live online or in‑person group training can be delivered to your staff at your location.

  • Live Online
  • 12 hours Instructor-led
  • Group Training Available
Regular Price:
$599
Coupon Price:
$499
Reserve Your Seat Today
The agency that distributes hydroelectric power generated by Missouri River dams is planning to buy wind power for the first time.

The Western Area Power Administration says its deal to buy up to 50 megawatts of wind power per year from Bismarck-based Basin Electric Power Cooperative for three years is a "precedent setting" way to meet its power demands and support renewable energy.

Financial details were not released. WAPA says it will buy the power from 2010 through 2012.

Drought has plagued the Missouri River Basin for eight straight years, lowering electricity production. The six power plants on the river generated a record low amount of electricity in July, the U.S. Army Corps of Engineers says. Total energy production this year is expected to be half the normal amount, down to 5 billion kilowatt hours.

WAPA, one of four such agencies within the U.S. Department of Energy, sells power to cities, rural electric co-ops, American Indian tribes, federal and state agencies, and other nonprofit providers. When it cannot fulfill its contracts with hydropower, it must buy power elsewhere.

"Our greatest challenge is to purchase replacement energy at the least cost to our customers and also minimize our exposure to short-term market risks," said Jody Sundsted, the power marketing manager for WAPA's Upper Great Plains Region.

WAPA markets power in 15 central and western states. WAPA spokeswoman Carolyn Hinkley said the wind power it will buy from Basin will be used to supplement electricity for Upper Great Plains customers in North Dakota, South Dakota, Montana, Minnesota, Iowa and part of Nebraska.

Basin works with WAPA to supply 126 member rural electric systems in nine states, which in turn distribute electricity to about 2.6 million consumers.

"Basin Electric and Western have a long history of working together," said Wayne Backman, Basin's senior vice president of generation. "The contract to provide Western with wind energy... continues that long-term good working relationship."

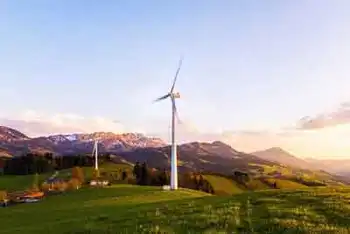
Most of Basin's electric supply is generated by coal-powered plants. The co-op owns two wind turbines near Minot and two near Chamberlain, S.D., and buys the energy output of wind farms operated by Florida-based FPL Energy LLC near Edgeley and Wilton in North Dakota and Highmore in South Dakota.

An expansion is planned at the Wilton Wind Energy Center, and a Basin subsidiary is developing a new wind farm near Minot. When all the systems are operational, they will produce 300 megawatts of electricity, Basin spokesman Daryl Hill said. One megawatt is enough to power 800 typical residential homes.

"There's lots of wind going on in our neck of the woods," Hill said.

Hinkley said WAPA might buy more wind power in the future. The agency expects to soon gauge interest among renewable energy producers for a contract as long as 15 years.

Related News

Snohomish PUD Hikes Rates Due to Severe Weather Impact

Snohomish PUD rate increase addresses storm recovery after a bomb cyclone and extended cold snap, stabilizing finances and grid reliability while offering assistance programs, payment plans, and energy efficiency for customers.


Key Points

Temp 5.8% residential hike in Feb 2025 to recover storm costs, meet cold snap demand, and uphold reliable service.

✅ 5.8% residential increase effective Feb 2025

✅ Driven by bomb cyclone damage and cold snap demand

✅ Aid includes payment plans, efficiency rebates, low income support


In early February 2025, the Snohomish County Public Utility District (PUD) announced a temporary increase in electricity rates to offset the financial impact of severe weather events, including a bomb cyclone and an extended cold snap, that occurred in late 2024. This decision aims to stabilize the utility's finances, a pattern seen at other utilities such as Florida Power & Light, which pursued a hurricane surcharge to recover storm costs, while ensuring continued service reliability for its customers.

Background of the Weather Events

In November 2024, the Pacific Northwest experienced a powerful bomb cyclone—a rapidly intensifying storm characterized by a significant drop in atmospheric pressure. This event brought heavy rainfall, strong winds, and widespread power outages across the region. Compounding the situation, a prolonged cold weather period in December 2024 and January 2025 led to increased energy demand, and similar conditions drove up Pennsylvania power rates in the same winter season, as residents and businesses relied heavily on heating systems.

Impact on Snohomish PUD

The combination of the bomb cyclone and the subsequent cold weather placed considerable strain on the Snohomish PUD's infrastructure and financial resources. The utility incurred substantial costs for emergency repairs, restoration efforts, and the procurement of additional electricity to meet the heightened demand during the cold snap. These unforeseen expenses prompted the PUD to seek a temporary rate adjustment to maintain financial stability and continue providing reliable service to its customers.

Details of the Rate Increase

Effective February 2025, the Snohomish PUD implemented a temporary electricity rate increase of 5.8% for residential customers, compared with a 3% BC Hydro increase in the same region for context. This adjustment is designed to recover the additional costs incurred during the severe weather events. The PUD has communicated that this rate increase is temporary and will be reevaluated after a specified period to determine if further adjustments are necessary.

Customer Impact and Assistance Programs

While the rate increase is intended to be temporary, it may still pose a financial burden for some customers, even as some markets expect rates to stabilize in 2025 in other jurisdictions. To mitigate this impact, the Snohomish PUD has outlined several assistance programs:

  • Payment Plans: Customers facing financial hardship can enroll in extended payment plans to spread the cost of the increased rates over a longer period.

  • Energy Efficiency Programs: The PUD offers incentives and resources to help customers reduce energy consumption, potentially lowering their overall bills.

  • Low-Income Assistance: Eligible low-income customers may qualify for additional support through state and federal assistance programs.

The utility encourages customers to contact their customer service department to explore these options and find the best solutions for their individual circumstances.

Community Response and Future Considerations

The announcement of the rate increase has elicited mixed reactions from the community. Some residents express understanding, recognizing the necessity of maintaining infrastructure and service reliability. Others have voiced concerns about the financial impact, particularly among vulnerable populations, a debate also seen with higher BC Hydro rates in nearby British Columbia.

Looking ahead, the Snohomish PUD is committed to enhancing its infrastructure to better withstand future extreme weather events, an approach aligned with other utilities' multi-year rate proposals to fund upgrades. This includes investing in grid modernization, implementing advanced weather forecasting tools, and developing comprehensive emergency response plans. The utility also plans to engage with the community through public forums and surveys to gather feedback and collaboratively develop strategies that balance financial sustainability with customer affordability.

The temporary electricity rate increase by the Snohomish County Public Utility District reflects the financial challenges posed by severe weather events and parallels regional trends, including BC Hydro's 3.75% over two years adjustments, and underscores the importance of proactive infrastructure investment and community engagement. While the rate adjustment aims to stabilize the utility's finances, the PUD remains focused on supporting its customers through assistance programs and ongoing efforts to enhance service reliability and resilience against future climate-related events.


Related News

View more

Canada and Manitoba invest in new turbines

Manitoba Clean Electricity Investment will upgrade hydroelectric turbines, expand a 230 kV transmission network, and deliver reliable, affordable low-carbon power, reducing greenhouse gas emissions and strengthening grid reliability across Portage la Prairie and Winnipeg River.


Key Points

Joint federal-provincial funding to upgrade hydro turbines and build a 230 kV grid, boosting reliable, low-carbon power.

✅ $314M for new turbines at Pointe du Bois (+52 MW capacity)

✅ $161.6M for 230 kV transmission in Portage la Prairie

✅ Cuts Brandon Generating Station emissions by ~37%


The governments of Canada and Manitoba have announced a joint investment of $475.6 million to strengthen Manitoba’s clean electricity grid that can support neighboring provinces with clean power and ensure continued supply of affordable and reliable low-carbon energy.

This federal-provincial investment provides $314 million for eight new hydroelectric turbines at the 75 MW Pointe du Bois Generating Station on the Winnipeg River, as well as $161.6 million to build a new 230 kV transmission network in the Portage la Prairie area, bolstering power sales to SaskPower and regional reliability.

The $314 million joint investment in the Pointe du Bois Renewable Energy Project includes $114.1 million from the Government of Canada and nearly $200 million from the Government of Manitoba. The joint investment will enable Manitoba Hydro to replace eight generating units that are at the end of their lifecycle, amid looming new generation needs for the province. The new, more efficient units will increase the capacity of the Pointe du Bois generating station by 52 MW.

The $161.6 million joint investment in the Portage Area Capacity Enhancement project includes $70.9 million from the Government of Canada and $90.6 million from the Government of Manitoba. The joint investment will support the construction of a new transmission line to enhance reliability for customers across southwest Manitoba and help Manitoba Hydro meet increasing demand, with projections that demand could double over the next two decades. By decreasing Manitoba’s reliance on its last grid-connected fossil-fuel generating station, this investment will reduce greenhouse gas emissions at the Brandon Generating Station by about 37%.

The federal government’s total contribution of $184.9 million is provided through the Green Infrastructure Stream of the Investing in Canada Plan, alongside efforts to improve interprovincial grid integration such as NB Power agreements with Hydro-Quebec that strengthen regional reliability. This federal funding is conditional on meeting Indigenous consultation requirements, as well as environmental assessment obligations. Including today’s announcement, the Green Infrastructure Stream has supported 38 infrastructure projects in Manitoba, for a total federal contribution of more than $766.8 million and a total provincial contribution of over $658.4 million.

“A key part of our economic plan is making Canada a clean electricity superpower. Today’s announcement in Manitoba will deliver clean, reliable, and affordable electricity to people and businesses across the province—and we will continue working to expand our clean electricity grid and create great careers for people from coast to coast to coast,” said Deputy Prime Minister and Finance Minister Chrystia Freeland.

The federal government will continue to invest in making Canada a clean electricity superpower, supporting provincial initiatives like Hydro-Quebec's fossil-free strategy that complement these investments to ensure Canadians from coast to coast to coast have the affordable and reliable clean electricity they need today and for generations to come.

“Manitoba Hydro is extremely pleased to be receiving this federal funding through the Green Infrastructure Stream of the Investing in Canada Infrastructure Program. The investments we are making in both these critical infrastructure projects will help provide Manitobans with energy for life and power our province’s economic growth with clean, reliable, renewable hydroelectricity. These projects build on our legacy of investments in renewable energy over the past 100 years, as we work towards a lower carbon future for all Manitobans,” said Jay Grewal, president and chief executive officer of Manitoba Hydro.

About 97% of Manitoba’s electricity is generated from clean hydro, with most of the remaining 3% coming from wind generation. Manitoba’s abundant clean electricity has resulted in Manitobans paying 9.455 ¢/kWh — the second-lowest electricity rate in Canada, though limits on serving new energy-intensive customers have been flagged recently.


Related News

View more

China power cuts: What is causing the country's blackouts?

China Energy Crisis drives electricity shortages, power cuts, and blackouts as coal prices surge, carbon-neutrality rules tighten, and manufacturing hubs ration energy, disrupting supply chains and industrial output ahead of winter demand peaks.


Key Points

A power shortfall from costly coal, price caps, and emissions targets, causing blackouts and industrial rationing.

✅ Coal prices soar while electricity tariffs are capped

✅ Factories in northeast hubs face rationing and downtime

✅ Supply chains risk delays ahead of winter demand


China is struggling with a severe shortage of electricity which has left millions of homes and businesses hit by power cuts.

Blackouts are not that unusual in the country but this year a number of factors have contributed to a perfect storm for electricity suppliers, including surging electricity demand globally.

The problem is particularly serious in China's north eastern industrial hubs as winter approaches - and is something that could have implications for the rest of the world.

Why has China been hit by power shortages?
The country has in the past struggled to balance electricity supplies with demand, which has often left many of China's provinces at risk of power outages.

During times of peak power consumption in the summer and winter the problem becomes particularly acute.

But this year a number of factors have come together to make the issue especially serious.

As the world starts to reopen after the pandemic, demand for Chinese goods is surging and the factories making them need a lot more power, highlighting China's electricity appetite in recent months.

Rules imposed by Beijing as it attempts to make the country carbon neutral by 2060 have seen coal production slow, even as the country still relies on coal for more than half of its power and as low-emissions generation is set to cover most global demand growth.

And as electricity demand has risen, the price of coal has been pushed up.

But with the government strictly controlling electricity prices, coal-fired power plants are unwilling to operate at a loss, with many drastically reducing their output instead.

Who is being affected by the blackouts?
Homes and businesses have been affected by power cuts as electricity has been rationed in several provinces and regions.

A coal-burning power plant can be seen behind a factory in China"s Inner Mongolia Autonomous Region

The state-run Global Times newspaper said there had been outages in four provinces - Guangdong in the south and Heilongjiang, Jilin and Liaoning in the north east. There are also reports of power cuts in other parts of the country.

Companies in major manufacturing areas have been called on to reduce energy usage during periods of peak demand or limit the number of days that they operate.

Energy-intensive industries such as steel-making, aluminium smelting, cement manufacturing and fertiliser production are among the businesses hardest hit by the outages.

What has the impact been on China's economy?
Official figures have shown that in September 2021, Chinese factory activity shrunk to the lowest it had been since February 2020, when power demand dropped as coronavirus lockdowns crippled the economy.

Concerns over the power cuts have contributed to global investment banks cutting their forecasts for the country's economic growth.

Goldman Sachs has estimated that as much as 44% of the country's industrial activity has been affected by power shortages. It now expects the world's second largest economy to expand by 7.8% this year, down from its previous prediction of 8.2%.

Globally, the outages could affect supply chains, including solar supply chains as the end-of-the-year shopping season approaches.

Since economies have reopened, retailers around the world have already been facing widespread disruption amid a surge in demand for imports.

China's economic planner, the National Development and Reform Commission (NDRC), has outlined a number of measures to resolve the problem, with energy supplies in the northeast of the country as its main priority this winter.

The measures include working closely with generating firms to increase output, ensuring full supplies of coal and promoting the rationing of electricity.

The China Electricity Council, which represents generating firms, has also said that coal-fired power companies were now "expanding their procurement channels at any cost" in order to guarantee winter heat and electricity supplies.

However, finding new sources of coal imports may not be straightforward.

Russia is already focused on its customers in Europe, Indonesian output has been hit by heavy rains and nearby Mongolia is facing a shortage of road haulage capacity,

Are energy shortages around the world connected?
Power cuts in China, UK petrol stations running out of fuel, energy bills jumping in Europe, near-blackouts in Japan and soaring crude oil, natural gas and coal prices on wholesale markets - it would be tempting to assume the world is suddenly in the grip of a global energy drought.

However, it is not quite as simple as that - there are some distinctly different issues around the world.

For example, in the UK petrol stations have run dry as motorists rushed to fill up their vehicles over concerns that a shortage of tanker drivers would mean fuel would soon become scarce.

Meanwhile, mainland Europe's rising energy bills and record electricity prices are due to a number of local factors, including low stockpiles of natural gas, weak output from the region's windmills and solar farms and maintenance work that has put generating operations out of action.


Related News

View more

UK low-carbon electricity generation stalls in 2019

UK low-carbon electricity 2019 saw stalled growth as renewables rose slightly, wind expanded, nuclear output fell, coal hit record lows, and net-zero targets demand faster deployment to cut CO2 intensity below 100gCO2/kWh.


Key Points

Low-carbon sources supplied 54% of UK power in 2019, up just 1TWh; wind grew, nuclear fell, and coal dropped to 2%.

✅ Wind up 8TWh; nuclear down 9TWh amid outages

✅ Fossil fuels 43% of generation; coal at 2%

✅ Net-zero needs 15TWh per year added to 2030


The amount of electricity generated by low-carbon sources in the UK stalled in 2019, Carbon Brief analysis shows.

Low-carbon electricity output from wind, solar, nuclear, hydro and biomass rose by just 1 terawatt hour (TWh, less than 1%) in 2019. It represents the smallest annual increase in a decade, where annual growth averaged 9TWh. This growth will need to double in the 2020s to meet UK climate targets while replacing old nuclear plants as they retire.

Some 54% of UK electricity generation in 2019 came from low-carbon sources, including 37% from renewables and 20% from wind alone, underscoring wind's leading role in the power mix during key periods. A record-low 43% was from fossil fuels, with 41% from gas and just 2% from coal, also a record low. In 2010, fossil fuels generated 75% of the total.

Carbon Brief’s analysis of UK electricity generation in 2019 is based on figures from BM Reports and the Department for Business, Energy and Industrial Strategy (BEIS). See the methodology at the end for more on how the analysis was conducted.

The numbers differ from those published earlier in January by National Grid, which were for electricity supplied in Great Britain only (England, Wales and Scotland, but excluding Northern Ireland), including via imports from other countries.

Low-carbon low
In 2019, the UK became the first major economy to target net-zero greenhouse gas emissions by 2050, increasing the ambition of its legally binding Climate Change Act.

To date, the country has cut its emissions by around two-fifths since 1990, with almost all of its recent progress coming from the electricity sector.

Emissions from electricity generation have fallen rapidly in the decade since 2010 as coal power has been almost phased out and even gas output has declined. Fossil fuels have been displaced by falling demand and by renewables, such as wind, solar and biomass.

But Carbon Brief’s annual analysis of UK electricity generation shows progress stalled in 2019, with the output from low-carbon sources barely increasing compared to a year earlier.

The chart below shows low-carbon generation in each year since 2010 (grey bars) and the estimated level in 2019 (red). The pale grey bars show the estimated future output of existing low-carbon sources after old nuclear plants retire and the pale red bars show the amount of new generation needed to keep electricity sector emissions to less than 100 grammes of CO2 per kilowatt hour (gCO2/kWh), the UK’s nominal target for the sector.

 Annual electricity generation in the UK by fuel, terawatt hours, 2010-2019. Top panel: fuel by fuel. Bottom panel: cumulative total generation from all sources. Source: BEIS energy trends, BM Reports and Carbon Brief analysis. Chart by Carbon Brief using Highcharts.
As the chart shows, the UK will require significantly more low-carbon electricity over the next decade as part of meeting its legally binding climate goals.

The nominal 100gCO2/kWh target for 2030 was set in the context of the UK’s less ambitious goal of cutting emissions to 80% below 1990 levels by 2050. Now that the country is aiming to cut emissions to net-zero by 2050, that 100gCO2/kWh indicator is likely to be the bare minimum.

Even so, it would require a rapid step up in the pace of low-carbon expansion, compared to the increases seen over the past decade. On average, low-carbon generation has risen by 9TWh each year in the decade since 2010 – including a rise of just 1TWh in 2019.

Given scheduled nuclear retirements and rising demand expected by the Committee on Climate Change (CCC) – with some electrification of transport and heating – low-carbon generation would need to increase by 15TWh each year until 2030, just to meet the benchmark of 100gCO2/kWh.

For context, the 3.2 gigawatt (GW) Hinkley C new nuclear plant being built in Somerset will generate around 25TWh once completed around 2026. The world’s largest offshore windfarm, the 1.2GW Hornsea One scheme off the Yorkshire coast, will generate around 5TWh each year.

The new Conservative government is targeting 40GW of offshore wind by 2030, up from today’s figure of around 8GW. If policies are put in place to meet this goal, then it could keep power sector emissions below 100gCO2/kWh, depending on the actual performance of the windfarms built.

However, new onshore wind and solar, further new nuclear or other low-carbon generation, such as gas with carbon capture and storage (CCS), is likely to be needed if demand is higher than expected, or if the 100gCO2/kWh benchmark is too weak in the context of net-zero by 2050.

The CCC says it is “likely” to “reflect the need for more rapid deployment” of low-carbon towards net-zero emissions in its advice on the sixth UK carbon budget for 2033-2037, due in September.

Trading places
Looking more closely at UK electricity generation in 2019, Carbon Brief’s analysis shows why there was so little growth for low-carbon sources compared to the previous year.

There was another increase for wind power in 2019 (up 8TWh, 14%), with record wind generation as several large new windfarms were completed including the 1.2GW Hornsea One project in October and the 0.6GW Beatrice offshore windfarm in Q2 of 2019. But this was offset by a decline for nuclear (down 9TWh, 14%), due to ongoing outages for reactors at Hunterston in Scotland and Dungeness in Kent.

(Analysis of data held by trade organisation RenewableUK suggests some 0.6GW of onshore wind capacity also started operating in 2019, including the 0.2GW Dorenell scheme in Moray, Scotland.)

As a result of these movements, the UK’s windfarms overtook nuclear for the first time ever in 2019, becoming the country’s second-largest source of electricity generation, and earlier, wind and solar together surpassed nuclear in the UK as momentum built. This is shown in the figure below, with wind (green line, top panel) trading places with nuclear (purple) and gas (dark blue) down around 25% since 2010 but remaining the single-largest source.

 Annual electricity generation in the UK by fuel, terawatt hours, 2010-2019. Top panel: fuel by fuel. Bottom panel: cumulative total generation from all sources. Source: BEIS energy trends, BM Reports and Carbon Brief analysis. Chart by Carbon Brief using Highcharts.
The UK’s currently suspended nuclear plants are due to return to service in January and March, according to operator EDF, the French state-backed utility firm. However, as noted above, most of the UK’s nuclear fleet is set to retire during the 2020s, with only Sizewell B in Suffolk due to still be operating by 2030. Hunterston is scheduled to retire by 2023 and Dungeness by 2028.

Set against these losses, the UK has a pipeline of offshore windfarms, secured via “contracts for difference” with the government, at a series of auctions. The most recent auction, in September 2019, saw prices below £40 per megawatt hour – similar to current wholesale electricity prices.

However, the capacity contracted so far is not sufficient to meet the government’s target of 40GW by 2030, meaning further auctions – or some other policy mechanism – will be required.

Coal zero
As well as the switch between wind and nuclear, 2019 also saw coal fall below solar for the first time across a full year, echoing the 2016 moment when wind outgenerated coal across the UK, after it suffered another 60% reduction in electricity output. Just six coal plants remain in the UK, with Aberthaw B in Wales and Fiddlers Ferry in Cheshire closing in March.

Coal accounted for just 2% of UK generation in 2019, a record-low coal share since centralised electricity supplies started to operate in 1882. The fuel met 40% of UK needs as recently as 2012, but has plummeted thanks to falling demand, rising renewables, cheaper gas and higher CO2 prices.

The reduction in average coal generation hides the fact that the fuel is now often not required at all to meet the UK’s electricity needs. The chart below shows the number of days each year when coal output was zero in 2019 (red line) and the two previous years (blue).

 Cumulative number of days when UK electricity generation from renewable sources has been higher than that from fossil fuels. Source: BEIS energy trends, BM Reports and Carbon Brief analysis. Chart by Carbon Brief using Highcharts.
The 83 days in 2019 with zero coal generation amount to nearly a quarter of the year and include the record-breaking 18-day stretch without the fuel.

Great Britain has been running for a record TWO WEEKS without using coal to generate electricity – the first time this has happened since 1882.

The country’s grid has been coal-free for 45% of hours in 2019 so far.https://www.carbonbrief.org/countdown-to-2025-tracking-the-uk-coal-phase-out …

Coal generation was set for significant reductions around the world in 2019 – including a 20% reduction for the EU as a whole – according to analysis published by Carbon Brief in November.

Notably, overall UK electricity generation fell by another 9TWh in 2019 (3%), bringing the total decline to 58TWh since 2010. This is equivalent to more than twice the output from the Hinkley C scheme being built in Somerset. As Carbon Brief explained last year, falling demand has had a similar impact on electricity-sector CO2 emissions as the increase in output from renewables.

This is illustrated by the fact that the 9TWh reduction in overall generation translated into a 9TWh (6%) cut in fossil-fuel generation during 2019, with coal falling by 10TWh and gas rising marginally.

Increasingly renewable
As fossil-fuel output and overall generation have declined, the UK’s renewable sources of electricity have continued to increase. Their output has risen nearly five-fold in the past decade and their share of the UK total has increased from 7% in 2010 to 37% in 2019.

As a result, the UK’s increasingly renewable grid is seeing more minutes, hours and days during which the likes of wind, solar and biomass collectively outpace all fossil fuels put together, and on some days wind is the main source as well.

The chart below shows the number of days during each year when renewables generated more electricity than fossil fuels in 2019 (red line) and each of the previous four years (blue lines). In total, nearly two-fifths of days in 2019 crossed this threshold.

 Cumulative number of days when the UK has not generated any electricity from coal. Source: BEIS energy trends, BM Reports and Carbon Brief analysis. Chart by Carbon Brief using Highcharts.
There were also four months in 2019 when renewables generated more of the UK’s electricity than fossil fuels: March, August, September and December. The first ever such month came in September 2018 and more are certain to follow.

National Grid, which manages Great Britain’s high-voltage electricity transmission network, is aiming to be able to run the system without fossil fuels by 2025, at least for short periods. At present, it sometimes has to ask windfarm operators to switch off and gas plants to start running in order to keep the electricity grid stable.

Note that biomass accounted for 11% of UK electricity generation in 2019, nearly a third of the total from all renewables. Some two-thirds of the biomass output is from “plant biomass”, primarily wood pellets burnt at Lynemouth in Northumberland and the Drax plant in Yorkshire. The remainder was from an array of smaller sites based on landfill gas, sewage gas or anaerobic digestion.

The CCC says the UK should “move away” from large-scale biomass power plants, once existing subsidy contracts for Drax and Lynemouth expire in 2027.

Using biomass to generate electricity is not zero-carbon and in some circumstances could lead to higher emissions than from fossil fuels. Moreover, there are more valuable uses for the world’s limited supply of biomass feedstock, the CCC says, including carbon sequestration and hard-to-abate sectors with few alternatives.

Methodology
The figures in the article are from Carbon Brief analysis of data from BEIS Energy Trends chapter 5 and chapter 6, as well as from BM Reports. The figures from BM Reports are for electricity supplied to the grid in Great Britain only and are adjusted to include Northern Ireland.

In Carbon Brief’s analysis, the BM Reports numbers are also adjusted to account for electricity used by power plants on site and for generation by plants not connected to the high-voltage national grid. This includes many onshore windfarms, as well as industrial gas combined heat and power plants and those burning landfill gas, waste or sewage gas.

By design, the Carbon Brief analysis is intended to align as closely as possible to the official government figures on electricity generated in the UK, reported in BEIS Energy Trends table 5.1.

Briefly, the raw data for each fuel is in most cases adjusted with a multiplier, derived from the ratio between the reported BEIS numbers and unadjusted figures for previous quarters.

Carbon Brief’s method of analysis has been verified against published BEIS figures using “hindcasting”. This shows the estimates for total electricity generation from fossil fuels or renewables to have been within ±3% of the BEIS number in each quarter since Q4 2017. (Data before then is not sufficient to carry out the Carbon Brief analysis.)

For example, in the second quarter of 2019, a Carbon Brief hindcast estimates gas generation at 33.1TWh, whereas the published BEIS figure was 34.0TWh. Similarly, it produces an estimate of 27.4TWh for renewables, against a BEIS figure of 27.1TWh.

National Grid recently shared its own analysis for electricity in Great Britain during 2019 via its energy dashboard, which differs from Carbon Brief’s figures.


Related News

View more

Potent greenhouse gas declines in the US, confirming success of control efforts

US SF6 Emissions Decline as NOAA analysis and EPA mitigation show progress, with atmospheric measurements and Greenhouse Gas Reporting verifying reductions from the electric power grid; sulfur hexafluoride's extreme global warming potential underscores inventory improvements.


Key Points

A documented drop in US sulfur hexafluoride emissions, confirmed by NOAA atmospheric data and EPA reporting reforms.

✅ NOAA towers and aircraft show 2007-2018 decline

✅ EPA reporting and utility mitigation narrowed inventory gaps

✅ Winter leaks and servicing signal further reduction options


A new NOAA analysis shows U.S. emissions of the super-potent greenhouse gas sulfur hexafluoride (SF6) have declined between 2007-2018, likely due to successful mitigation efforts by the Environmental Protection Agency (EPA) and the electric power industry, with attention to SF6 in the power industry across global markets. 

At the same time, significant disparities that existed previously between NOAA’s estimates, which are based on atmospheric measurements, and EPA’s estimates, which are based on a combination of reported emissions and industrial activity, have narrowed following the establishment of the EPA's Greenhouse Gas Reporting Program. The findings, published in the journal Atmospheric Chemistry and Physics, also suggest how additional emissions reductions might be achieved. 

SF6 is most commonly used as an electrical insulator in high-voltage equipment that transmits and distributes electricity, and its emissions have been increasing worldwide as electric power systems expand, even as regions hit milestones like California clean energy surpluses in recent years. Smaller amounts of SF6 are used in semiconductor manufacturing and in magnesium production. 

SF6 traps 25,000 times more heat than carbon dioxide over a 100-year time scale for equal amounts of emissions, and while CO2 emissions flatlined in 2019 globally, that comparison underscores the potency of SF6. That means a relatively small amount of the gas can have a significant impact on climate warming. Because of its extremely large global warming potential and long atmospheric lifetime, SF6 emissions will influence Earth’s climate for thousands of years.

In this study, researchers from NOAA’s Global Monitoring Laboratory, as record greenhouse gas concentrations drive demand for better data, working with colleagues at EPA, CIRES, and the University of Maryland, estimated U.S. SF6 emissions for the first time from atmospheric measurements collected at a network of tall towers and aircraft in NOAA’s Global Greenhouse Gas Reference Network. The researchers provided an estimate of SF6 emissions independent from the EPA’s estimate, which is based on reported SF6 emissions for some industrial facilities and on estimated SF6 emissions for others.

“We observed differences between our atmospheric estimates and the EPA’s activity-based estimates,” said study lead author Lei Hu, a Global Monitoring Laboratory researcher who was a CIRES scientist at the time of the study. “But by closely collaborating with the EPA, we were able to identify processes potentially responsible for a significant portion of this difference, highlighting ways to improve emission inventories and suggesting additional emission mitigation opportunities, such as forthcoming EPA carbon capture rules for power plants, in the future.” 

In the 1990s, the EPA launched voluntary partnerships with the electric power, where power-sector carbon emissions are falling as generation shifts, magnesium, and semiconductor industries to reduce SF6 emissions after the United States recognized that its emissions were significant. In 2011, large SF6 -emitting facilities were required to begin tracking and reporting their emissions under the EPA Greenhouse Gas Reporting Program. 

Hu and her colleagues documented a decline of about 60 percent in U.S. SF6 emissions between 2007-2018, amid global declines in coal-fired power in some years—equivalent to a reduction of between 6 and 20 million metric tons of CO2 emissions during that time period—likely due in part to the voluntary emission reduction partnerships and the EPA reporting requirement. A more modest declining trend has also been reported in the EPA’s national inventories submitted annually under the United Nations Framework Convention on Climate Change. 

Examining the differences between the NOAA and EPA independent estimates, the researchers found that the EPA’s past inventory analyses likely underestimated SF6 emissions from electrical power transmission and distribution facilities, and from a single SF6 production plant in Illinois. According to Hu, the research collaboration has likely improved the accuracy of the EPA inventories. The 2023 draft of the EPA’s U.S. Greenhouse Gas Emissions and Sinks: 1990-2021 used the results of this study to support revisions to its estimates of SF6 emissions from electrical transmission and distribution. 

The collaboration may also lead to improvements in the atmosphere-based estimates, helping NOAA identify how to expand or rework its network to better capture emitting industries or areas with significant emissions, according to Steve Montzka, senior scientist at GML and one of the paper’s authors.

Hu and her colleagues also found a seasonal variation in SF6 emissions from the atmosphere-based analysis, with higher emissions in winter than in summer. Industry representatives identified increased servicing of electrical power equipment in the southern states and leakage from aging brittle sealing materials in the equipment in northern states during winter as likely explanations for the enhanced wintertime emissions—findings that suggest opportunities for further emissions reductions.

“This is a great example of the future of greenhouse gas emission tracking, where inventory compilers and atmospheric scientists work together to better understand emissions and shed light on ways to further reduce them,” said Montzka.


Related News

View more

Global Energy War Escalates: Price Hikes and Instability

Russia-Ukraine Energy War disrupts infrastructure, oil, gas, and electricity, triggering supply shocks, price spikes, and inflation. Global markets face volatility, import risks, and cybersecurity threats, underscoring energy security, grid resilience, and diversified supply.


Key Points

It is Russia's strategic targeting of Ukraine's energy system to disrupt supplies, raise prices, and hit global markets.

✅ Attacks weaponize energy to strain Ukraine and allies

✅ Supply shocks risk oil, gas, and electricity price spikes

✅ Urgent need for cybersecurity, grid resilience, diversification


Russia's targeting of Ukraine's energy infrastructure has unleashed an "energy war" that could lead to widespread price increases, supply disruptions, and ripple effects throughout the global energy market, felt across the continent, with warnings of Europe's energy nightmare taking shape.

This highlights the unprecedented scale and severity of the attacks on Ukrainian energy infrastructure. These attacks have disrupted power supplies, prompting increased electricity imports to keep the lights on, hindered oil and gas production, and damaged refineries, impacting Ukraine and the broader global energy system.


Energy as a Weapon

Experts claim that Russia's deliberate attacks on Ukraine's energy infrastructure represent a strategic escalation, amid energy ceasefire violations alleged by both sides, demonstrating the Kremlin's willingness to weaponize energy as part of its war effort. By crippling Ukraine's energy system, Russia aims to destabilize the country, inflict suffering on civilians, and undermine Western support for Ukraine.


Impacts on Global Oil and Gas Markets

The ongoing attacks on Ukraine's energy infrastructure could significantly impact global oil and gas markets, leading to supply shortages and dramatic price increases, even as European gas prices briefly returned to pre-war levels earlier this year, underscoring extreme volatility. Ukraine's oil and gas production, while not massive in global terms, is still significant, and its disruption feeds into existing anxieties about global energy supplies already affected by the war.


Ripple Effects Beyond Ukraine

The impacts of the "energy war" won't be limited to Ukraine or its immediate neighbours. Price increases for oil, gas, and electricity are expected worldwide, further fueling inflation and exacerbating the global cost of living crisis.  Additionally, supply disruptions could disproportionately affect developing nations and regions heavily dependent on energy imports, making targeted energy security support to Ukraine and other vulnerable importers vital.


Vulnerability of Energy Infrastructure

The attacks on Ukraine highlight the vulnerability of critical energy infrastructure worldwide, as the country prepares for winter under persistent threats. The potential for other state or non-state actors to use similar tactics raises concerns about security and long-term stability in the global energy sector.


Strengthening Resilience

Experts emphasize the urgent need for global cooperation in strengthening the resilience of energy infrastructure. Investments in cybersecurity, diverse energy sources, and decentralized grids are crucial for mitigating the risks of future attacks, with some arguing that stepping away from fossil fuels would improve US energy security over time. International cooperation will be key in identifying vulnerable areas and providing aid to nations whose infrastructure is under threat.


The Unpredictable Future of Energy

The "energy war" unleashed by Russia has injected a new level of uncertainty into the global energy market. In addition to short-term price fluctuations and supply issues, the conflict could accelerate the long-term transition towards renewable energy sources and reshape how nations approach energy security.


Related News

View more

Sign Up for Electricity Forum’s Newsletter

Stay informed with our FREE Newsletter — get the latest news, breakthrough technologies, and expert insights, delivered straight to your inbox.

Electricity Today T&D Magazine Subscribe for FREE

Stay informed with the latest T&D policies and technologies.
  • Timely insights from industry experts
  • Practical solutions T&D engineers
  • Free access to every issue

Live Online & In-person Group Training

Advantages To Instructor-Led Training – Instructor-Led Course, Customized Training, Multiple Locations, Economical, CEU Credits, Course Discounts.

Request For Quotation

Whether you would prefer Live Online or In-Person instruction, our electrical training courses can be tailored to meet your company's specific requirements and delivered to your employees in one location or at various locations.