High-Temperature Superconducting Cables enable lossless, high-voltage, underground transmission for grid modernization, linking renewable energy to cities with liquid nitrogen cooling, boosting efficiency, cutting emissions, reducing land use, and improving resilience against disasters and extreme weather.
Key Points
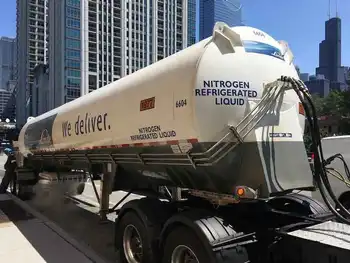
Liquid-nitrogen-cooled power cables delivering electricity with near-zero losses, lower voltage, and greater resilience.
✅ Near-lossless transmission links renewables to cities efficiently
✅ Operate at lower voltage, reducing substation size and cost
✅ Underground, compact, and resilient to extreme weather events
For most of us, transmitting power is an invisible part of modern life. You flick the switch and the light goes on.
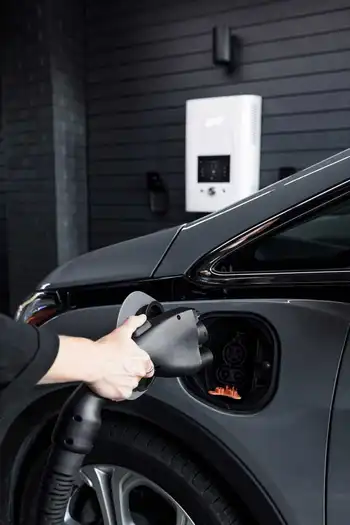
But the way we transport electricity is vital. For us to quit fossil fuels, we will need a better grid, with macrogrid planning connecting renewable energy in the regions with cities.
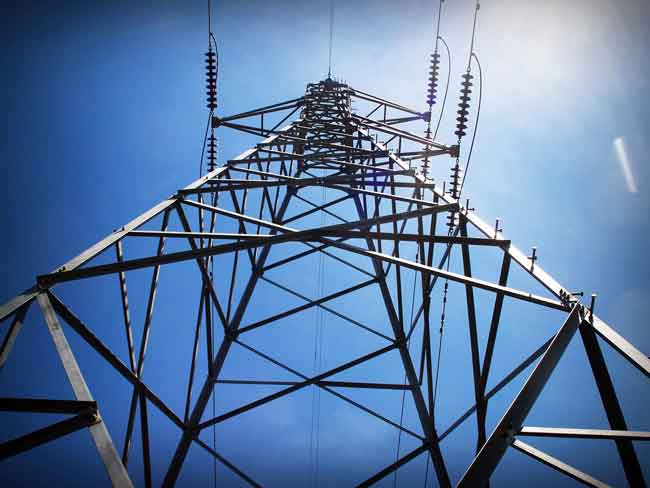
Electricity grids are big, complex systems. Building new high-voltage transmission lines often spurs backlash from communities, as seen in Hydro-Qu�e9bec power line opposition over aesthetics and land use, worried about the visual impact of the towers. And our 20th century grid loses around 10% of the power generated as heat.
One solution? Use superconducting cables for key sections of the grid. A single 17-centimeter cable can carry the entire output of several nuclear plants. Cities and regions around the world have done this to cut emissions, increase efficiency, protect key infrastructure against disasters and run powerlines underground. As Australia prepares to modernize its grid, it should follow suit with smarter electricity infrastructure initiatives seen elsewhere. It's a once-in-a-generation opportunity.
What's wrong with our tried-and-true technology?
Plenty.
The main advantage of high voltage transmission lines is they're relatively cheap.
But cheap to build comes with hidden costs later. A survey of 140 countries found the electricity currently wasted in transmission accounts for a staggering half-billion tons of carbon dioxide—each year.
These unnecessary emissions are higher than the exhaust from all the world's trucks, or from all the methane burned off at oil rigs.
Inefficient power transmission also means countries have to build extra power plants to compensate for losses on the grid.
Labor has pledged A$20 billion to make the grid ready for clean energy, and international moves such as US-Canada cross-border approvals show the scale of ambition needed. This includes an extra 10,000 kilometers of transmission lines. But what type of lines? At present, the plans are for the conventional high voltage overhead cables you see dotting the countryside.
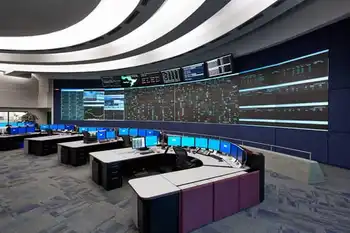
System planning by Australia's energy market operator shows many grid-modernizing projects will use last century's technologies, the conventional high voltage overhead cables, even as Europe's HVDC expansion gathers pace across its network. If these plans proceed without considering superconductors, it will be a huge missed opportunity.
How could superconducting cables help?
Superconduction is where electrons can flow without resistance or loss. Built into power cables, it holds out the promise of lossless electricity transfer, over both long and short distances. That's important, given Australia's remarkable wind and solar resources are often located far from energy users in the cities.
High voltage superconducting cables would allow us to deliver power with minimal losses from heat or electrical resistance and with footprints at least 100 times smaller than a conventional copper cable for the same power output.
And they are far more resilient to disasters and extreme weather, as they are located underground.
Even more important, a typical superconducting cable can deliver the same or greater power at a much lower voltage than a conventional transmission cable. That means the space needed for transformers and grid connections falls from the size of a large gym to only a double garage.
Bringing these technologies into our power grid offers social, environmental, commercial and efficiency dividends.
Unfortunately, while superconductors are commonplace in Australia's medical community (where they are routinely used in MRI machines and diagnostic instruments) they have not yet found their home in our power sector.
One reason is that superconductors must be cooled to work. But rapid progress in cryogenics means you no longer have to lower their temperature almost to absolute zero (-273℃). Modern "high temperature" superconductors only need to be cooled to -200℃, which can be done with liquid nitrogen—a cheap, readily available substance.
Overseas, however, they are proving themselves daily. Perhaps the most well-known example to date is in Germany's city of Essen. In 2014, engineers installed a 10 kilovolt (kV) superconducting cable in the dense city center. Even though it was only one kilometer long, it avoided the higher cost of building a third substation in an area where there was very limited space for infrastructure. Essen's cable is unobtrusive in a meter-wide easement and only 70cm below ground.
Superconducting cables can be laid underground with a minimal footprint and cost-effectively. They need vastly less land.
A conventional high voltage overhead cable requires an easement of about 130 meters wide, with pylons up to 80 meters high to allow for safety. By contrast, an underground superconducting cable would take up an easement of six meters wide, and up to 2 meters deep.
This has another benefit: overcoming community skepticism. At present, many locals are concerned about the vulnerability of high voltage overhead cables in bushfire-prone and environmentally sensitive regions, as well as the visual impact of the large towers and lines. Communities and farmers in some regions are vocally against plans for new 85-meter high towers and power lines running through or near their land.
Climate extremes, unprecedented windstorms, excessive rainfall and lightning strikes can disrupt power supply networks, as the Victorian town of Moorabool discovered in 2021.
What about cost? This is hard to pin down, as it depends on the scale, nature and complexity of the task. But consider this—the Essen cable cost around $20m in 2014. Replacing the six 500kV towers destroyed by windstorms near Moorabool in January 2020 cost $26 million.
While superconducting cables will cost more up front, you save by avoiding large easements, requiring fewer substations (as the power is at a lower voltage), and streamlining approvals.
Where would superconductors have most effect?
Queensland. The sunshine state is planning four new high-voltage transmission projects, to be built by the mid-2030s. The goal is to link clean energy production in the north of the state with the population centers of the south, similar to sending Canadian hydropower to New York to meet demand.
Right now, there are major congestion issues between southern and central Queensland, and subsea links like Scotland-England renewable corridors highlight how to move power at scale. Strategically locating superconducting cables here would be the best location, serving to future-proof infrastructure, reduce emissions and avoid power loss.
Related News