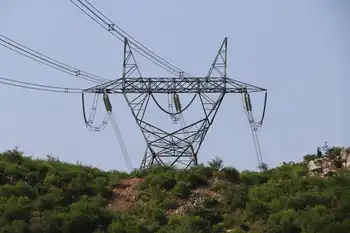
Same wires, more power

By Forbes


Substation Relay Protection Training

Our customized live online or in‑person group training can be delivered to your staff at your location.

  • Live Online
  • 12 hours Instructor-led
  • Group Training Available
Regular Price:
$699
Coupon Price:
$599
Reserve Your Seat Today
Five summers and two sweeping national energy laws ago, a few overgrown trees tripped power lines in Ohio, cascading into a blackout for much of the northeastern U.S. and Canada. Yet the nation's electric grid is still in drastic need of an overhaul.

The problems abound: increasing demand for electricity consistently strains the aging network. When planning system upgrades, power companies find themselves burdened by regulatory details and local opposition. Deregulation of the utility industry in the past two decades has fractured investment in transmission lines.

There's help on the way. Start-ups, big utilities and government have unleashed a wave of investment to make the electric grid smarter and more efficient, in spite of (and perhaps because of) underinvestment in transmission. The reason? Potentially enormous profits associated with getting more out of the network that's already in place.

"More generators just congest the system," says Roland Schoettle, founder and chief executive of Optimal Technologies International, a Raleigh, N.C.-based company that is scrambling to get in on the energy efficiency game.

In May the company commercially unveiled technology to measure the performance throughout the power grid, making congestion points more transparent. Optimal says its product could eradicate blackouts. That remains to be seen, though the company received $25 million in funding from Goldman Sachs, and California's grid operator has already successfully tested the system.

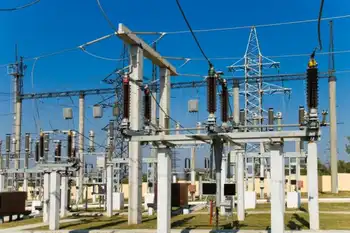
Of course, the "grid" is not actually a single web of infrastructure spanning the country, and efficiency gains are localized, often at the utility level. The grid itself is a network of about 10,000 power plants and power lines that runs within three different interconnections - in the West, the East and in Texas. Distribution of electricity is the responsibility of local utilities.

The big coup for start-ups, obviously, lies in turning utilities into customers. A good example: Virginia-based GridPoint, which recently announced partnerships with Duke Energy and Xcel Energy. Duke and GridPoint in March tested a technology that allows utilities to reduce stress on the grid caused by plug-in hybrid electric vehicles. Two months later, the start-up said Xcel will use GridPoint technology as it builds the nation's first "SmartGridCity" in Boulder, Colo.

In fact, the SmartGridCity is a massive energy efficiency project unto itself and a good example of how major utilities are getting in on the action. Think of it as a "Tomorrowland" for electricity, a prototype community that allows customers to determine when and how they'll use energy. Scheduled to be completed in 2009, it will include advanced meters, a network upgrade and the ability for local power sources to link up to the grid.

Known as "distributed generation," this localized power production is a key factor - and possibly the Achilles' heel - in the evolution of the smart grid. The idea behind distributed generation is to produce electricity near homes and businesses (usually from natural gas, small wind turbines or solar energy systems), thus alleviating the strain on power lines. In some cases, distributed power connections can sell energy back into the grid.

One quickly growing component of the distributed generation world is solar energy. Although it now provides less than 0.1% of the electricity generated in the U.S., solar power could account for 10% of the nation's power needs by 2025, according to a new study by the research firm Clean Edge. Already, companies such as Google and eBay are installing solar panels on their offices to reduce their reliance on the grid for power.

But here's the rub: Not all distributed generation is created equally. Local power sources frequently don't have the same voltage standards as electricity that comes from a centralized source, such as a coal-fired power plant. If a distributed generator goes out of service, it could prove a weak spot in the grid if it has no backup. The group that monitors grid reliability for federal regulators, the North American Electric Reliability Corp., doesn't have jurisdiction over local power lines. That's up to the utilities.

"If distributed generation is not integrated properly, it could have negative impacts," says Steve Hauser, president of the GridWise Alliance, a group pushing for a smarter grid, and a vice president at GridPoint.

So far, there hasn't been a major problem. And it looks as if Uncle Sam is keen to help the smart grid develop so catastrophe doesn't occur. The energy law passed by Congress last December calls for the U.S. Department of Energy to create a program to help cover the cost of smart-grid investments. It also requires the agency to report to lawmakers annually on the grid's evolution.

But some of the most meaningful action will probably come at the local level. Earlier this year, the Federal Energy Regulatory Commission announced that it's starting a "collaborative dialogue" with state regulators to begin the transition to a smarter grid.

Related News

California’s Solar Power Cost Shift: A Misguided Policy Threatening Energy Equity

California Rooftop Solar Cost Shift examines PG&E rate hikes, net metering changes, and utility infrastructure spending impacts on low-income households, distributed generation, and clean energy adoption, potentially raising bills and undermining grid resilience.


Key Points

A claim that rooftop solar shifts fixed grid costs to others; critics cite PG&E rates, avoided costs, and impacts.

✅ PG&E rates outpace national average, underscoring cost drivers.

✅ Net metering cuts risk burdening low- and middle-income homes.

✅ Distributed generation avoids infrastructure spend and grid strain.


California is grappling with soaring electricity prices across the state, with Pacific Gas & Electric (PG&E) rates more than double the national average and increasing at an average of 12.5% annually over the past six years. In response, Governor Gavin Newsom issued an executive order directing state energy agencies to identify ways to reduce power costs. However, recent policy shifts targeting rooftop solar users may exacerbate the problem rather than alleviate it.

The "Cost Shift" Theory

A central justification for these pricing changes is the "cost shift" theory. This theory posits that homeowners with rooftop solar panels reduce their electricity consumption from the grid, thereby shifting the fixed costs of maintaining and operating the electrical grid onto non-solar customers. Proponents argue that this leads to higher rates for those without solar installations.

However, this theory is based on a flawed assumption: that PG&E owns 100% of the electricity generated by its customers and is entitled to full profits even for energy it does not deliver. In reality, rooftop solar users supply only about half of their energy needs and still pay for the rest. Moreover, their investments in solar infrastructure reduce grid strain and save ratepayers billions by avoiding costly infrastructure projects and reducing energy demand growth, aligning with efforts to revamp electricity rates to clean the grid as well.

Impact on Low- and Middle-Income Households

The majority of rooftop solar users are low- and middle-income households. These individuals often invest in solar panels to lower their energy bills and reduce their carbon footprint. Policy changes that undermine the financial viability of rooftop solar disproportionately affect these communities, and efforts to overturn income-based charges add uncertainty about affordability and access.

For instance, Assembly Bill 942 proposes to retroactively alter contracts for millions of solar consumers, cutting the compensation they receive from providing energy to the grid, raising questions about major changes to your electric bill that could follow if their home is sold or transferred. This would force those with solar leases—predominantly lower-income individuals—to buy out their contracts when selling their homes, potentially incurring significant financial burdens.

The Real Drivers of Rising Energy Costs

While rooftop solar users are being blamed for rising electricity rates, calls for action have mounted as the true culprits lie elsewhere. Unchecked utility infrastructure spending has been a significant factor in escalating costs. For example, PG&E's rates have increased rapidly, yet the utility's spending on infrastructure projects has often been criticized for inefficiency and lack of accountability. Instead of targeting solar users, policymakers should scrutinize utility profit motives and infrastructure investments to identify areas where costs can be reduced without sacrificing service quality.

California's approach to addressing rising electricity costs by targeting rooftop solar users is misguided. The "cost shift" theory is based on flawed assumptions and overlooks the substantial benefits that rooftop solar provides to the grid and ratepayers. To achieve a sustainable and equitable energy future, the state must focus on controlling utility spending, promoting clean energy access for all, especially as it exports its energy policies across the West, and ensuring that policies support—not undermine—the adoption of renewable energy technologies.


Related News

View more

Global electric power demand surges above pre-pandemic levels

Global Power Sector CO2 Surge 2021 shows electricity demand outpacing renewable energy, with coal and fossil fuels rebounding, undermining green recovery goals and climate change targets flagged by the IEA and IPCC.


Key Points

Record rise in power sector CO2 in 2021 as demand outpaced renewables and coal rebounded, undermining a green recovery.

✅ Electricity demand rose 5% above pre-pandemic levels

✅ Fossil fuels supplied 61% of power; coal led the rebound

✅ Wind and solar grew 15% but lagged demand


Carbon dioxide emissions from the global electric power sector surged past pre-pandemic levels to record highs in the first half of 2021, according to new research by London-based environmental think tank Ember.

Electricity demand and emissions are now 5% higher than where they were before the Covid-19 outbreak, which prompted worldwide lockdowns that led to a temporary drop in global greenhouse gas emissions. Electricity demand also surpassed the growth of renewable energy, and surging electricity demand is putting power systems under strain, the analysis found.

The findings signal a failure of countries to achieve a so-called “green recovery” that would entail shifting away from fossil fuels toward renewable energy, though European responses to Covid-19 have accelerated the electricity system transition by about a decade, to avoid the worst consequences of climate change.

The report found that 61% of the world’s electricity still came from fossil fuels in 2020. Five G-20 countries had more than 75% of their electricity supplied from fossil fuels last year, with Saudi Arabia at 100%, South Africa at 89%, Indonesia at 83%, Mexico at 75% and Australia at 75%.

Coal generation did fall a record 4% in 2020, but overall coal supplied 43% of the additional energy demand between 2019 and 2020, with soaring electricity and coal use underscoring persistent demand pressures. Asia currently generates 77% of the world’s coal electricity and China alone generates 53%, up from 44% in 2015.

The world’s transition out of coal power, which contributes to roughly 30% of the world’s greenhouse gas emissions, is happening far too slowly to avoid the worst impacts of climate change, the study warned. And the International Energy Agency forecasts coal generation will rebound in 2021 as electricity demand picks up again, even as renewables are poised to eclipse coal by 2025 according to other analyses.

“Progress is nowhere near fast enough. Despite coal’s record drop during the pandemic, it still fell short of what is needed,” Ember lead analyst Dave Jones said in a statement.

Jones said coal power usage must collapse by 80% by the end of the decade to avoid dangerous levels of global warming above 1.5 degrees Celsius (2.7 degrees Fahrenheit).

“We need to build enough clean electricity to simultaneously replace coal and electrify the global economy,” Jones said. “World leaders have yet to wake up to the enormity of the challenge.”

The findings come ahead of a major U.N. climate conference in Glasgow, Scotland, in November, where negotiators will push for more ambitious climate action and emissions reduction pledges from nations.

Without immediate, rapid and large-scale reductions to global emissions, scientists of the Intergovernmental Panel on Climate Change warn that the average global temperature will likely cross the 1.5 degrees Celsius threshold within 20 years.

The study also highlighted some upsides. Wind and solar generation, for instance, rose by 15% in 2020, and low-emissions sources are set to cover almost all the growth in global electricity demand in the next three years, producing nearly a tenth of the world’s electricity last year and doubling production since 2015.

Some countries now get about 10% of their electricity from wind and solar, including India, China, Japan, Brazil. The U.S. and Europe have experienced the biggest growth in wind and solar, and in the EU, wind and solar generated more electricity than gas last year, with Germany at 33% and the U.K. leads the G20 for wind power at 29%.


Related News

View more

Europe's stunted hydro & nuclear output may hobble recovery drive

Europe 2023 Energy Shortfall underscores how weak hydro and nuclear offset record solar and wind, tightening grids as natural gas supplies shrink and demand rebounds, heightening risks of electricity shortages across key economies.


Key Points

A regional gap as weak hydro and nuclear offset record solar and wind, straining supply as gas stays tight.

✅ Hydro and nuclear output fell sharply in early 2023

✅ Record solar and wind could not offset the deficit

✅ Industrial demand rebound pressures limited gas supplies


Shortfalls in Europe's hydro and nuclear output have more than offset record electricity generation from wind and solar power sites over the first quarter of 2023, leaving the region vulnerable to acute energy shortages for the second straight year.

European countries fast-tracked renewable energy capacity development in 2022 in the wake of Russia's invasion of Ukraine last February, which upended natural gas flows to the region and sent power prices soaring.

Europe lifted renewable energy supply capacity by a record 57,290 megawatts in 2022, or by nearly 9%, according to the International Energy Agency (IRENA), amid a scramble to replace imported Russian gas with cleaner, home-grown energy.

However, steep drops in both hydro and nuclear output - two key sources of non-emitting energy - mean Europe's power producers have limited ways to lift overall electricity generation, as the region is losing nuclear power at a critical moment, just as the region's economies start to reboot after last year's energy shock.

POWER PLATEAU
Europe's total electricity generation over the first quarter of 2023 hit 1,213 terawatt hours, or roughly 6.4% less than during the same period in 2022, according to data from think tank Ember.

At the same time, European power hits records during extreme heat as plants struggle to cool, exacerbating supply risks.

As Europe's total electricity demand levels were in post-COVID-19 expansion mode in early 2022 before Russia's so-called special operation sent power costs to record highs amid debates over how electricity is priced in Europe, it makes sense that overall electricity use was comparatively stunted in early 2023.

However, efforts are now underway to revive activity at scores of European factories, industrial plants and production lines that were shuttered or curtailed in 2022, so Europe's collective electricity consumption totals are set to trend steadily higher over the remainder of 2023.

With Russian natural gas unavailable in the previous quantities due to sanctions and supply issues, Europe's power producers will need to deploy alternative energy sources, including renewables poised to eclipse coal globally, to feed that increase in power demand.

And following the large jump in renewable capacity brought online in 2022, utilities can deploy more low-emissions energy than ever before across Europe's electricity grids.


Related News

View more

B.C. Hydro adds more vehicle charging stations across southern B.C.

BC Hydro EV Charging Stations expand provincewide with DC fast chargers, 80% in 30 minutes at 35 c/kWh, easing range anxiety across Vancouver, Vancouver Island, Coquihalla Highway, East Kootenay, between Kamloops and Prince George.


Key Points

Public DC fast-charging network across B.C. enabling 80% charge in 30 minutes to cut EV range anxiety.

✅ 28 new stations added; 30 launched in 2016

✅ 35 c/kWh; about $3.50 per tank equivalent

✅ Coverage: Vancouver, Island, Coquihalla, East Kootenay


B.C. Hydro is expanding its network of electric vehicle charging stations.

The Crown utility says 28 new stations complete the second phase of its fast-charging network and are in addition to the 30 stations opened in 2016.

Thirteen of the stations are in Metro Vancouver, seven are on Vancouver Island, including one at the Pacific Rim Visitor Centre near Tofino, another is in Campbell River, and two have opened on the Coquihalla segment of B.C.'s Electric Highway at the Britton Creek rest area.

A further six stations are located throughout the East Kootenay and B.C. Hydro says the next phase of its program will connect drivers travelling between Kamloops and Prince George, while stations in Prince Rupert are also being planned.

BC Hydro has also opened a fast charging site in Lillooet, illustrating expansion into smaller communities.

Hydro spokeswoman Mora Scott says the stations can charge an electric vehicle to 80 per cent in just 30 minutes, at a cost of 35 cents per kilowatt hour.

Mora Scott says that translates to roughly $3.50 for the equivalent of a full tank of gas in the average four-cylinder car.

“The number of electric vehicles on B.C. roads is increasing, there’s currently around 9,000 across the province, and we actually expect that number to rise to 300,000 by 2030,” Scott says in a news release.

In partnership with municipalities, regional districts and several businesses, B.C. Hydro has been installing charging stations throughout the province since 2012 with support from the provincial and federal governments and programs such as EV charger rebates available to residents.

Scott says the utility wants to ensure the stations are placed where drivers need them so charging options are available provincewide.

“One big thing that we know drivers of electric vehicles worry about is the concept called range anxiety, that the stations aren’t going to be where they need them,” she says.

Several models of electric vehicle are now capable of travelling up to 500 kilometres on a single charge, says Scott.

BC Hydro president Chris O’Riley says the new charging sites will encourage electric vehicle drivers to explore B.C. this summer.


Related News

View more

Which of the cleaner states imports dirty electricity?

Hourly Electricity Emissions Tracking maps grid balancing areas, embodied emissions, and imports/exports, revealing carbon intensity shifts across PJM, ERCOT, and California ISO, and clarifying renewable energy versus coal impacts on health and climate.


Key Points

An hourly method tracing generation, flows, and embodied emissions to quantify carbon intensity across US balancing areas.

✅ Hourly traces of imports/exports and generation mix

✅ Consumption-based carbon intensity by balancing area

✅ Policy insights for renewables, coal, health costs


In the United States, electricity generation accounts for nearly 30% of our carbon emissions. Some states have responded to that by setting aggressive renewable energy standards; others are hoping to see coal propped up even as its economics get worse. Complicating matters further is the fact that many regional grids are integrated, and as America goes electric the stakes grow, meaning power generated in one location may be exported and used in a different state entirely.

Tracking these electricity exports is critical for understanding how to lower our national carbon emissions. In addition, power from a dirty source like coal has health and environment impacts where it's produced, and the costs of these aren't always paid by the parties using the electricity. Unfortunately, getting reliable figures on how electricity is produced and where it's used is challenging, even for consumers trying to find where their electricity comes from in the first place, leaving some of the best estimates with a time resolution of only a month.

Now, three Stanford researchers—Jacques A. de Chalendar, John Taggart, and Sally M. Benson—have greatly improved on that standard, and they have managed to track power generation and use on an hourly basis. The researchers found that, of the 66 grid balancing areas within the United States, only three have carbon emissions equivalent to our national average, and they have found that imports and exports of electricity have both seasonal and daily changes. de Chalendar et al. discovered that the net results can be substantial, with imported electricity increasing California's emissions/power by 20%.

Hour by hour
To figure out the US energy trading landscape, the researchers obtained 2016 data for grid features called balancing areas. The continental US has 66 of these, providing much better spatial resolution on the data than the larger grid subdivisions. This doesn't cover everything—several balancing areas in Canada and Mexico are tied in to the US grid—and some of these balancing areas are much larger than others. The PJM grid, serving Pennsylvania, New Jersey, and Maryland, for example, is more than twice as large as Texas' ERCOT, in a state that produces and consumes the most electricity in the US.

Despite these limitations, it's possible to get hourly figures on how much electricity was generated, what was used to produce it, and whether it was used locally or exported to another balancing area. Information on the generating sources allowed the researchers to attach an emissions figure to each unit of electricity produced. Coal, for example, produces double the emissions of natural gas, which in turn produces more than an order of magnitude more carbon dioxide than the manufacturing of solar, wind, or hydro facilities. These figures were turned into what the authors call "embodied emissions" that can be traced to where they're eventually used.

Similar figures were also generated for sulfur dioxide and nitrogen oxides. Released by the burning of fossil fuels, these can both influence the global climate and produce local health problems.

Huge variation
The results were striking. "The consumption-based carbon intensity of electricity varies by almost an order of magnitude across the different regions in the US electricity system," the authors conclude. The low is the Bonneville Power grid region, which is largely supplied by hydropower; it has typical emissions below 100kg of carbon dioxide per megawatt-hour. The highest emissions come in the Ohio Valley Electric region, where emissions clear 900kg/MW-hr. Only three regional grids match the overall grid emissions intensity, although that includes the very large PJM (where capacity auction payouts recently fell), ERCOT, and Southern Co balancing areas.

Most of the low-emissions power that's exported comes from the Pacific Northwest's abundant hydropower, while the Rocky Mountains area exports electricity with the highest associated emissions. That leads to some striking asymmetries. Local generation in the hydro-rich Idaho Power Company has embodied emissions of only 71kg/MW-hr, while its imports, coming primarily from Rocky Mountain states, have a carbon content of 625kg/MW-hr.

The reliance on hydropower also makes the asymmetry seasonal. Local generation is highest in the spring as snow melts, but imports become a larger source outside this time of year. As solar and wind can also have pronounced seasonal shifts, similar changes will likely be seen as these become larger contributors to many of these regional grids. Similar things occur daily, as both demand and solar production (and, to a lesser extent, wind) have distinct daily profiles.

The Golden State
California's CISO provides another instructive case. Imports represent less than 30% of its total electric use in 2016, yet California electricity imports provided 40% of its embodied emissions. Some of these, however, come internally from California, provided by the Los Angeles Department of Water and Power. The state itself, however, has only had limited tracking of imported emissions, lumping many of its sources as "other," and has been exporting its energy policies to Western states in ways that shape regional markets.

Overall, the 2016 inventory provides a narrow picture of the US grid, as plenty of trends are rapidly changing our country's emissions profile, including the rise of renewables and the widespread adoption of efficiency measures and other utility trends in 2017 that continue to evolve. The method developed here can, however, allow for annual updates, providing us with a much better picture of trends. That could be quite valuable to track things like how the rapid rise in solar power is altering the daily production of clean power.

More significantly, it provides a basis for more informed policymaking. States that wish to promote low-emissions power can use the information here to either alter the source of their imports or to encourage the sites where they're produced to adopt more renewable power. And those states that are exporting electricity produced primarily through fossil fuels could ensure that the locations where the power is used pay a price that includes the health costs of its production.


Related News

View more

How the 787 uses electricity to maximise efficiency

Boeing 787 More-Electric Architecture replaces pneumatics with bleedless pressurization, VFSG starter-generators, electric brakes, and heated wing anti-ice, leveraging APU, RAT, batteries, and airport ground power for efficient, redundant electrical power distribution.


Key Points

An integrated, bleedless electrical system powering start, pressurization, brakes, and anti-ice via VFSGs, APU and RAT.

✅ VFSGs start engines, then generate 235Vac variable-frequency power

✅ Bleedless pressurization, electric anti-ice improve fuel efficiency

✅ Electric brakes cut hydraulic weight and simplify maintenance


The 787 Dreamliner is different to most commercial aircraft flying the skies today. On the surface it may seem pretty similar to the likes of the 777 and A350, but get under the skin and it’s a whole different aircraft.

When Boeing designed the 787, in order to make it as fuel efficient as possible, it had to completely shake up the way some of the normal aircraft systems operated. Traditionally, systems such as the pressurization, engine start and wing anti-ice were powered by pneumatics. The wheel brakes were powered by the hydraulics. These essential systems required a lot of physical architecture and with that comes weight and maintenance. This got engineers thinking.

What if the brakes didn’t need the hydraulics? What if the engines could be started without the pneumatic system? What if the pressurisation system didn’t need bleed air from the engines? Imagine if all these systems could be powered electrically… so that’s what they did.


Power sources

The 787 uses a lot of electricity. Therefore, to keep up with the demand, it has a number of sources of power, much as grid operators track supply on the GB energy dashboard to balance loads. Depending on whether the aircraft is on the ground with its engines off or in the air with both engines running, different combinations of the power sources are used.


Engine starter/generators

The main source of power comes from four 235Vac variable frequency engine starter/generators (VFSGs). There are two of these in each engine. These function as electrically powered starter motors for the engine start, and once the engine is running, then act as engine driven generators.

The generators in the left engine are designated as L1 and L2, the two in the right engine are R1 and R2. They are connected to their respective engine gearbox to generate electrical power directly proportional to the engine speed. With the engines running, the generators provide electrical power to all the aircraft systems.


APU starter/generators

In the tail of most commercial aircraft sits a small engine, the Auxiliary Power Unit (APU). While this does not provide any power for aircraft propulsion, it does provide electrics for when the engines are not running.

The APU of the 787 has the same generators as each of the engines — two 235Vac VFSGs, designated L and R. They act as starter motors to get the APU going and once running, then act as generators. The power generated is once again directly proportional to the APU speed.

The APU not only provides power to the aircraft on the ground when the engines are switched off, but it can also provide power in flight should there be a problem with one of the engine generators.


Battery power

The aircraft has one main battery and one APU battery. The latter is quite basic, providing power to start the APU and for some of the external aircraft lighting.

The main battery is there to power the aircraft up when everything has been switched off and also in cases of extreme electrical failure in flight, and in the grid context, alternatives such as gravity power storage are being explored for long-duration resilience. It provides power to start the APU, acts as a back-up for the brakes and also feeds the captain’s flight instruments until the Ram Air Turbine deploys.


Ram air turbine (RAT) generator

When you need this, you’re really not having a great day. The RAT is a small propeller which automatically drops out of the underside of the aircraft in the event of a double engine failure (or when all three hydraulics system pressures are low). It can also be deployed manually by pressing a switch in the flight deck.

Once deployed into the airflow, the RAT spins up and turns the RAT generator. This provides enough electrical power to operate the captain’s flight instruments and other essentials items for communication, navigation and flight controls.


External power

Using the APU on the ground for electrics is fine, but they do tend to be quite noisy. Not great for airports wishing to keep their noise footprint down. To enable aircraft to be powered without the APU, most big airports will have a ground power system drawing from national grids, including output from facilities such as Barakah Unit 1 as part of the mix. Large cables from the airport power supply connect 115Vac to the aircraft and allow pilots to shut down the APU. This not only keeps the noise down but also saves on the fuel which the APU would use.

The 787 has three external power inputs — two at the front and one at the rear. The forward system is used to power systems required for ground operations such as lighting, cargo door operation and some cabin systems. If only one forward power source is connected, only very limited functions will be available.

The aft external power is only used when the ground power is required for engine start.


Circuit breakers

Most flight decks you visit will have the back wall covered in circuit breakers — CBs. If there is a problem with a system, the circuit breaker may “pop” to preserve the aircraft electrical system. If a particular system is not working, part of the engineers procedure may require them to pull and “collar” a CB — placing a small ring around the CB to stop it from being pushed back in. However, on the 787 there are no physical circuit breakers. You’ve guessed it, they’re electric.

Within the Multi Function Display screen is the Circuit Breaker Indication and Control (CBIC). From here, engineers and pilots are able to access all the “CBs” which would normally be on the back wall of the flight deck. If an operational procedure requires it, engineers are able to electrically pull and collar a CB giving the same result as a conventional CB.

Not only does this mean that the there are no physical CBs which may need replacing, it also creates space behind the flight deck which can be utilised for the galley area and cabin.


A normal flight

While it’s useful to have all these systems, they are never all used at the same time, and, as the power sector’s COVID-19 mitigation strategies showed, resilience planning matters across operations. Depending on the stage of the flight, different power sources will be used, sometimes in conjunction with others, to supply the required power.


On the ground

When we arrive at the aircraft, more often than not the aircraft is plugged into the external power with the APU off. Electricity is the blood of the 787 and it doesn’t like to be without a good supply constantly pumping through its system, and, as seen in NYC electric rhythms during COVID-19, demand patterns can shift quickly. Ground staff will connect two forward external power sources, as this enables us to operate the maximum number of systems as we prepare the aircraft for departure.

Whilst connected to the external source, there is not enough power to run the air conditioning system. As a result, whilst the APU is off, air conditioning is provided by Preconditioned Air (PCA) units on the ground. These connect to the aircraft by a pipe and pump cool air into the cabin to keep the temperature at a comfortable level.


APU start

As we near departure time, we need to start making some changes to the configuration of the electrical system. Before we can push back , the external power needs to be disconnected — the airports don’t take too kindly to us taking their cables with us — and since that supply ultimately comes from the grid, projects like the Bruce Power upgrade increase available capacity during peaks, but we need to generate our own power before we start the engines so to do this, we use the APU.

The APU, like any engine, takes a little time to start up, around 90 seconds or so. If you remember from before, the external power only supplies 115Vac whereas the two VFSGs in the APU each provide 235Vac. As a result, as soon as the APU is running, it automatically takes over the running of the electrical systems. The ground staff are then clear to disconnect the ground power.

If you read my article on how the 787 is pressurised, you’ll know that it’s powered by the electrical system. As soon as the APU is supplying the electricity, there is enough power to run the aircraft air conditioning. The PCA can then be removed.


Engine start

Once all doors and hatches are closed, external cables and pipes have been removed and the APU is running, we’re ready to push back from the gate and start our engines. Both engines are normally started at the same time, unless the outside air temperature is  below 5°C.

On other aircraft types, the engines require high pressure air from the APU to turn the starter in the engine. This requires a lot of power from the APU and is also quite noisy. On the 787, the engine start is entirely electrical.

Power is drawn from the APU and feeds the VFSGs in the engines. If you remember from earlier, these fist act as starter motors. The starter motor starts the turn the turbines in the middle of the engine. These in turn start to turn the forward stages of the engine. Once there is enough airflow through the engine, and the fuel is igniting, there is enough energy to continue running itself.


After start

Once the engine is running, the VFSGs stop acting as starter motors and revert to acting as generators. As these generators are the preferred power source, they automatically take over the running of the electrical systems from the APU, which can then be switched off. The aircraft is now in the desired configuration for flight, with the 4 VFSGs in both engines providing all the power the aircraft needs.

As the aircraft moves away towards the runway, another electrically powered system is used — the brakes. On other aircraft types, the brakes are powered by the hydraulics system. This requires extra pipe work and the associated weight that goes with that. Hydraulically powered brake units can also be time consuming to replace.

By having electric brakes, the 787 is able to reduce the weight of the hydraulics system and it also makes it easier to change brake units. “Plug in and play” brakes are far quicker to change, keeping maintenance costs down and reducing flight delays.


In-flight

Another system which is powered electrically on the 787 is the anti-ice system. As aircraft fly though clouds in cold temperatures, ice can build up along the leading edge of the wing. As this reduces the efficiency of the the wing, we need to get rid of this.

Other aircraft types use hot air from the engines to melt it. On the 787, we have electrically powered pads along the leading edge which heat up to melt the ice.

Not only does this keep more power in the engines, but it also reduces the drag created as the hot air leaves the structure of the wing. A double win for fuel savings.

Once on the ground at the destination, it’s time to start thinking about the electrical configuration again. As we make our way to the gate, we start the APU in preparation for the engine shut down. However, because the engine generators have a high priority than the APU generators, the APU does not automatically take over. Instead, an indication on the EICAS shows APU RUNNING, to inform us that the APU is ready to take the electrical load.


Shutdown

With the park brake set, it’s time to shut the engines down. A final check that the APU is indeed running is made before moving the engine control switches to shut off. Plunging the cabin into darkness isn’t a smooth move. As the engines are shut down, the APU automatically takes over the power supply for the aircraft. Once the ground staff have connected the external power, we then have the option to also shut down the APU.

However, before doing this, we consider the cabin environment. If there is no PCA available and it’s hot outside, without the APU the cabin temperature will rise pretty quickly. In situations like this we’ll wait until all the passengers are off the aircraft until we shut down the APU.

Once on external power, the full flight cycle is complete. The aircraft can now be cleaned and catered, ready for the next crew to take over.


Bottom line

Electricity is a fundamental part of operating the 787. Even when there are no passengers on board, some power is required to keep the systems running, ready for the arrival of the next crew. As we prepare the aircraft for departure and start the engines, various methods of powering the aircraft are used.

The aircraft has six electrical generators, of which only four are used in normal flights. Should one fail, there are back-ups available. Should these back-ups fail, there are back-ups for the back-ups in the form of the battery. Should this back-up fail, there is yet another layer of contingency in the form of the RAT. A highly unlikely event.

The 787 was built around improving efficiency and lowering carbon emissions whilst ensuring unrivalled levels safety, and, in the wider energy landscape, perspectives like nuclear beyond electricity highlight complementary paths to decarbonization — a mission it’s able to achieve on hundreds of flights every single day.


Related News

View more

Sign Up for Electricity Forum’s Newsletter

Stay informed with our FREE Newsletter — get the latest news, breakthrough technologies, and expert insights, delivered straight to your inbox.

Electricity Today T&D Magazine Subscribe for FREE

Stay informed with the latest T&D policies and technologies.
  • Timely insights from industry experts
  • Practical solutions T&D engineers
  • Free access to every issue

Download the 2025 Electrical Training Catalog

Explore 50+ live, expert-led electrical training courses –

  • Interactive
  • Flexible
  • CEU-cerified