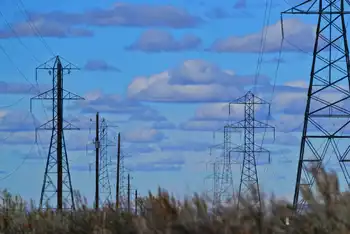
Canada Critical Infrastructure Cyber Risks include state-sponsored actors probing the electricity grid and ICS/OT, ransomware on utilities, and espionage targeting smart cities, medical devices, and energy networks, pre-positioning for disruptive operations.
Key Points
Nation-state and criminal cyber risks to Canada's power, water, and OT/ICS, aiming to disrupt, steal data, or extort.
✅ State-sponsored probing of power grid and utilities
✅ OT/ICS exposure grows as systems connect to IT networks
✅ Ransomware, espionage, and pre-positioning for disruption
State-sponsored actors are "very likely" trying to shore up their cyber capabilities to attack Canada's critical infrastructure — such as the electricity supply, as underscored by the IEA net-zero electricity report indicating rising demand for clean power, to intimidate or to prepare for future online assaults, a new intelligence assessment warns.
"As physical infrastructure and processes continue to be connected to the internet, cyber threat activity has followed, leading to increasing risk to the functioning of machinery and the safety of Canadians," says a new national cyber threat assessment drafted by the Communications Security Establishment.
"We judge that state-sponsored actors are very likely attempting to develop the additional cyber capabilities required to disrupt the supply of electricity in Canada, even as cleaning up Canada's electricity remains critical for climate goals."
Today's report — the second from the agency's Canadian Centre for Cyber Security wing — looks at the major cyber threats to Canadians' physical safety and economic security.
The CSE does say in the report that while it's unlikely cyber threat actors would intentionally disrupt critical infrastructure — such as water and electricity supplies — to cause major damage or loss of life, they would target critical organizations "to collect information, pre-position for future activities, or as a form of intimidation."
The report said Russia-associated actors probed the networks of electricity utilities in the U.S. and Canada last year and Chinese state-sponsored cyber threat actors have targeted U.S. utility employees. Other countries have seen their industrial control systems targeted by Iranian hacking groups and North Korean malware was found in the IT networks of an Indian power plant, it said.
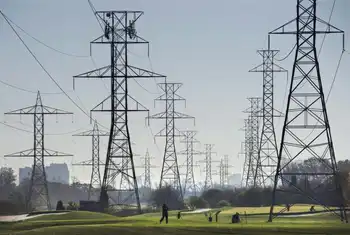
The threat grows as more critical infrastructure goes high-tech.
In the past, the operational technology (OT) used to control dams, boilers, electricity and pipeline operations has been largely immune to cyberattacks — but that's changing as manufacturers incorporate newer information technology in their systems and products and as the race to net-zero drives grid modernization, says the report.
That technology might make things easier and lower costs for utilities already facing debates over electricity prices in Alberta amid affordability concerns, but it comes with risks, said Scott Jones, the head of the cyber centre.
"So that means now it is a target, it is accessible and it's vulnerable. So what you could see is shutting off of transmission lines, you can see them opening circuit breakers, meaning electricity simply won't flow to our homes to our business," he told reporters Wednesday.
While the probability of such attacks remains low, Jones said the goal of Wednesday's briefing is to send out the early warnings.
"We're not trying to scare people. We're certainly not trying to scare people into going off grid by building a cabin in the woods. We're here to say, 'Let's tackle these now while they're still paper, while they're still a threat we're writing down.'"
Steve Waterhouse, a former cybersecurity officer for the Department of National Defence who now teaches at Université de Sherbrooke, said a saving grace for Canada could be the makeup of its electrical systems.
"Since in Canada, they're very centralized, it's easier to defend, and debates about bridging Alberta and B.C. electricity aim to strengthen resilience, while down in the States, they have multiple companies all around the place. So the weakest link is very hard to identify where it is, but the effect is a cascading effect across the country ... And it could impact Canada, just like we saw in the big Northeastern power outage, the blackout of 2003," he said.
"So that goes to say, we have to be prepared. And I believe most energy companies have been taking extra measures to protect and defend against these type of attacks, even as Canada points to nationwide climate success in electricity to meet emissions goals."
In the future, attacks targeting so-called smart cities and internet-connected devices, such as personal medical devices, could also put Canadians at risk, says the report.
Earlier this year, for example, Health Canada warned the public that medical devices containing a particular Bluetooth chip — including pacemakers, blood glucose monitors and insulin pumps — are vulnerable to cyber attacks that could crash them.
The foreign signals intelligence agency also says that while state-sponsored programs in China, Russia, Iran and North Korea "almost certainly" pose the greatest state-sponsored cyber threats to Canadian individuals and organizations, many other states are rapidly developing their own cyber programs.
Waterhouse said he was glad to see the government agency call out the countries by name, representing a shift in approach in recent years.
"To tackle on and be ready to face a cyber-attack, you have to know your enemy," he said.
"You have to know what's vulnerable inside of your organization. You have to know how ... vulnerable it is against the threats that are out there."
Commercial espionage continues
State-sponsored actors will also continue their commercial espionage campaigns against Canadian businesses, academia and governments — even as calls to make Canada a post-COVID manufacturing hub grow — to steal Canadian intellectual property and proprietary information, says the CSE.
"We assess that these threat actors will almost certainly continue attempting to steal intellectual property related to combating COVID-19 to support their own domestic public health responses or to profit from its illegal reproduction by their own firms," says the "key judgments" section of the report.
"The threat of cyber espionage is almost certainly higher for Canadian organizations that operate abroad or work directly with foreign state-owned enterprises."
The CSE says such commercial espionage is happening already across multiple fields, including aviation, technology and AI, energy and biopharmaceuticals.
While state-sponsored cyber activity tends to offer the most sophisticated threats, CSE said that cybercrime continues to be the threat most likely to directly affect Canadians and Canadian organizations, through vectors like online scams and malware.
"We judge that ransomware directed against Canada will almost certainly continue to target large enterprises and critical infrastructure providers. These entities cannot tolerate sustained disruptions and are willing to pay up to millions of dollars to quickly restore their operations," says the report.
Cybercrime becoming more sophisticated
According to the Canadian Anti-Fraud Centre, Canadians lost over $43 million to cybercrime last year. The CSE reported earlier this year that online thieves have been using the COVID-19 pandemic to trick Canadians into forking over their money — through scams like a phishing campaign that claimed to offer access to a Canada Emergency Response Benefit payment in exchange for the target's personal financial details.
Online foreign influence activities — a dominant theme in the CSE's last threat assessment briefing — continue and constitute "a new normal" in international affairs as adversaries seek to influence domestic and international political events, says the agency.
"We assess that, relative to some other countries, Canadians are lower-priority targets for online foreign influence activity," it said.
"However, Canada's media ecosystem is closely intertwined with that of the United States and other allies, which means that when their populations are targeted, Canadians become exposed to online influence as a type of collateral damage."
According to the agency's own definition, "almost certainly" means it is nearly 100 per cent certain in its analysis, while "very likely" means it is 80-90 per cent certain of its conclusions. The CSE says its analysis is based off of a mix of confidential and non-confidential intelligence and sources.
Related News