Minnesota Electric Cooperatives are driving grid innovation with smart meters, time-of-use pricing, demand response, and energy storage, including iron-air batteries, to manage peak loads, integrate wind and solar, and cut costs for rural members.
Key Points
Member-owned utilities piloting load management, meters, and storage to integrate wind and solar, cutting peak demand.
✅ Time-of-use pricing pilots lower bills and shift peak load.
✅ Iron-air battery tests add multi-day, low-cost energy storage.
✅ Smart meters enable demand response across rural co-ops.
Minnesota electric cooperatives have quietly emerged as laboratories for clean grid innovation, outpacing investor-owned utilities on smart meter installations, time-based pricing pilots, and experimental battery storage solutions.
“Co-ops have innovation in their DNA,” said David Ranallo, a spokesperson for Great River Energy, a generation and distribution cooperative that supplies power to 28 member utilities — making it one of the state’s largest co-op players.
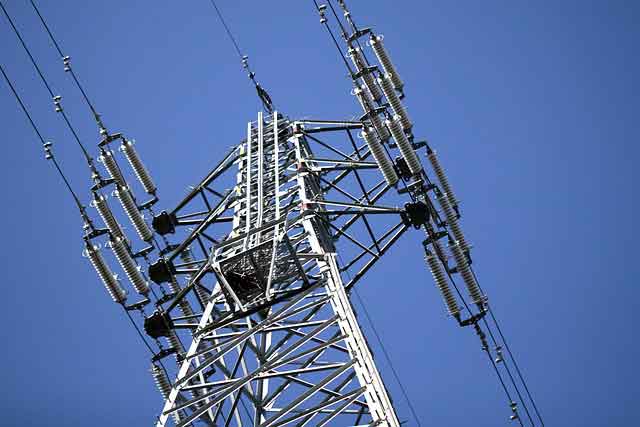
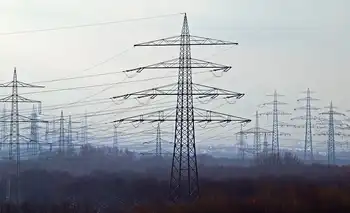
Minnesota farmers helped pioneer the electric co-op model more than a century ago, similar to modern community-generated green electricity initiatives, pooling resources to build power lines, transformers and other equipment to deliver power to rural parts of the state. Today, 44 member-owned electric co-ops serve about 1.7 million rural and suburban customers and supply almost a quarter of the state’s electricity.
Co-op utilities have by many measures lagged on clean energy. Many still rely on electricity from coal-fired power plants. They’ve used political clout with rural lawmakers to oppose new pollution regulations and climate legislation, and some have tried to levy steep fees on customers who install solar panels.
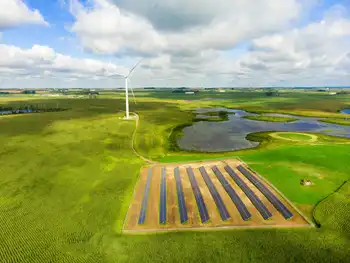
Where they are emerging as innovators is with new models and technology for managing electric grid loads — from load-shifting water heaters to a giant experimental battery made of iron. The programs are saving customers money by delaying the need for expensive new infrastructure, and also showing ways to unlock more value from cheap but variable wind and solar power.
Unlike investor-owned utilities, “we have no incentive to invest in new generation,” said Darrick Moe, executive director of the Minnesota Rural Electric Association. Curbing peak energy demand has a direct financial benefit for members.
Minnesota electric cooperatives have launched dozens of programs, such as the South Metro solar project, in recent years aimed at reducing energy use and peak loads, in particular. They include:
Cost calculations are the primary driver for electric cooperatives’ recent experimentation, and a lighter regulatory structure and evolving electricity market reforms have allowed them to act more quickly than for-profit utilities.
“Co-ops and [municipal utilities] can act a lot more nimbly compared to investor-owned utilities … which have to go through years of proceedings and discussions about cost-recovery,” said Gabe Chan, a University of Minnesota associate professor who has researched electric co-ops extensively. Often, approval from a local board is all that’s required to launch a venture.
Great River Energy’s programs, which are rebranded and sold through member co-ops, yielded more than 101 million kilowatt-hours of savings last year — enough to power 9,500 homes for a year.
Beyond lowering costs for participants and customers at large, the energy-saving and behavior-changing programs sometimes end up being cited as case studies by larger utilities considering similar offerings. Advocates supporting a proposal by the city of Minneapolis and CenterPoint Energy to allow residents to pay for energy efficiency improvements on their utility bills through distributed energy rebates used several examples from cooperatives.
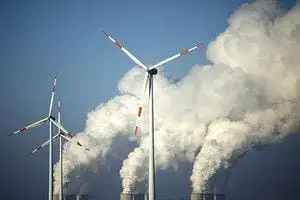
Despite the pace of innovation on load management, electric cooperatives have been relatively slow to transition from coal-fired power. More than half of Great River Energy’s electricity came from coal last year, and Dairyland Power, another major power wholesaler for Minnesota co-ops, generated 70% of its energy from coal. Meanwhile, Xcel Energy, the state’s largest investor-owned utility, has already reduced coal to about 20% of its energy mix.
The transition to cleaner power for some co-ops has been slowed by long-term contracts with power suppliers that have locked them into dirty power. Others have also been stalled by management or boards that have been resistant to change. John Farrell, director of the Institute for Local Self-Reliance’s Energy Democracy program, said generalizing co-ops is difficult.
“We’ve seen some co-ops that have got 75-year contracts for coal, that are invested in coal mines and using their newsletter to deny climate change,” he said. “Then you see a lot of them doing really amazing things like creating energy storage systems … and load balancing [programs], because they are unique and locally managed and can have that freedom to experiment without having to go through a regulatory process.”
Great River Energy, for its part, says it intends to reach 54% renewable generation by 2025, while some communities, like Frisco, Colorado, are targeting 100% clean electricity by specific dates. Its members recently voted to sell North Dakota’s largest coal plant, but the arrangement involves members continuing to buy power from the new owners for another decade.
The cooperative’s path to clean power could become clearer if its experimental iron-air battery project is successful. The project, the first of its kind in the country, is expected to be completed by 2023.
Related News