CSA Z463 Electrical Maintenance -
Our customized live online or in‑person group training can be delivered to your staff at your location.

- Live Online
- 6 hours Instructor-led
- Group Training Available
Regular Price:
$249
Coupon Price:
$199
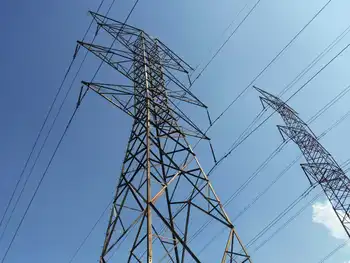
China Power Generation 2010 saw robust year-over-year growth across hydropower, thermal, nuclear, and wind, with rising installed capacity, higher utilization hours, and surging social electricity consumption across industrial, residential, and service sectors.
Key Information
China's 2010 power profile: output, capacity, utilization, and consumption, showing strong year-over-year growth.
- Hydropower output 614.8 bn kWh, up 17.5% YoY.
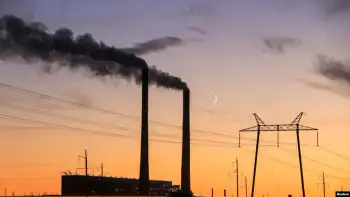
- Thermal output 3.02 tn kWh, up 13% YoY; nuclear 66.9 bn kWh, up 4.8%.
- Wind output 43.2 bn kWh; social consumption 3.83 tn kWh, up 15.78%.
- Installed capacity 902.57 GW; wind 26.09 GW, up 81.3% YoY.
From January through November 2010, China's national generation output of power plants generating more than 6 megawatts MW reached 3.77 trillion kilowatt-hours kWh, an increase of 14 year over year.
Of this, the output of hydropower reached 614.8 billion kWh, an increase of 17.5 year over year. Thermal power reached 3.02 trillion kWh, an increase of 13 year over year. Nuclear power output reached 66.9 billion kWh, an increase of 4.8 year over year, while wind power reached 43.2 billion kWh, amid broader generation output increases across the sector, according to the China Electricity Council.
From January to November 2010, the overall social power consumption of China reached 3.83 trillion kWh, an increase of 15.78 year over year, reflecting nationwide power consumption increases during 2010. The power consumption in November reached 346 billion kWh. From January through November 2010, the power consumption in the first industries agriculture, forestry, livestock, production and fisheries reached 91.5 billion kWh, an increase of 5.17 that of the second industries construction, manufacturing and energy production reached 2.86 trillion kWh, an increase of 17.22 that of the third industries services, hotels, insurance reached 357.5 billion kWh, an increase of 15.16. Household electricity consumption reached 469.9 billion kWh, up 12.77 year over year.
From January through November 2010, the national overall power consumption of industry reached 2.81 trillion kWh, an increase of 17 year over year, compared with earlier periods when consumption rose about 6% nationwide at the time.
As of the end of November 2010, the total installed capacity of power plants sized 6 MW or above in China reached 902.57 gigawatts GW, an increase of 10.8 year over year, even after the earlier power consumption declines seen in 2008. Of which, installed capacity of hydropower, thermal power, nuclear power and wind power reached 179.05 GW, 686.13 GW, 10.82 GW and 26.09 GW, an increase of 12.8, 8.6, 19.2 and 81.3 year over year, respectively.
From January to November 2010, the average accumulated utilization hours of power generation equipment in China reached 4,275 hours, an increase of 132 hours year over year, despite later reports of utilization declines of about 6%, in some segments. Of which, the average utilization hours of hydropower equipment reached 3,211 hours, an increase of 45 hours year over year and the average utilization hour of thermal power equipment reached 4,590 hours, an increase of 207 hours from the same period last year.
Related News
Related News
Ontario plunging into energy storage as electricity supply crunch looms
Ontario Energy Storage Procurement accelerates grid flexibility as IESO seeks lithium batteries, pumped storage, compressed…
View more
Why Is Central Asia Suffering From Severe Electricity Shortages?
Central Asia power shortages strain grids across Kazakhstan, Uzbekistan, Kyrgyzstan, Tajikistan, and Turkmenistan, driven by…
View more

Ireland: We are the global leaders in taking renewables onto the grid
Ireland 65% Renewable Grid Capability showcases world leading integration of intermittent wind and solar, smart…
View more
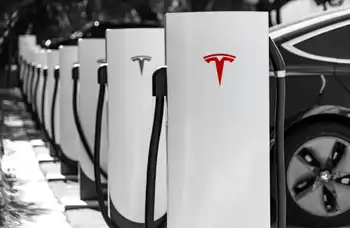
Tesla (TSLA) Wants to Become an Electricity Retailer
Tesla Energy Ventures Texas enters the deregulated market as a retail electricity provider, leveraging ERCOT,…
View more
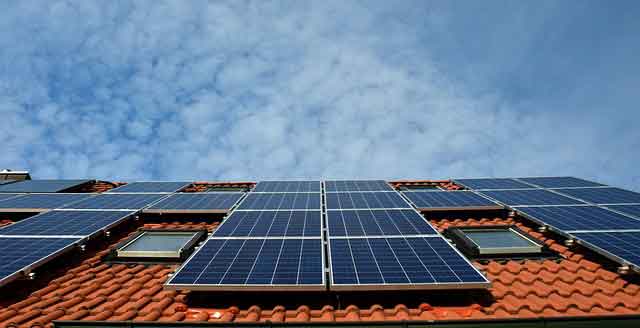
California’s Solar Power Cost Shift: A Misguided Policy Threatening Energy Equity
California Rooftop Solar Cost Shift examines PG&E rate hikes, net metering changes, and utility infrastructure…
View more

Shell says electricity to meet 60 percent of China's energy use by 2060
China 2060 Carbon-Neutral Energy Transition projects tripled electricity, rapid electrification, wind and solar dominance, scalable…
View more
Sign Up for Electricity Forum’s Newsletter
Stay informed with our FREE Newsletter — get the latest news, breakthrough technologies, and expert insights, delivered straight to your inbox.
Electricity Today T&D Magazine Subscribe for FREE

Stay informed with the latest T&D policies and technologies.
- Timely insights from industry experts
- Practical solutions T&D engineers
- Free access to every issue
