CSA Z462 Arc Flash Training – Electrical Safety Compliance Course
Our customized live online or in‑person group training can be delivered to your staff at your location.

- Live Online
- 6 hours Instructor-led
- Group Training Available
Regular Price:
$249
Coupon Price:
$199
Overall costs to build the John W. Turk Jr. coal-fired power plant near Texarkana have now surpassed the $2 billion mark.
Yet plant opponents contend in a study, of which the Arkansas Democrat-Gazette obtained an advance copy, that additional factors will push the price tag far higher than Southwestern Electric Power Co. is letting on.
"Who are they trying to kid?" asked Ken Smith, executive director of the Audubon Society of Arkansas, who presented the study to officials with the Arkansas Public Service Commission and state Attorney General's office. "They're on a cost trajectory that we've been saying they would be all along."
SWEPCO officials said that they were familiar with the criticism launched by the Turk project's foes.
"This is another delay tactic in a long list of delay tactics over time aimed at derailing the Turk project, which SWEPCO has justified in testimony and continues to support as the best fuel option for its customer base," SWEPCO spokesman Scott McCloud said.
In its latest status report to state utility regulators earlier this month, SWEPCO disclosed that delays in securing an air permit from the Arkansas Department of Environmental Quality have increased the cost projection for the plant itself to $1.63 billion.
That's 25 percent more than the $1.3 billion figure that surfaced when SWEPCO announced in August 2006 that it was building the 600-megawatt facility - and up 7 percent from a more-recent estimate of $1.52 billion.
But plant costs are only part of the entire project, which SWEPCO says it needs to prevent future electricity shortages to its 113,500 customers who mostly live in western Arkansas, northwest Louisiana and northeast Texas.
Power lines, substations and other upgrades needed to link Turk to the electric grid are projected to cost $89 million.
Then there is the $343 million deal that SWEPCO struck with state and federal officials last year to help secure Turk's air permit. It calls for SWEPCO to reduce emissions from a nearby Texas plant to offset "visibility impacts" from Turk in the Caney Creek Wilderness Area near Mena.
When added to the plant itself, overall costs related to the project amount to $2.06 billion. And they are not expected to stop there.
SWEPCO also noted in its filing that delays in obtaining an environmental permit for areas controlled by the U.S. Army Corps of Engineers could push Turk's start-up beyond October 2012 "as well as further increase the cost."
Enter a 61-page report commissioned by Audubon Arkansas, one of several groups trying to halt the Turk plant's construction. It was prepared by Little Rockbased consulting group Histecon Associates Inc. at a cost of $28,000, Smith said.
The study predicts that Turk's building costs - without new lines, permit concessions or other finance-related costs - could jump an additional $400 million by 2013.
That finding was based on construction costs for non-nuclear power plants having risen 80 percent since 2000, the report indicates. Should such increases occur, they would push project costs for Turk to near $2.5 billion.
The report also outlined higher long-term costs associated with relying on coal rather than natural gas to meet power demand.
Based on coal-delivery costs that increased about 15 percent a year between 2000 and 2005 - and projected carbon emissions costs of $15 to $45 a ton based on potential regulatory moves - SWEPCO ratepayers could end up paying between $2 billion to $3 billion more over 40 years than if Turk were a natural gas-fired plant, the report states.
Had SWEPCO chosen to build such a plant for base-load use, the report also projected customer savings over 40 years between $130 million and $300 million.
Smith said that such findings show how SWEPCO has misled customers by failing to account for such long-term expenses when discussing Turk's cost.
Had such costs been included, earlier projections by SWEPCO of selling Turk's power for 9 cents per kilowatt hour would increase to between 12.7 to 14.5 cents per kilowatt hour, the report finds.
"The real issue that I found amazing in this report is the real costs that this plant will have for ratepayers," Smith said. "Of course, I have a personal slant to this. I'll be the first one to admit it. But for anyone with common sense, this cannot help but show that the best way forward is by pushing energy efficiency, renewable energy and natural gas for our future energy needs."
SWEPCO reiterated its stand that coal-fired power is the best long-term option to produce cost-efficient electricity.
Company officials also noted that natural-gas plants, like coal plants, are also subject to prospective carbon emissions regulatory costs.
"When completed in late 2012, Turk will be one of the cleanest coal plants in the country, with advanced coal-combustion technology, state-of-the-art emissions controls and the design option for future addition of carbon-capture equipment as that technology advances," McCloud said.
Projects such as Turk have become increasingly rare in recent years as global-warming concerns have made such projects unpopular with regulators and environmental groups. During 2007 and 2008, at least 76 coal-fired projects nationwide were canceled or delayed, according to media reports and anti-coal organizations.
AES Corp. announced it was canceling a planned 630-megawatt expansion of its 320-megawatt Shady Point plant near Poteau, Okla., not far from Fort Smith.
AES spokesman Lundy Kiger said the decision was part of a "broader strategy" to re-evaluate the company's long-term growth plans.
Related News
California Skirts Blackouts With Heat Wave to Test Grid Again
California Heatwave Power Crisis strains CAISO as record demand triggers emergency alerts, demand response, and…
View more
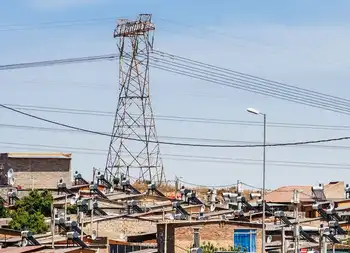
South Africa's Eskom could buy less power from wind farms during lockdown
Eskom Wind Power Curtailment reflects South Africa's lockdown-driven drop in electricity demand, prompting grid-balancing measures…
View more
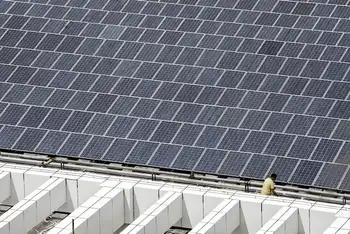
Cheap at Last, Batteries Are Making a Solar Dream Come True
Solar Plus Storage is accelerating across utilities and microgrids, pairing rooftop solar with lithium-ion batteries…
View more
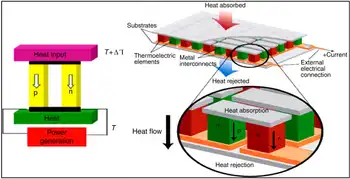
A new approach finds materials that can turn waste heat into electricity
Thermoelectric Materials convert waste heat into electricity via the Seebeck effect; quantum computations and semiconductors…
View more

Abu Dhabi seeks investors to build hydrogen-export facilities
ADNOC Hydrogen Export Projects target global energy transition, courting investors and equity stakes for blue…
View more
State-owned electricity generation firm could save Britons nearly 21bn a year?
Great British Energy could cut UK electricity costs via public ownership, investing in clean energy…
View more
Sign Up for Electricity Forum’s Newsletter
Stay informed with our FREE Newsletter — get the latest news, breakthrough technologies, and expert insights, delivered straight to your inbox.
Electricity Today T&D Magazine Subscribe for FREE

Stay informed with the latest T&D policies and technologies.
- Timely insights from industry experts
- Practical solutions T&D engineers
- Free access to every issue
