Substation Relay Protection Training
Our customized live online or in‑person group training can be delivered to your staff at your location.

- Live Online
- 12 hours Instructor-led
- Group Training Available
Regular Price:
$699
Coupon Price:
$599
Dongfang Electric 2009 achievements include sharp shifts to hydropower and wind power, a 1,000 MW nuclear unit, expanded turbine capacity, overseas exports and contracts, and $5.41B sales with 10% growth amid reduced thermal orders.
Story Summary
More hydro and wind, 1,000 MW nuclear debut, strong exports, and 10% revenue growth despite fewer thermal orders.
- Thermal share fell from 80% to 45% by 2009
- Hydropower rose to 24%; wind power to 15% in 2009
- Built China's first 1,000 MW nuclear unit in 2009
- Top-three wind OEM; 1,000 turbines/year, 20% capacity
- $2B exports; 50+ overseas projects worth $7B
Through large-scale structural adjustment, Dongfang Electric Corporation (DEC) — one of the top three power equipment manufacturers in China — received $8.77 billion in new orders in 2009, including $2 billion in overseas orders, according to a DEC executive.
Thermal power equipment accounted for 80% of the total share a few years ago, but the proportion was reduced to 45%, while the proportion of hydropower and wind power increased sharply to 24% and 15%, respectively, in 2009, as installed capacity surpassed 800 GW across the country. In addition to the structural change, DEC's manufacture capacity has been largely improved, too.
For hydropower and thermal power units, its manufacture capability went from 300 megawatts (MW) to 600 MW, then to 1,000 MW, as power generation rose 14% across the country, spurring demand. In 2009, DEC successfully manufactured and delivered the first 1,000-MW nuclear power unit in China. In wind power, DEC has been promoted to the top-three wind power equipment manufacturers in China, with an annual production capacity of 1,000 sets of wind turbines, accounting for 20% of total production capacity.
In 2009, DEC achieved a great success in overseas market expansion, with $2 billion in export contract value. In the past year, DEC exported 18 sets of power generation equipment to Brazil for the first time, and two 600-MW coal-fired units to Saudi Arabia, the middle and high-end market of the Middle East, while also winning 660-MW units for India to broaden its footprint. So far, DEC has more than 50 overseas projects under construction, with a total contract value of $7 billion.
In 2009, DEC's sales income reached $5.41 billion, a year-over-year growth of 10%, and industrial production value reached $5.66 billion. However, due to the decrease of new thermal power and hydropower projects and lower equipment utilization across the sector, the number of new orders recently dropped.
Additionally, DEC's reconstruction after the 5.12 quake disaster has been progressing smoothly, and most of the relocation work has been done. It's expected that both the overall business income and industrial production value of DEC will surpass $5.8 billion in 2010, as power investment neared $107 billion in the same year, supporting recovery.
Related News
Related News
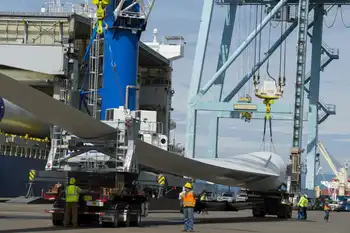
27 giant parts from China to be transported to wind farm in Saskatchewan
Port of Vancouver Wind Turbine Blades arrive from China for a Saskatchewan wind farm, showcasing…
View more
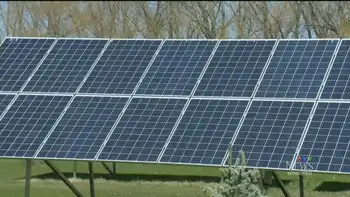
Sycamore Energy taking Manitoba Hydro to court, alleging it 'badly mismanaged' Solar Energy Program
Sycamore Energy Manitoba Hydro Lawsuit centers on alleged mismanagement of the solar rebate incentive program,…
View more

Egypt's renewable energy to reach 6.6 GW by year-end
Egypt Renewable Energy Expansion targets solar and wind power projects to diversify the energy mix,…
View more
Blood Nickel and Canada's Role in Global Mining Sustainability
Blood Nickel spotlights ethical sourcing in the EV supply chain, linking nickel mining to human…
View more
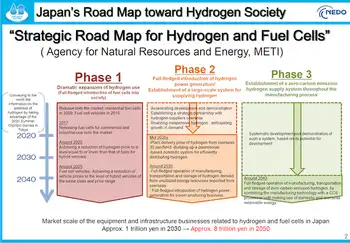
Toshiba, Tohoku Electric Power and Iwatani start development of large H2 energy system
Fukushima Hydrogen Energy System leverages a 10,000 kW H2 production hub for grid balancing, demand…
View more

Vancouver's Reversal on Gas Appliances
Vancouver Natural Gas Ban Reversal spotlights energy policy, electrification tradeoffs, heat pumps, emissions, grid reliability,…
View more
Sign Up for Electricity Forum’s Newsletter
Stay informed with our FREE Newsletter — get the latest news, breakthrough technologies, and expert insights, delivered straight to your inbox.
Electricity Today T&D Magazine Subscribe for FREE

Stay informed with the latest T&D policies and technologies.
- Timely insights from industry experts
- Practical solutions T&D engineers
- Free access to every issue
