NFPA 70E Training
Our customized live online or in‑person group training can be delivered to your staff at your location.

- Live Online
- 6 hours Instructor-led
- Group Training Available
Regular Price:
$199
Coupon Price:
$149
When it comes to forcing open the French electricity market, only one method works well: the big stick.
Witness the success of the Italian government in obliging Electricite de France (EdF), the state near-monopoly, to offer French generating assets to Enel, Italy's biggest generator.
After two years of talks, Enel boss Paolo Scaroni is poised to acquire a 35% stake in French coal generator SNET, 12.5% of the first six French new-generation nuclear reactors of the EPR type, and build two combined-cycle gas plants in France.
The stake in SNET, which operates eight French coal-fired stations with capacity of 2,474MW, will be sold by EdF and state- owned sister Charbonnages de France, the rump coal company. Enel's investment partner, which has bought the other 65%, will be Spanish utility Endesa.
Endesa was allowed to buy into SNET after its government blocked EdF's acquisition strategy in Spain, protesting the French market was closed to competition. Enel's entry is thanks to an Italian law that has blocked EdF exercising control over its Italian associate. Enel will get a 3% foothold in France's electricity market.
The success of Endesa and Enel in breaking EdF's monopoly contrasts with Britain's long-privatised utilities, which have yet to win a toehold in France. Whitehall's laissez-faire has let EdF Energy become one of the biggest players in UK electricity, with 25% of the distribution market, with nothing in exchange.
The deals cement the need for a flotation of EdF this autumn. Not only has the Italian government made the Edison deal conditional upon the float, but EdF, which has shareholder funds of only E8.4bn ($10.8bn, Pounds 5.7bn) for debts of E19.7bn, will need E10bn from the offering to rebuild its balance sheet.
One glitch is the European Commission, which could look askance at Enel's favourable entry terms into France.
Related News
Air Conditioning Related Power Usage Set To Create Power Shortages In Many States
Texas Power Grid Blackouts loom as ERCOT forecasts record air conditioning load, tight reserve margins,…
View more

Brazil government considers emergency Coronavirus loans for power sector
Brazil Energy Emergency Loan Package aims to bolster utilities via BNDES as coronavirus curbs electricity…
View more
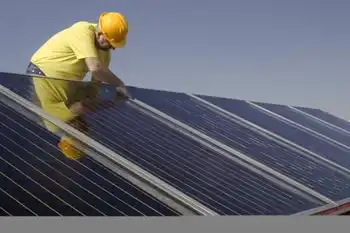
Avista Commissions Largest Solar Array in Washington
Adams Nielson Solar Array, a 28 MW DC utility-scale project in Lind, WA, spans 200…
View more
TransAlta Poised to Finalize Alberta Data Centre Agreement in 2025
TransAlta Alberta Data Centre integrates AI, cloud computing, and renewable energy, tackling electricity demand, grid…
View more
Why rolling back European electricity prices is tougher than appears
EU Energy Price Crisis drives soaring electricity bills as natural gas sets pay-as-clear power prices;…
View more
Pickering NGS life extensions steer Ontario towards zero carbon horizon
OPG Pickering Nuclear Refurbishment extends four CANDU reactors to bolster Ontario clean energy, grid reliability,…
View more
Sign Up for Electricity Forum’s Newsletter
Stay informed with our FREE Newsletter — get the latest news, breakthrough technologies, and expert insights, delivered straight to your inbox.
Electricity Today T&D Magazine Subscribe for FREE

Stay informed with the latest T&D policies and technologies.
- Timely insights from industry experts
- Practical solutions T&D engineers
- Free access to every issue
