High Voltage Maintenance Training Online
Our customized live online or in‑person group training can be delivered to your staff at your location.

- Live Online
- 12 hours Instructor-led
- Group Training Available
Regular Price:
$599
Coupon Price:
$499
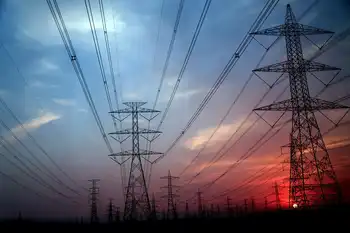
JCP&L Helicopter Inspections improve grid reliability with aerial patrols of transmission lines and substations, accelerating maintenance, outage prevention, and repairs through low-hover surveys, high-resolution photos, and rapid reporting to operations across the utility's service territory.
What's Going On
Regular aerial patrols that assess transmission assets to boost reliability, speed repairs, and prevent outages.
- Patrols twice yearly via helicopter across transmission network
- Low hovers near substations and lines for detailed visual checks
- 12-15 days to complete, weather and scheduling dependent
- Photo findings sent to operations for rapid repair action
- Part of $251M 2014 infrastructure investment for reliability
Jersey Central Power & Light JCP&L will be using helicopter patrols beginning March 3, 2014, to conduct transmission line inspections throughout its northern and central New Jersey service areas.
"Completing these routine inspections via helicopter patrols is an effective way to assure our high voltage system remains reliable," said Anthony Hurley, vice president, Operations, JCP&L. "The helicopter can provide workers with a clear view of our overhead equipment far more quickly and easily than workers on the ground using trucks and aerial devices."
JCP&L's transmission lines are patrolled at least twice each year, with related utility pole inspections scheduled regularly as well. The patrols typically take 12 – 15 days to complete, depending on weather and other conditions, such as vegetation management needs, and scheduling requirements. Local law enforcement agencies will be notified before the helicopter inspections take place.
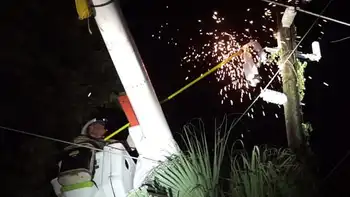
During the inspection process, helicopters will hover low in areas near substations and transmission lines. When an issue is identified, a notification, along with a photograph, is forwarded to the appropriate operations area so the repair can be made.
The aerial transmission line patrols are part of JCP&L's $251 million investment in 2014 to expand and strengthen its infrastructure to enhance reliability of service.
Related News
Related News

Washington Australia announces $600 electricity bill bonus for every household
WA $600 Electricity Credit supports households with power bills as a budget stimulus, delivering an…
View more
Restoring power to Florida will take 'weeks, not days' in some areas
Florida Hurricane Irma Power Outages strain the grid as utilities plan rebuilds; FPL and Duke…
View more
Ontario to Provide New and Expanded Energy-Efficiency Programs
Ontario CDM Programs expand energy efficiency, demand response, and DER incentives via IESO's Save on…
View more
How Electricity Gets Priced in Europe and How That May Change
EU Power Market Overhaul targets soaring electricity prices by decoupling gas from power, boosting renewables,…
View more

Ontario Ministry of Energy proposes growing hydrogen economy through reduced electricity rates
Ontario Hydrogen Strategy accelerates green hydrogen via electrolysis, reduced electricity rates, and IESO pilots, leveraging…
View more

No public details for Newfoundland electricity rate mitigation talks
Muskrat Falls rate mitigation progresses as Newfoundland and Labrador and Ottawa align under the updated…
View more
Sign Up for Electricity Forum’s Newsletter
Stay informed with our FREE Newsletter — get the latest news, breakthrough technologies, and expert insights, delivered straight to your inbox.
Electricity Today T&D Magazine Subscribe for FREE

Stay informed with the latest T&D policies and technologies.
- Timely insights from industry experts
- Practical solutions T&D engineers
- Free access to every issue

