
Substation Relay Protection Training
Our customized live online or in‑person group training can be delivered to your staff at your location.

- Live Online
- 12 hours Instructor-led
- Group Training Available
Regular Price:
$699
Coupon Price:
$599
CARSON CITY
—
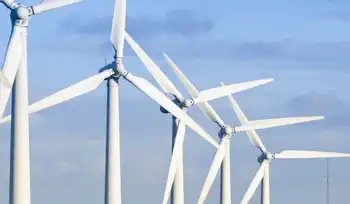
Nevada Renewable Portfolio Standard 2030 targets 50% clean energy, advancing solar, geothermal, and wind, cutting GHG emissions, phasing out coal, and expanding storage, EV infrastructure, and in-state renewables under PUCN oversight and tax abatements.
The Latest Developments
A state mandate requiring 50% of electricity from renewables by 2030, driving solar, geothermal, wind, and storage.
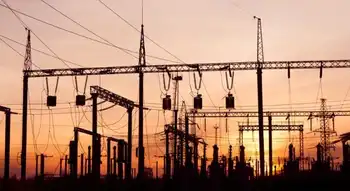
PUCN oversight ensures compliance and grid reliability.
6.117 GW renewable capacity, 1.332 GW added in 2021 via tax abatements.
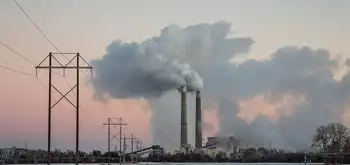
Coal fleet phased out; gas still dominant but declining share.
RETA program spurs jobs, wages, and in-state investment.
Expanded storage and EV charging support emissions cuts to 2050 goal.
Nevada is on track to meet its Renewable Portfolio Standard of 50% of electricity generated by renewable energy sources by 2030, according to the Governor's Office of Energy's annual Status of Energy Report.
Based on compliance reports the Public Utilities Commission of Nevada has received, across all providers, about 20% of power is currently generated by renewable resources, and, nationally, renewables ranked second in 2020 as filings show Nevada's investor-owned utility and other power providers have plans to reach the state's ambitious RPS of 50% by 2030, according to the report released Jan. 28.
"Because transportation and electricity generation are Nevada's two largest contributors to greenhouse gas emissions, GOE's program work in 2021 underscored our focus on transportation electrification and reaching the state's legislatively required renewable portfolio standard," GOE Director David Bobzien said in a statement Jan. 28. "While electricity generated from renewable resources currently accounts for about 25% of the state's electricity, a share similar to projections that renewables will soon provide about one-fourth of U.S. electricity overall, we continue to collaborate with the Public Utilities Commission of Nevada, electricity providers, the renewable energy industry and conservation organizations to ensure Nevada reaches our target of 50% clean energy by 2030."
The state's RPS, enacted in 1997 and last modified in 2019, requires an increase in renewable energy, starting with 22% in 2020 and increasing to 50% by 2030. The increase in renewables will reduce GHG emissions and help the state reach its goal of 100% carbon-free power by 2050, while states like Rhode Island have a 100% by 2030 plan, highlighting varying timelines.
Renewable additions
The state added 1.332 GW of renewable capacity in 2021 as part of the Renewable Energy Tax Abatement program, at a time when U.S. renewable energy hit a record 28% in April, for a total renewable capacity of 6.117 GW, according to the report.
The RETA program awards partial sales and use tax and partial property-tax abatements to eligible renewable energy facilities, which increase Nevada's tax revenue and create jobs in a growing industry. Eligible projects must employ at least 50% Nevada workers, pay 175% of Nevada's average wage during construction, and offer health care benefits to workers and their dependents.
Since its adoption in 2010, the GOE has approved 60 projects, including large-scale solar PV, solar thermal, biomass, geothermal and wind projects throughout the state, according to the report. Projects granted abatements in 2021 include:
- 100-MW Citadel Solar Project
- 150-MW Dry Lake Solar + Storage Project
- 714-MW Gemini Solar Project
- 55-MW North Valley Power Geothermal Project
- 113-MW Boulder Flats Solar Project
- 200-MW Arrow Canyon Solar Project
"Nevada does not produce fossil fuels of any significant amount, and gasoline, jet fuel and natural gas for electricity or direct use must be imported," according to the report. "Transitioning to domestically produced renewable resources and electrified transportation can provide cost savings to Nevada residents and businesses, as seen in Idaho's largely renewable mix today, while reducing GHG emissions. About 86% of the fuel for energy that Nevada consumes comes from outside the state."
Phasing out coal plants
Currently, more than two-thirds of the state's electricity is produced by natural gas-fired power plants, with renewables covering most of the remaining generation, according to the report. Nevada continues to phase out its remaining coal power plants, as renewables surpassed coal nationwide in 2022, which provide less than 10% of produced electricity.
"Nevada has seen a significant increase in capturing its abundant renewable energy resources such as solar and geothermal," according to the report. "Renewable energy production continues to grow, powering Nevada homes and business and serves to diversify the state's economy by exporting solar and geothermal to neighboring states, as California neared 100% renewable electricity for the first time. Nevada has more than tripled its renewable energy production since 2011."
Related News
Related News

Told "no" 37 times, this Indigenous-owned company brought electricity to James Bay anyway
Five Nations Energy Transmission Line connects remote First Nations to the Ontario power grid, delivering…
View more
Over 30% of Global Electricity from Renewables
Global Renewable Electricity Milestone signals solar, wind, hydro, and geothermal surpass 30% of power generation,…
View more
California Blackouts reveal lapses in power supply
California Electricity Reliability covers grid resilience amid heat waves, rolling blackouts, renewable energy integration, resource…
View more
Germany turns its back on nuclear for good despite Europe's energy crisis
Germany nuclear phase-out underscores a high-stakes energy transition, trading reactors for renewables, LNG imports, and…
View more
Report: Duke Energy to release climate report under investor pressure
Duke Energy zero-coal 2050 plan outlines a decarbonized energy mix, aligning with Paris goals, cutting…
View more
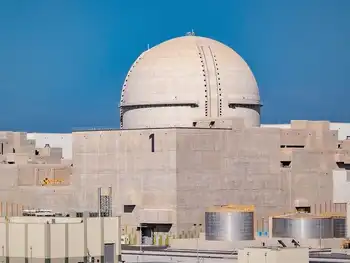
Barakah Unit 1 reaches 100% power as it steps closer to commercial operations, due to begin early 2021
Barakah Unit 1 100 Percent Power signals the APR-1400 reactor delivering 1400MW of clean baseload…
View more
Sign Up for Electricity Forum’s Newsletter
Stay informed with our FREE Newsletter — get the latest news, breakthrough technologies, and expert insights, delivered straight to your inbox.
Electricity Today T&D Magazine Subscribe for FREE

Stay informed with the latest T&D policies and technologies.
- Timely insights from industry experts
- Practical solutions T&D engineers
- Free access to every issue

