NFPA 70E Training
Our customized live online or in‑person group training can be delivered to your staff at your location.

- Live Online
- 6 hours Instructor-led
- Group Training Available
Regular Price:
$199
Coupon Price:
$149
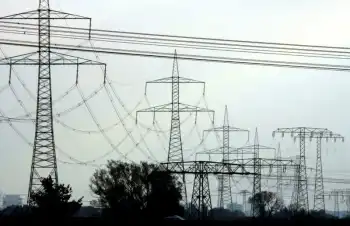
Wind Turbine Shadow Flicker disrupts Summerside residents at sunset, causing headaches, nausea, and strobing glare. Neighbours seek mitigation like shutters or awnings as the city resists daily turbine shutdowns to protect renewable energy output.
Breaking Down the Details
A strobing light-and-shadow from turbine blades at low sun, causing discomfort and headaches in nearby residents.
- Occurs when sun aligns with rotating blades, casting strobing shadows.
- Most intense at sunrise or sunset; duration about an hour.
- Triggers headaches, nausea, and eye strain in sensitive individuals.
- Mitigation options include window shutters, awnings, or targeted curtailment.
- Daily shutdowns reduce output; one hour could cost ~$100,000 per year.
People living in the shadow of a group of wind turbines in Summerside, P.E.I., are complaining about the flickering light caused by the energy producers.
Emmett Curley has enjoyed living in the area for 15 years, but says things have become unbearable since the wind turbines arrived a year ago.
"Last summer when it started, I left my house. I just couldn't stand it. I've had friends over that left during the situation, saying, 'I'm starting to get a headache,'" Curley said.
The problem comes when the sun sets and its light passes through the turbines, creating a flickering effect of shadow and light that has fueled restrictions on turbine siting in some regions today. It lasts for about an hour.
"I'm lined up with two turbines that give me a double flicker. You can't watch TV, you can't read a book, a newspaper, you can't work on a computer because your eyes are constantly adjusting to light and dark," he said. "Green energy is a great thing, but when it interferes with life, health — no, something has to be done."
Other neighbours also said they were annoyed by the flickering, despite turbine complaints dismissed as absurd in other places today. One told CBC News that her daughter feels sick to her stomach when it happens and the family has to spend part of their summer evenings in the basement.
Most want the city to shut the turbines off for the hour at sunset when the flicker happens, but the city said that is unlikely, partly due to billing rules that stymie turbine use in some markets today.
Greg Gaudet of Summerside Municipal Services said the city could provide options such as shutters or awnings for area residents.
He said shutting down the turbines for an hour each day would cost about $100,000 in lost energy over the course of a year.
"Obviously the city doesn't want to invest a large amount of money to create renewable energy, which is good for the environment, and then have to reduce those energies, even as an ugly battle over clean power continues nationally today," he said.
"Obviously that's one of the last solutions the city would look at, even as wind farm opponents fear sweeping legislation in other jurisdictions today."
Related News
Related News
Key Ontario power system staff may end up locked down at work sites due to COVID-19, operator says
Ontario IESO COVID-19 Control Room Measures detail how essential operators safeguard the electricity grid with…
View more
Disrupting Electricity? This Startup Is Digitizing Our Very Analog Electrical System
Solid-State AC Switching reimagines electrification with silicon-based, firmware-driven controls, smart outlets, programmable circuit breakers, AC-DC…
View more
Power Outages to Mitigate Wildfire Risks
Colorado Wildfire Power Shutoffs reduce ignition risk through PSPS, grid safety protocols, data-driven forecasts, and…
View more
Scientists generate 'electricity from thin air.' Humidity could be a boundless source of energy.
Air Humidity Energy Harvesting converts thin air into clean electricity using air-gen devices with nanopores,…
View more

Can COVID-19 accelerate funding for access to electricity?
Africa Energy Access Funding faces disbursement bottlenecks as SDG 7 goals demand investment in decentralized…
View more

Flowing with current, Frisco, Colorado wants 100% clean electricity
Frisco 100% Renewable Electricity Goal outlines decarbonization via Xcel Energy, wind, solar, and battery storage,…
View more
Sign Up for Electricity Forum’s Newsletter
Stay informed with our FREE Newsletter — get the latest news, breakthrough technologies, and expert insights, delivered straight to your inbox.
Electricity Today T&D Magazine Subscribe for FREE

Stay informed with the latest T&D policies and technologies.
- Timely insights from industry experts
- Practical solutions T&D engineers
- Free access to every issue
