TVA looks to renewable sources

By Knoxville News Sentinel


Substation Relay Protection Training

Our customized live online or in‑person group training can be delivered to your staff at your location.

  • Live Online
  • 12 hours Instructor-led
  • Group Training Available
Regular Price:
$699
Coupon Price:
$599
Reserve Your Seat Today
TVA, which has an increased emphasis on clean energy, renewable energy and energy efficiency, has two contracts for renewable energy with Waste Management in Tennessee.

TVA has just signed a 20-year contract with Waste Management to buy 4.8 megawatts of power from a landfill-biogas facility at Camden in West Tennessee. That contract is the first in TVA's new renewable standard offer initiative.

TVA pays a set price — or a "standard offer" — for renewable power based on the time of day the electricity is available to the TVA power grid. TVA's Renewable Standard Offer initially will be limited to a total of 100 megawatts from all participants, with no single renewable technology representing more than 50 megawatts of the total.

The Chestnut Ridge facility along the Knox-Anderson county line has been providing electricity for about 1,600 homes that are KUB customers. TVA and Waste Management have been partners in the Chestnut Ridge power contract for nearly 20 years.

TVA also buys power — 3 megawatts — from methane facilities at Middle Point Landfill in Murfreesboro, Tenn., and 8 megawatts from the city of Memphis wastewater treatment plant.

TVA spokesman Mike Bradley said the agency does not discuss pricing for the renewable energy contracts, citing the information as "business sensitive."

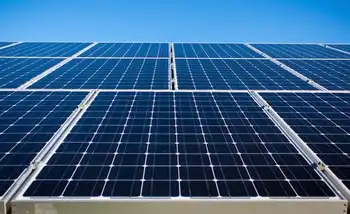
TVA, which also gets renewable energy from wind, solar and biomass and customers, has an agreement with the state of Tennessee to buy up to 5 megawatts of electricity from a solar farm being built in Haywood County in West Tennessee. The University of Tennessee and the state are developing that facility.

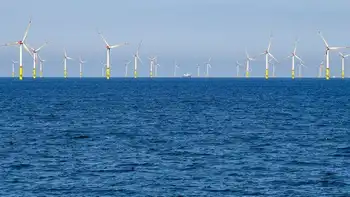
The agency has added 1,625 megawatts of wind energy — 300 megawatts from an Illinois company and 29 megawatts from the Buffalo Mountain turbines near Oliver Springs.

TVA's Generation Partners program — for very small power producers — includes more than 560 participants that produce about 65 megawatts of power from solar biomass, wind and low-impact hydro generation.

Related News

Feds to study using electricity to 'reduce or eliminate' fossil fuels

Electrification Potential Study for Canada evaluates NRCan's decarbonization roadmap, assessing electrification of end uses and replacements for fossil fuels across transportation, buildings, and industry, including propane, diesel, natural gas, and coal, to guide energy policy.


Key Points

An NRCan study assessing electrification to replace fossil fuels across sectors and guide deep decarbonization R&D.

✅ Evaluates non-electric alternatives alongside electrification paths

✅ Covers propane, diesel, natural gas, and coal end uses

✅ Guides NRCan R&D priorities for deep decarbonization


The federal government wants to spend up to $300,000 on a study aimed at understanding whether existing electrical technologies can “reduce or eliminate” fossil fuels used for virtually every purpose other than generating electricity.

The proposal has caused consternation within the Saskatchewan government, whose premier has criticized a 2035 net-zero grid target as shifting the goalposts, and which has spent months attacking federal policies it believes will harm the Western Canadian energy sector without meaningfully addressing climate change.

Procurement documents indicate the “Electrification Potential Study for Canada” will provide “strategic guidance on the need to pursue both electric and non-electric energy research and development to enable deep decarbonisation scenarios.”

“It is critical that (Natural Resources Canada) as a whole have a cross-sectoral, consistent, and comprehensive understanding of the viability of electric technologies as a replacement for fossil fuels,” the documents state.

The study proponent will be asked to examine possible replacements for a range of fuels, including propane, transportation fuel, fuel oil, diesel, natural gas and coal, even as Alberta maps a path to clean electricity for its grid. Only international travel fuel and electricity generation are outside the scope of the study.

“To be clear, the consultant should not answer these questions directly, but should conduct the analysis with them in mind. The goal … is to collate data which can be used by (Natural Resources Canada) to conduct analysis related to these questions,” the documents state.

Natural Resources Canada issued the request for proposals one week before Prime Minister Justin Trudeau officially launched a 40-day election campaign in which climate and energy policy, including debates over Alberta's power market like a Calgary retailer's challenge, is expected to play a defining role.

It also comes as the federal government works to complete the controversial Trans Mountain Pipeline Expansion project through British Columbia, amid tariff threats boosting support for Canadian energy projects, which it bought last year for $4.5 billion and is currently bogged down in the court system.

A Natural Resources Canada spokeswoman said the ministry would not be able to respond to questions until sometime on Thursday.

While the documents make clear that the study aims to answer unresolved questions about what the International Energy Agency calls an increasingly-electric future, with clean grid and storage trends emerging, without a specific timeline, the provincial government is far from thrilled.

Energy and Resources Minister Bronwyn Eyre said the document reflects the federal government’s “hostility” to the energy sector, even as Alberta's electricity sector faces profound change, because government ministries like Natural Resources Canada don’t do anything without political direction.

Asked whether a responsible government should consider every option before taking a decision, Eyre said a government that was not interested in eliminating fossil fuels entirely would not have used such “strong” language in a public document, noting that provinces like Ontario are grappling with hydro system problems as well.

“I think it’s a real wake-up call to what (Ottawa’s) endgame really is here,” she said, adding that the document does not ask the proponent to conduct an economic impact analysis or consider potential job losses in the energy sector.

The study is organized by Natural Resources Canada’s office of energy research and development, which is tasked with accelerating energy technology “in order to produce and use energy in … more clean and efficient ways,” the documents state.

Bidding on the proposal closes Oct. 14, one week before the federal election. The successful proponent must deliver a final report in April 2020, according to the documents.


Related News

View more

Power outage update: 252,596 remain without electricity Wednesday

North Carolina Power Outages continue after Hurricane Florence, with Wilmington and Eastern Carolina facing flooding, storm damage, and limited access as Duke Energy crews and mutual aid work on restoration across affected counties.


Key Points

Outages after Hurricane Florence, with Wilmington and Eastern Carolina hardest hit as crews restore service amid floods.

✅ Over 250,000 outages statewide as of early Wednesday

✅ Wilmington cut off by flooding, hindering utility access

✅ Duke Energy and EMC crews conduct phased restoration


Power is slowly being restored to Eastern Carolina residents after Hurricane Florence made landfall near Wilmington on Friday, September 15, a scenario echoed by storm-related outages in Tennessee in recent days.

On Monday, more than half a million people remained without power across the state, a situation comparable to post-typhoon electricity losses in Hong Kong reported elsewhere.

As of Wednesday morning at 1am, the Dept. of Public Safety reports 252,596 total power outages in North Carolina, and utilities continue warning about copper theft hazards during restoration.

More than half of those customers are in Eastern Carolina.

More than 32,000 customers are without power in Carteret County and roughly 21,000 are without power in Onslow County.

In Craven County, roughly 15,000 people remain without power Wednesday morning.

Many of the state's outages are effecting the Wilmington area, where Florence made landfall and widespread flooding is still cutting off the city from outside resources, similar to how a fire-triggered outage in Los Angeles disrupted service regionally.

Heavy rain, strong winds and now flooded roadways have hindered power crews, challenges that utility climate adaptation aims to address while many of them have out-of-state or out-of-town help working to restore power to so many people.

Here's a breakdown of current outages by utility company:

DUKE ENERGY PROGRESS - 

  • 1,350 in Beaufort Co. 
  • 10,706 in Carteret Co. 
  • 2,716 in Pamlico Co. 
  • 7,422 in Craven Co. 
  • 1,687 in Jones Co. 
  • 13,319 in Onslow Co. 
  • 7,452 in Pender Co. 
  • 48,281 in New Hanover Co. 
  • 5,257 in Duplin Co. 
  • 488 in Lenoir Co. 
  • 1,231 in Pitt Co.


JONES-ONSLOW EMC - 10,964 total 

  • 7,699 in Onslow Co. 
  • 2,366 in Pender Co. 
  • 816 in Jones Co.

TIDELAND EMC - 

  • 174 in Beaufort Co.
  • 1,521 in Craven Co.
  • 1,693 in Pamlico Co.

CARTERET-CRAVEN ELECTRIC CO OP- 

  • 21,974 in Carteret Co. 
  • 6,553 in Craven Co.
  • 216 in Jones Co.


Related News

View more

PG&E says power lines may have started 2 California fires

PG&E Wildfire Blackouts highlight California power shutoffs as high winds and suspected transmission line faults trigger evacuations, CPUC investigations, and grid safety reviews, with utilities weighing risk, compliance, and resilience during Santa Ana conditions.


Key Points

PG&E Wildfire Blackouts are outages during wind-driven fire threats linked to power lines, spurring CPUC investigations.

✅ Wind and line faults suspected amid Lafayette evacuations

✅ CPUC to probe shutoffs, notifications, and compliance

✅ Utilities plan more outages as Santa Ana winds return


Pacific Gas & Electric Co. power lines may have started two wildfires over the weekend in the San Francisco Bay Area, the utility said Monday, even though widespread blackouts were in place to prevent downed lines from starting fires during dangerously windy weather.

The fires described in PG&E reports to state regulators match blazes that destroyed a tennis club and forced evacuations in Lafayette, about 20 miles (32 kilometres) east of San Francisco.

The fires began in a section of town where PG&E had opted to keep the lights on. The sites were not designated as a high fire risk, the company said.

Powerful winds were driving multiple fires across California and forcing power shut-offs intended to prevent blazes, even as electricity prices are soaring across the state as well.

More than 900,000 power customers -- an estimated 2.5 million people -- were in the dark at the height of the latest planned blackout, nearly all of them in PG&E's territory in Northern and central California. By Monday evening a little less than half of those had their service back. But some 1.5 million people in 29 counties will be hit with more shut-offs starting Tuesday because another round of strong winds is expected, a reminder of grid stress during heat waves that test capacity, the utility said.

Southern California Edison had cut off power to 25,000 customers and warned that it was considering disconnecting about 350,000 more as power supply lapses and Santa Ana winds return midweek.

PG&E is under severe financial pressure after its equipment was blamed for a series of destructive wildfires and its 2018 Camp Fire guilty plea compounded liabilities during the past three years. Its stock dropped 24% Monday to close at $3.80 and was down more than 50% since Thursday.

The company reported last week that a transmission tower may have caused a Sonoma County fire that has forced 156,000 people to evacuate.

PG&E told the California Public Utilities Commission that a worker responded to a fire in Lafayette late Sunday afternoon and was told firefighters believed contact between a power line and a communication line may have caused it.

A worker went to another fire about an hour later and saw a fallen pole and transformer. Contra Costa Fire Department personnel on site told the worker they were looking at the transformer as a potential ignition source, a company official wrote.

Separately, the company told regulators that it had failed to notify 23,000 customers, including 500 with medical conditions, before shutting off their power earlier this month during windy weather.

Before a planned blackout, power companies are required to notify customers and take extra care to get in touch with those with medical problems who may not be able to handle extended periods without air conditioning or may need power to run medical devices.

PG&E said some customers had no contact information on file. Others were incorrectly thought to be getting electricity.

After that outage, workers discovered 43 cases of wind-related damage to power lines, transformers and other equipment.

Jennifer Robison, a PG&E spokeswoman, said the company is working with independent living centres to determine how best to serve people with disabilities.

The company faced a growing backlash from regulators and lawmakers, and a judge's order on wildfire risk spending added pressure as well.

U.S. Rep. Josh Harder, a Democrat from Modesto, said he plans to introduce legislation that would raise PG&E's taxes if it pays bonuses to executives while engaging in blackouts.

The Public Utilities Commission plans to open a formal investigation into the blackouts and the broader climate policy debate surrounding reliability within the next month, allowing regulators to gather evidence and question utility officials. If rules are found to be broken, they can impose fines up to $100,000 per violation per day, said Terrie Prosper, a spokeswoman for the commission.

The commission said Monday it also plans to review the rules governing blackouts, will look to prevent utilities from charging customers when the power is off and will convene experts to find grid improvements that might lessen blackouts during next year's fire season, as debates over rate stability in 2025 continue across PG&E's service area.

The state can't continue experiencing such widespread blackouts, "nor should Californians be subject to the poor execution that PG&E in particular has exhibited," Marybel Batjer, president of the California Public Utilities Commission, said in a statement.


Related News

View more

During this Pandemic, Save Money - How To Better Understand Your Electricity Bill

Commercial Electric Tariffs explain utility rate structures, peak demand charges, kWh vs kW pricing, time-of-use periods, voltage, delivery, capacity ratchets, and riders, guiding facility managers in tariff analysis for accurate energy savings.


Key Points

Commercial electric tariffs define utility pricing for energy, demand, delivery, time-of-use periods, riders, and ratchet charges.

✅ Separate kWh charges from kW peak demand fees.

✅ Verify time-of-use windows and demand interval length.

✅ Review riders, capacity ratchets, and minimum demand clauses.


Especially during these tough economic times, as major changes to electric bills are debated in some states, facility executives who don’t understand how their power is priced have been disappointed when their energy projects failed to produce expected dollar savings. Here’s how not to be one of them.

Your electric rate is spelled out in a document called a “tariff” that can be downloaded from your utility’s web page. A tariff should clearly spell out the costs for each component that is part of your rate, reflecting cost allocation practices in your region. Don’t be surprised to learn that it contains a bunch of them. Unlike residential electric rates, commercial electric bills are not based solely on the quantity of kilowatt-hours (kWh) consumed in a billing period (in the United States, that’s a month). Instead, different rates may apply to how your power is supplied, how it is delivered via electricity delivery charges, when it was consumed, its voltage, how fast it was used (in kW), and other factors.

If a tariff’s lingo and word structure are too opaque, spend some time with a utility account rep to translate it. Many state utility commissions also have customer advocates that may assist as they explore new utility rate designs that affect customers. Alternatively, for a fee, facility managers can privately chat with an energy consultant.

Common mistakes

Many facility managers try to estimate savings based on an averaged electric rate, i.e., annual electric spend divided by annual kWh. However, in markets where electricity demand is flat, such a number may obscure the fastest rising cost component: monthly peak demand charges, measured in dollars per kW (or kilo-volt-amperes, kVA).

This charge is like a monthly speeding ticket, based solely on the highest speed you drove during that time. In some areas, peak demand charges now account for 30 to 60 percent of a facility’s annual electric spend. When projecting energy cost savings, failing to separately account for kW peak demand and kWh consumption may result in erroneous results, and a lot of questions from the C-suite.

How peak demand charges are calculated varies among utilities. Some base it on the highest average speed of use across one hour in a month, while others may use the highest average speed during a 15- or 30-minute period. Others may average several of the highest speeds within a defined time period (for example, 8 a.m. to 6 p.m. on weekdays). It is whatever your tariff says it is.

Because some power-consuming (or producing) devices, including those tied to smart home electricity networks, vary in their operation or abilities, they may save money on a few — but not all — of those rate components. If an equipment vendor calculates savings from its product by using an average electric rate, take pause. Tell the vendor to return after the proposal has been redone using tariff-based numbers.

When a vendor is the only person calculating potential savings from using a product, there’s also a built-in conflict of interest: The person profiting from an equipment sale should not also be the one calculating its expected financial return. Before signing any energy project contracts, it’s essential that someone independent of the deal reviews projected savings. That person (typically an energy or engineering consultant) should be quite familiar with your facility’s electric tariff, including any special provisions, riders, discounts, etc., that may pertain. When this doesn’t happen, savings often don’t occur as planned. 

For example, some utilities add another form of demand charge, based on the highest kW in a year. It has various names: capacity, contract demand, or the generic term “ratchet charge.” Some utilities also have a minimum ratchet charge which may be based on a percent of a facility’s annual kW peak. It ensures collection of sufficient utility revenue to cover the cost of installed transmission and distribution even when a customer significantly cuts its peak demand.


Related News

View more

How Alberta’s lithium-laced oil fields can fuel the electric vehicle revolution

Alberta Lithium Brine can power EV batteries via direct lithium extraction, leveraging oilfield infrastructure and critical minerals policy to build a low-carbon supply chain with clean energy, lower emissions, and domestic manufacturing advantages.


Key Points

Alberta lithium brine is subsurface saline water rich in lithium, extracted via DLE to supply EV batteries.

✅ Uses direct lithium extraction from oilfield brines

✅ Leverages Alberta infrastructure and skilled workforce

✅ Supports EV battery supply chain with lower emissions


After a most difficult several months, Canadians are cautiously emerging from their COVID-19 isolation and confronting a struggling economy.
There’s a growing consensus that we need to build back better from COVID-19, and to position for the U.S. auto sector’s pivot to electric vehicles as supply chains evolve. Instead of shoring up the old economy as we did following the 2008 financial crisis, we need to make strategic investments today that will prepare Canada for tomorrow’s economy.

Tomorrow’s energy system will look very different from today’s — and that tomorrow is coming quickly. The assets of today’s energy economy can help build and launch the new industries required for a low-carbon future. And few opportunities are more intriguing than the growing lithium market.

The world needs lithium – and Alberta has plenty

It’s estimated that three billion tonnes of metals will be required to generate clean energy by 2050. One of those key metals – lithium, a light, highly conductive metal – is critical to the construction of battery electric vehicles (BEV). As global automobile manufacturers design hundreds of new BEVs, demand for lithium is expected to triple in the next five years alone, a trend sharpened by pandemic-related supply risks for automakers.

Most lithium today originates from either hard rock or salt flats in Australia and South America. Alberta’s oil fields hold abundant deposits of lithium in subsurface brine, but so far it’s been overlooked as industrial waste. With new processing technologies and growing concerns about the security of global supplies, this is set to change. In January, Canada and the U.S. finalized a Joint Action Plan on Critical Minerals to ensure supply security for critical minerals such as lithium and to promote supply chains closer to home, aligning with U.S. efforts to secure EV metals among allies worldwide.

This presents a major opportunity for Canada and Alberta. Lithium brine will be produced much like the oil that came before it. This lithium originates from many of the same reservoirs responsible for driving both Alberta’s economy and the broader transportation fuel sector for decades. The province now has extensive geological data and abundant infrastructure, including roads, power lines, rail and well sites. Most importantly, Alberta has a highly trained workforce. With very little retooling, the province could deliver significant volumes of newly strategic lithium.

Specialized technologies known as direct lithium extraction, or DLE, are being developed to unlock lithium-brine resources like those in Canada. In Alberta, E3 Metals* has formed a development partnership with U.S. lithium heavyweight Livent Corporation to advance and pilot its DLE technology. Prairie Lithium and LiEP Energy formed a joint venture to pilot lithium extraction in Saskatchewan. And Vancouver’s Standard Lithium is already piloting its own DLE process in southern Arkansas, where the geology is very similar to Alberta and Saskatchewan.

Heavy on quality, light on emissions

All lithium produced today has a carbon footprint, most of which can be tied back to energy-intensive processing. The purity of lithium is essential to battery safety and performance, but this comes at a cost when lithium is mined with trucks and shovels and then refined in coal-heavy China.

As automakers look to source more sustainable raw materials, battery recycling will complement responsible extraction, and Alberta’s experience with green technologies such as renewable electricity and carbon capture and storage can make it one of the world’s largest suppliers of zero-carbon lithium.

Beyond raw materials

The rewards would be considerable. E3 Metals’ Alberta project alone could generate annual revenues of US$1.8 billion by 2030, based on projected production and price forecasts. This would create thousands of direct jobs, as initiatives like a lithium-battery workforce initiative expand training, and many more indirectly.

To truly grow this industry, however, Canada needs to move beyond its comfort zone. Rather than produce lithium as yet another raw-commodity export, Canadians should be manufacturing end products, such as batteries, for the electrified economy, with recent EV assembly deals underscoring Canada’s momentum. With nickel and cobalt refining, graphite resources and abundant petrochemical infrastructure already in place, Canada must aim for a larger piece of the supply chain.

By 2030, the global battery market is expected to be worth $116 billion annually. The timing is right to invest in a strategic commodity and grow our manufacturing sector. This is why the Alberta-based Energy Futures Lab has called lithium one of the ‘Five big ideas for Alberta’s economic recovery.’  The assets of today’s energy economy can be used to help build and launch new resource industries like lithium, required for the low-carbon energy system of the future.

Industry needs support

To do this, however, governments will have to step up the way they did a generation ago. In 1975, the Alberta government kick-started oil-sands development by funding the Alberta Oil Sands Technology and Research Authority. AOSTRA developed a technology called SAGD (steam-assisted gravity drainage) that now accounts for 80% of Alberta’s in situ oil-sands production.

Canada’s lithium industry needs similar support. Despite the compelling long-term economics of lithium, some industry investors need help to balance the risks of pioneering such a new industry in Canada. The U.S. government has recognized a similar need, with the Department of Energy’s recent US$30 million earmarked for innovation in critical minerals processing and the California Energy Commission’s recent grants of US$7.8 million for geothermal-related lithium extraction.

To accelerate lithium development in Canada, this kind of leadership is needed. Government-assisted financing could help early-stage lithium-extraction technologies kick-start a whole new industry.

Aspiring lithium producers are also looking for government’s help to repurpose inactive oil and gas wells. The federal government has earmarked $1 billion for cleaning up inactive Alberta oil wells. Allocating a small percentage of that total for repurposing wells could help transform environmental liabilities into valuable clean-energy assets.

The North American lithium-battery supply chain will soon be looking for local sources of supply, and there is room for Canada-U.S. collaboration as companies turn to electric cars, strengthening regional resilience.


Related News

View more

UK low-carbon electricity generation stalls in 2019

UK low-carbon electricity 2019 saw stalled growth as renewables rose slightly, wind expanded, nuclear output fell, coal hit record lows, and net-zero targets demand faster deployment to cut CO2 intensity below 100gCO2/kWh.


Key Points

Low-carbon sources supplied 54% of UK power in 2019, up just 1TWh; wind grew, nuclear fell, and coal dropped to 2%.

✅ Wind up 8TWh; nuclear down 9TWh amid outages

✅ Fossil fuels 43% of generation; coal at 2%

✅ Net-zero needs 15TWh per year added to 2030


The amount of electricity generated by low-carbon sources in the UK stalled in 2019, Carbon Brief analysis shows.

Low-carbon electricity output from wind, solar, nuclear, hydro and biomass rose by just 1 terawatt hour (TWh, less than 1%) in 2019. It represents the smallest annual increase in a decade, where annual growth averaged 9TWh. This growth will need to double in the 2020s to meet UK climate targets while replacing old nuclear plants as they retire.

Some 54% of UK electricity generation in 2019 came from low-carbon sources, including 37% from renewables and 20% from wind alone, underscoring wind's leading role in the power mix during key periods. A record-low 43% was from fossil fuels, with 41% from gas and just 2% from coal, also a record low. In 2010, fossil fuels generated 75% of the total.

Carbon Brief’s analysis of UK electricity generation in 2019 is based on figures from BM Reports and the Department for Business, Energy and Industrial Strategy (BEIS). See the methodology at the end for more on how the analysis was conducted.

The numbers differ from those published earlier in January by National Grid, which were for electricity supplied in Great Britain only (England, Wales and Scotland, but excluding Northern Ireland), including via imports from other countries.

Low-carbon low
In 2019, the UK became the first major economy to target net-zero greenhouse gas emissions by 2050, increasing the ambition of its legally binding Climate Change Act.

To date, the country has cut its emissions by around two-fifths since 1990, with almost all of its recent progress coming from the electricity sector.

Emissions from electricity generation have fallen rapidly in the decade since 2010 as coal power has been almost phased out and even gas output has declined. Fossil fuels have been displaced by falling demand and by renewables, such as wind, solar and biomass.

But Carbon Brief’s annual analysis of UK electricity generation shows progress stalled in 2019, with the output from low-carbon sources barely increasing compared to a year earlier.

The chart below shows low-carbon generation in each year since 2010 (grey bars) and the estimated level in 2019 (red). The pale grey bars show the estimated future output of existing low-carbon sources after old nuclear plants retire and the pale red bars show the amount of new generation needed to keep electricity sector emissions to less than 100 grammes of CO2 per kilowatt hour (gCO2/kWh), the UK’s nominal target for the sector.

 Annual electricity generation in the UK by fuel, terawatt hours, 2010-2019. Top panel: fuel by fuel. Bottom panel: cumulative total generation from all sources. Source: BEIS energy trends, BM Reports and Carbon Brief analysis. Chart by Carbon Brief using Highcharts.
As the chart shows, the UK will require significantly more low-carbon electricity over the next decade as part of meeting its legally binding climate goals.

The nominal 100gCO2/kWh target for 2030 was set in the context of the UK’s less ambitious goal of cutting emissions to 80% below 1990 levels by 2050. Now that the country is aiming to cut emissions to net-zero by 2050, that 100gCO2/kWh indicator is likely to be the bare minimum.

Even so, it would require a rapid step up in the pace of low-carbon expansion, compared to the increases seen over the past decade. On average, low-carbon generation has risen by 9TWh each year in the decade since 2010 – including a rise of just 1TWh in 2019.

Given scheduled nuclear retirements and rising demand expected by the Committee on Climate Change (CCC) – with some electrification of transport and heating – low-carbon generation would need to increase by 15TWh each year until 2030, just to meet the benchmark of 100gCO2/kWh.

For context, the 3.2 gigawatt (GW) Hinkley C new nuclear plant being built in Somerset will generate around 25TWh once completed around 2026. The world’s largest offshore windfarm, the 1.2GW Hornsea One scheme off the Yorkshire coast, will generate around 5TWh each year.

The new Conservative government is targeting 40GW of offshore wind by 2030, up from today’s figure of around 8GW. If policies are put in place to meet this goal, then it could keep power sector emissions below 100gCO2/kWh, depending on the actual performance of the windfarms built.

However, new onshore wind and solar, further new nuclear or other low-carbon generation, such as gas with carbon capture and storage (CCS), is likely to be needed if demand is higher than expected, or if the 100gCO2/kWh benchmark is too weak in the context of net-zero by 2050.

The CCC says it is “likely” to “reflect the need for more rapid deployment” of low-carbon towards net-zero emissions in its advice on the sixth UK carbon budget for 2033-2037, due in September.

Trading places
Looking more closely at UK electricity generation in 2019, Carbon Brief’s analysis shows why there was so little growth for low-carbon sources compared to the previous year.

There was another increase for wind power in 2019 (up 8TWh, 14%), with record wind generation as several large new windfarms were completed including the 1.2GW Hornsea One project in October and the 0.6GW Beatrice offshore windfarm in Q2 of 2019. But this was offset by a decline for nuclear (down 9TWh, 14%), due to ongoing outages for reactors at Hunterston in Scotland and Dungeness in Kent.

(Analysis of data held by trade organisation RenewableUK suggests some 0.6GW of onshore wind capacity also started operating in 2019, including the 0.2GW Dorenell scheme in Moray, Scotland.)

As a result of these movements, the UK’s windfarms overtook nuclear for the first time ever in 2019, becoming the country’s second-largest source of electricity generation, and earlier, wind and solar together surpassed nuclear in the UK as momentum built. This is shown in the figure below, with wind (green line, top panel) trading places with nuclear (purple) and gas (dark blue) down around 25% since 2010 but remaining the single-largest source.

 Annual electricity generation in the UK by fuel, terawatt hours, 2010-2019. Top panel: fuel by fuel. Bottom panel: cumulative total generation from all sources. Source: BEIS energy trends, BM Reports and Carbon Brief analysis. Chart by Carbon Brief using Highcharts.
The UK’s currently suspended nuclear plants are due to return to service in January and March, according to operator EDF, the French state-backed utility firm. However, as noted above, most of the UK’s nuclear fleet is set to retire during the 2020s, with only Sizewell B in Suffolk due to still be operating by 2030. Hunterston is scheduled to retire by 2023 and Dungeness by 2028.

Set against these losses, the UK has a pipeline of offshore windfarms, secured via “contracts for difference” with the government, at a series of auctions. The most recent auction, in September 2019, saw prices below £40 per megawatt hour – similar to current wholesale electricity prices.

However, the capacity contracted so far is not sufficient to meet the government’s target of 40GW by 2030, meaning further auctions – or some other policy mechanism – will be required.

Coal zero
As well as the switch between wind and nuclear, 2019 also saw coal fall below solar for the first time across a full year, echoing the 2016 moment when wind outgenerated coal across the UK, after it suffered another 60% reduction in electricity output. Just six coal plants remain in the UK, with Aberthaw B in Wales and Fiddlers Ferry in Cheshire closing in March.

Coal accounted for just 2% of UK generation in 2019, a record-low coal share since centralised electricity supplies started to operate in 1882. The fuel met 40% of UK needs as recently as 2012, but has plummeted thanks to falling demand, rising renewables, cheaper gas and higher CO2 prices.

The reduction in average coal generation hides the fact that the fuel is now often not required at all to meet the UK’s electricity needs. The chart below shows the number of days each year when coal output was zero in 2019 (red line) and the two previous years (blue).

 Cumulative number of days when UK electricity generation from renewable sources has been higher than that from fossil fuels. Source: BEIS energy trends, BM Reports and Carbon Brief analysis. Chart by Carbon Brief using Highcharts.
The 83 days in 2019 with zero coal generation amount to nearly a quarter of the year and include the record-breaking 18-day stretch without the fuel.

Great Britain has been running for a record TWO WEEKS without using coal to generate electricity – the first time this has happened since 1882.

The country’s grid has been coal-free for 45% of hours in 2019 so far.https://www.carbonbrief.org/countdown-to-2025-tracking-the-uk-coal-phase-out …

Coal generation was set for significant reductions around the world in 2019 – including a 20% reduction for the EU as a whole – according to analysis published by Carbon Brief in November.

Notably, overall UK electricity generation fell by another 9TWh in 2019 (3%), bringing the total decline to 58TWh since 2010. This is equivalent to more than twice the output from the Hinkley C scheme being built in Somerset. As Carbon Brief explained last year, falling demand has had a similar impact on electricity-sector CO2 emissions as the increase in output from renewables.

This is illustrated by the fact that the 9TWh reduction in overall generation translated into a 9TWh (6%) cut in fossil-fuel generation during 2019, with coal falling by 10TWh and gas rising marginally.

Increasingly renewable
As fossil-fuel output and overall generation have declined, the UK’s renewable sources of electricity have continued to increase. Their output has risen nearly five-fold in the past decade and their share of the UK total has increased from 7% in 2010 to 37% in 2019.

As a result, the UK’s increasingly renewable grid is seeing more minutes, hours and days during which the likes of wind, solar and biomass collectively outpace all fossil fuels put together, and on some days wind is the main source as well.

The chart below shows the number of days during each year when renewables generated more electricity than fossil fuels in 2019 (red line) and each of the previous four years (blue lines). In total, nearly two-fifths of days in 2019 crossed this threshold.

 Cumulative number of days when the UK has not generated any electricity from coal. Source: BEIS energy trends, BM Reports and Carbon Brief analysis. Chart by Carbon Brief using Highcharts.
There were also four months in 2019 when renewables generated more of the UK’s electricity than fossil fuels: March, August, September and December. The first ever such month came in September 2018 and more are certain to follow.

National Grid, which manages Great Britain’s high-voltage electricity transmission network, is aiming to be able to run the system without fossil fuels by 2025, at least for short periods. At present, it sometimes has to ask windfarm operators to switch off and gas plants to start running in order to keep the electricity grid stable.

Note that biomass accounted for 11% of UK electricity generation in 2019, nearly a third of the total from all renewables. Some two-thirds of the biomass output is from “plant biomass”, primarily wood pellets burnt at Lynemouth in Northumberland and the Drax plant in Yorkshire. The remainder was from an array of smaller sites based on landfill gas, sewage gas or anaerobic digestion.

The CCC says the UK should “move away” from large-scale biomass power plants, once existing subsidy contracts for Drax and Lynemouth expire in 2027.

Using biomass to generate electricity is not zero-carbon and in some circumstances could lead to higher emissions than from fossil fuels. Moreover, there are more valuable uses for the world’s limited supply of biomass feedstock, the CCC says, including carbon sequestration and hard-to-abate sectors with few alternatives.

Methodology
The figures in the article are from Carbon Brief analysis of data from BEIS Energy Trends chapter 5 and chapter 6, as well as from BM Reports. The figures from BM Reports are for electricity supplied to the grid in Great Britain only and are adjusted to include Northern Ireland.

In Carbon Brief’s analysis, the BM Reports numbers are also adjusted to account for electricity used by power plants on site and for generation by plants not connected to the high-voltage national grid. This includes many onshore windfarms, as well as industrial gas combined heat and power plants and those burning landfill gas, waste or sewage gas.

By design, the Carbon Brief analysis is intended to align as closely as possible to the official government figures on electricity generated in the UK, reported in BEIS Energy Trends table 5.1.

Briefly, the raw data for each fuel is in most cases adjusted with a multiplier, derived from the ratio between the reported BEIS numbers and unadjusted figures for previous quarters.

Carbon Brief’s method of analysis has been verified against published BEIS figures using “hindcasting”. This shows the estimates for total electricity generation from fossil fuels or renewables to have been within ±3% of the BEIS number in each quarter since Q4 2017. (Data before then is not sufficient to carry out the Carbon Brief analysis.)

For example, in the second quarter of 2019, a Carbon Brief hindcast estimates gas generation at 33.1TWh, whereas the published BEIS figure was 34.0TWh. Similarly, it produces an estimate of 27.4TWh for renewables, against a BEIS figure of 27.1TWh.

National Grid recently shared its own analysis for electricity in Great Britain during 2019 via its energy dashboard, which differs from Carbon Brief’s figures.


Related News

View more

Sign Up for Electricity Forum’s Newsletter

Stay informed with our FREE Newsletter — get the latest news, breakthrough technologies, and expert insights, delivered straight to your inbox.

Electricity Today T&D Magazine Subscribe for FREE

Stay informed with the latest T&D policies and technologies.
  • Timely insights from industry experts
  • Practical solutions T&D engineers
  • Free access to every issue

Download the 2025 Electrical Training Catalog

Explore 50+ live, expert-led electrical training courses –

  • Interactive
  • Flexible
  • CEU-cerified