SCE races to repair wildfires' damage

By Knight Ridder Tribune


Arc Flash Training CSA Z462 - Electrical Safety Essentials

Our customized live online or in‑person group training can be delivered to your staff at your location.

  • Live Online
  • 6 hours Instructor-led
  • Group Training Available
Regular Price:
$249
Coupon Price:
$199
Reserve Your Seat Today
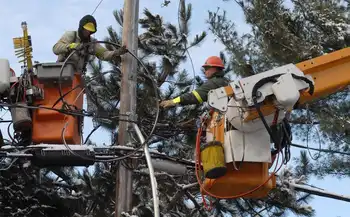
Southern California Edison crews were scrambling to restore power to customers as high winds and a slew of wildfires roared through the Southland.

About 11,946 customers were left without power. The hardest hit communities were Rialto, Fontana, San Bernardino, Rancho Cucamonga, Mira Loma, Hesperia, Corona, Bloomington, Calimesa and Rubidoux, Edison officials said.

"Cumulatively, 333,423 customers have had their power interrupted for some length of time based on outages that the wind and fires have created with Edison equipment," said Paul Klein, a spokesman for the Rosemead-based utility.

That number had risen to 350,600, and 18,200 customers were without power, according to an Edison update. Klein said some SCE crews were awaiting the OK from fire officials to enter areas affected to assess the damage to SCE's system and to determine when service restoration could begin.

"Edison has the ability to route power around the problem to a certain degree as outages occur, so some customers can get their power back on pretty quickly," he said. An early tally showed few customers suffering outages in some communities, including Monrovia (five), Duarte (five), Whittier (five), Covina (10) and Glendora (10). But later figures revealed significant outages, including San Jacinto (2,400 customers) Fontana (1,465), Ventura (1,350) and Oxnard (1,030), according to Edison. Klein said strong winds can knock down power poles or blow adjacent power lines together, which causes a short circuit, shutting down the power.

But SCE workers were poised for action when the wind and fires kicked up, he said. "The crews are always always ready to go in a situation like this, and they are dispatched to the areas where the most damage has occurred," Klein said. "We work hard to get the power back on as soon as possible."

Inspector Sam Padilla of the Los Angeles County Fire Department said the high winds have made fire containment difficult at best. "We're seeing wind gusts of 45 to 80 mph out in Malibu and near Saugus," he said. "That helps the fire spread a lot faster."

Even by the next day, Padilla said many of the larger fires were only marginally under control.

"We've got 20 percent containment for the Agua Dulce fire and the Malibu fire is only 10 percent contained," he said. "It really depends on how rough the terrain is. In some cases we have to go in and cut fire lines with a bulldozer or with fire crews."

SCE is urging residents to use caution when dealing with outages and damage created by the wind and fires.

The following tips are offered:

- Never try to touch or move a downed power line.

- Use flashlights instead of candles during power outages.

- Watch for traffic signals that may be out.

- During an outage, turn off unattended electrical appliances and devices to avoid possible hazards when service is restored.

"This is a big windstorm, and with the low humidity conditions it's a serious situation," Klein said. "Edison is committing all of its resources to getting the power back on as soon as possible."

An Edison International company, Southern California Edison is the largest electric utility in California, serving a population of more than 13 million via 4.8 million customer accounts in a 50,000-square-mile service area within central, coastal and Southern California.

Related News

Solar + Wind = 10% of US Electricity Generation in 1st Half of 2018

US Electricity Generation H1 2018 saw wind and solar gains but hydro declines, as natural gas led the grid mix and coal fell; renewables' share, GWh, emissions, and capacity additions shaped the power sector.


Key Points

It is the H1 2018 US power mix, where natural gas led, coal declined, and wind and solar grew while hydro fell.

✅ Natural gas reached 32% of generation, highest share

✅ Coal fell; renewables roughly tied nuclear at ~20%

✅ Wind and solar up; hydro output down vs 2017


To complement our revival of US electricity capacity reports, here’s a revival of our reports on US electricity generation.

As with the fresh new capacity report, things are not looking too bright when it comes to electricity generation. There’s still a lot of grey — in the bar charts below, in the skies near fossil fuel power plants, and in the human and planetary outlook based on how slowly we are cutting fossil fuel electricity generation.

As you can see in the charts above, wind and solar energy generation increased notably from the first half of 2017 to the first half of 2018, and the EIA expected larger summer solar and wind generation in subsequent months, reinforcing that momentum.

A large positive when it comes to the environment and human health is that coal generation dropped a great deal year over year — by even more than renewables increased, though the EIA later noted an increase in coal-fired generation in a subsequent year, complicating the trend. However, on the down side, natural gas soared as it became the #1 source of electricity generation in the United States (32% of US electricity). Furthermore, coal was still solidly in the #2 position (27% of US electricity). Renewables and nuclear were essentially in a tie at 19.8% of generation, with renewables just a tad above nuclear.

Actually, combined with an increase in nuclear power generation, natural gas electricity production increased so much that the renewable energy share of electricity generation actually dropped in the first half of 2018 versus the first half of 2017, even amid declining electricity use in some periods. It was 19.8% this year and 20% last year.

Again, solar and wind saw a significant growth in its market share, from 9% to 9.9%, but hydro brought the whole category down due to a decrease from 9% to 8%.

The visuals above are probably the best way to examine it all. The H1 2018 chart was still dominated by fossil fuels, which together accounted for approximately 60% of electricity generation, even though by 2021 non-fossil sources supplied about 40% of U.S. electricity, highlighting the longer-term shift. In H1 2017, the figure was 59.7%. Furthermore, if you switch to the “Change H1 2018 vs H1 2017 (GWh)” chart, you can watch a giant grey bar representing natural gas take over the top of the chart. It almost looks like it’s part of the border of the chart. The biggest glimmer of positivity in that chart is seeing the decline in coal at the bottom.

What will the second half of the year bring? Well, the gigantic US electricity generation market shifts slowly, even as monthly figures can swing, as January generation jumped 9.3% year over year according to the EIA, reminding us about volatility. There is so much base capacity, and power plants last so long, that it takes a special kind of magic to create a rapid transition to renewable energy. As you know from reading this quarter’s US renewable energy capacity report, only 43% of new US power capacity in the first half of the year was from renewables. The majority of it was from natural gas. Along with other portions of the calculation, that means that electricity generation from natural gas is likely to increase more than electricity generation from renewables.

Jump into the numbers below and let us know if you have any more thoughts.


Related News

View more

Here are 3 ways to find out where your electricity comes from

US energy mix shows how the electric grid blends renewables, fossil fuels, nuclear, and hydro, varying by ISO/RTO markets, utilities, and state policies, affecting carbon emissions, pricing, reliability, and access.


Key Points

The US energy mix is the grid's source breakdown by region: fossil fuels, renewables, nuclear, and hydro.

✅ Check ISO or RTO dashboards for real-time generation by fuel source.

✅ Utilities may offer green power plans or RECs at modest premiums.

✅ Energy mix shifts with policy, pricing, and grid reliability needs.


There are few resources more important than energy. Sure, you may die if you don't eat for days. But your phone will die if you go too long without charging it. Energy feeds tech, the internet, city infrastructure, refrigerators, lights, and has evolved throughout U.S. history in profound ways. You get the idea. Yet unlike our other common needs, such as food, energy sources aren't exactly front of mind for most people. 

"I think a lot of people don't put a lot of bandwidth into thinking about this part of their lives," said Richard McMahon, the SVP of energy supply and finance at Edison Electric Institute, a trade group that represents investor-owned electric companies in the US. 

It makes sense. For most Americans, electricity is always there, and in many locations, there's not much of a choice involved, even as electricity demand is flat across the U.S. today. You sign up with a utility when you move into a new residence and pay your bills when they're due. 

But there's an important reality that indifference eschews: In 2018, a third of the energy-related carbon-dioxide emissions in the US came from the electric power sector, according to the US Energy Information Administration (EIA). 

A good chunk of that is from the residential sector, which consistently uses more energy than commercial customers, per EIA data.

Just as many people exercise choice when they eat, you typically also have a choice when it comes to your energy supply. That's not to say your current offering isn't what you want, or that switching will be easy or affordable, but "if you're a customer and want power with a certain attribute," McMahon said, "you can pretty much get it wherever you are." 

But first, you need to know the energy mix you have right now. As it turns out, it's not so straightforward. At all.

This brief guide may help. 

For some utility providers, you can find out if it publishes the energy mix online. Dominion Energy, which serves Idaho, North Carolina, Ohio, South Carolina, Utah, Virginia, West Virginia, and Wyoming, provides this information in a colored graphic. 

"Once you figure out who your utility is you can figure out what mix of resources they use," said Heidi Ratz, an electricity markets researcher at the World Resources Institute.

But not all utilities publish this information.

It has to do with their role in the grid and reflects utility industry trends in structure and markets. Some utility companies are vertically integrated; they generate power through nuclear plants or wind farms and distribute those electrons directly to their customers. Other utilities just distribute the power that different companies produce. 

Consider Consolidated Edison, or Con Ed, which distributes energy to parts of New York City. While reporting this story, Business Insider could not find information about the utility's energy mix online. When reached for comment, a spokesperson said, "we're indifferent to where it comes from."

That's because, in New York, distribution utilities like Con Ed often buy energy through a wholesale marketplace.

Take a look at this map. If you live in one of the colored regions, your electricity is sold on a wholesale market regulated by an organization called a regional transmission organization (RTO) or independent system operator (ISO). Distribution utilities like Con Ed often buy their energy through these markets, based on availability and cost, while raising questions about future utility revenue models as prices shift. 

Still, it's pretty easy to figure out where your energy comes from. Just look up the ISO or RTO website (such as NYISO or CAISO). Usually, these organizations will provide energy supply information in near-real time. 

That's exactly what Con Edison (which buys energy on the NYISO marketplace) suggested. As of Friday morning, roughly 40% of the energy on the market place was natural gas or other fossil fuels, 34% was nuclear, and about 22% was hydro. 

If you live in another region governed by an ISO or RTO, such as in most of California, you can do the same thing. Like NYISO, CAISO has a dashboard that shows (again, as of Friday morning) about 36% of the energy on the market comes from natural gas and more than 20% comes from renewables. 

In the map linked above, you'll notice that some of the ISOs and RTOs like MISO encompass enormous regions. That means that even if you figure out where the energy in your market comes from, it's not going to be geographically specific. But there are a couple of ways to drill down even further. 

The Environmental Protection Agency has a straightforward tool called Power Profiler. You can enter your zip code to see the fuel mix in your area. But it's not perfect. The data are from 2016 and, in some regions of the country like the upper Midwest, they aren't much more localized, and some import dirty electricity due to regional trading. 

The World Resources Institute also has a tool that allows you to see the electricity mix by state, based on 2017 data from EIA. These numbers represent power generation, not the electricity actually flowing into your sockets, but they offer a rough idea of what energy resources are operating in your state. 

One option is to check with your utility to see if it has a "green power" offering. Over 600 utilities across the country have one, according to the Climate Reality Project, though they often come at a slightly higher cost. It's typically on the scale of just a few more cents per kilowatt-hour. 

There are also independent, consumer-facing companies like Arcadia and Green Mountain Energy that allow you to source renewable energy, by virtually connecting you to community solar projects or purchasing Renewable Energy Certificates, or RECs, on your behalf, as America goes electric and more options emerge. 

"RECs measure an investment in a clean energy resource," Ratz said, in an email. "The goal of putting that resource on the grid is to push out the need for dirtier resources."

The good news: Even if you do nothing, your energy mix will get cleaner. Coal production has fallen to lows not seen since the 1980s, amid disruptions in coal and nuclear sectors that affect reliability and costs, while renewable electricity generation has doubled since 2008. So whether you like it or not, you'll be roped into the clean energy boom one way or another. 


Related News

View more

There's a Russia-Sized Mystery in China's Electricity Sector

China Power Demand-Emissions Gap highlights surging grid demand outpacing renewables, with coal filling shortages despite record solar, wind, EV charging, and hydrogen growth, threatening decarbonization targets and net-zero pathways through 2030.


Key Points

China's power demand outpaces renewables, keeping coal dominant and raising emissions risk through the 2020s.

✅ Record solar and wind still lag fast grid demand growth

✅ Coal fills gaps as EV charging and hydrogen loads rise

✅ Forecasts diverge: CEC bullish vs IEA, BNEF conservative


Here’s a new obstacle that could prevent the world finally turning the corner on climate change: Imagine that over the coming decade a whole new economy the size of Russia were to pop up out of nowhere. With the world’s fourth-largest electricity sector and largest burden of power plant emissions after China, the U.S. and India, this new economy on its own would be enough to throw out efforts to halt global warming — especially if it keeps on growing through the 2030s.

That’s the risk inherent in China’s seemingly insatiable appetite for grid power, as surging electricity demand is putting systems under strain worldwide.

From the cracking pace of renewable build-out last year, you might think the country had broken the back of its carbon addiction. A record 55 gigawatts of solar power and 48 gigawatts of wind were connected — comparable to installing the generation capacity of Mexico in less than 12 months. This year will see an even faster pace, with 93 GW of solar and 50 GW of wind added, according to a report last week from the China Electricity Council, an industry association.

That progress could in theory see the country’s power sector emissions peak within months, rather than the late-2020s date the government has hinted at. Combined with a smaller quantity of hydro and nuclear, low-emissions sources will probably add about 310 terawatt-hours to zero-carbon generation this year. That 3.8% increase would be sufficient to power the U.K.

Countries that have reached China’s levels of per-capita electricity consumption (already on a par with most of Europe) typically see growth rates at less than half that level, even as global power demand has surged past pre-pandemic levels in recent years. Grid supply could grow at a faster pace than Brazil, Iran, South Korea or Thailand managed over the past decade without adding a ton of additional carbon to the atmosphere.

There’s a problem with that picture, however. If electricity demand grows at an even more headlong pace, there simply won’t be enough renewables to supply the grid. Fossil fuels, overwhelmingly coal, will fill the gap, a reminder of the iron law of climate dynamics in energy transitions.

Such an outcome looks distinctly possible. Electricity consumption in 2021 grew at an extraordinary rate of 10%, and will increase again by between 5% and 6% this year, according to the CEC. That suggests the country is on pace to match the CEC’s forecasts of bullish grid demand over the coming decade, with generation hitting 11,300 terawatt-hours in 2030. External analysts, such as the International Energy Agency and BloombergNEF, envisage a more modest growth to around 10,000 TWh. 

The difference between those two outlooks is vast — equivalent to all the electricity produced by Russia or Japan. If the CEC is right and the IEA and BloombergNEF are wrong, even the furious rate of renewable installations we’re seeing now won’t be enough to rein in China’s power-sector emissions.

Who’s correct? On one hand, it’s fair to say that power planners usually err on the side of overestimation. If your forecast for electricity demand is too high, state-owned generators will be less profitable than they otherwise would have been — but if it’s too low, you’ll see power cuts and shutdowns like China witnessed last autumn, with resulting power woes affecting supply chains beyond its borders.

On the other hand, the decarbonization of China’s economy itself should drive electricity demand well above what we’ve seen in the past, with some projections such as electricity meeting 60% of energy use by 2060 pointing to a profound shift. Some 3.3 million electric vehicles were sold in 2021 and BloombergNEF estimates a further 5.7 million will be bought in 2022. Every million EVs will likely add in the region of 2 TWh of load to the grid. Those sums quickly mounts up in a country where electric drivetrains are taking over a market that shifts more than 25 million new cars a year.

Decarbonizing industry, a key element on China’s road to zero emissions, could also change the picture. The IEA sees the country building 25 GW of electolysers to produce hydrogen by 2030, enough to consume some 200 TWh on their own if run close to full-time.

That’s still not enough to justify the scale of demand being forecast, though. China is already one of the least efficient countries in the world when it comes to translating energy into economic growth, and despite official pressure on the most wasteful, so called “dual-high” industries such as steel, oil refining, glass and cement, its targets for more thrifty energy usage remain pedestrian.

The countries that have decarbonized fastest are those, such as Germany, the U.K and the U.S., where Americans are using less electricity, that have seen power demand plateau or even decline, giving new renewable power a chance to swap out fossil-fired generators without chasing an ever-increasing burden on the grid. China’s inability to do this as its population peaks and energy consumption hits developed-country levels isn’t a sign of strength.

Instead, it’s a sign of a country that’s chronically unable to make the transition away from polluting heavy industry and toward the common prosperity and ecological civilization that its president keeps promising. Until China reins in that credit-fueled development model, the risks to its economy and the global climate will only increase.


Related News

View more

As peak wildfire season nears, SDG&E completes work on microgrid in Ramona

SDG&E Ramona Microgrid delivers renewable energy and battery storage for wildfire mitigation, grid resilience, and PSPS support, powering the Cal Fire Air Attack Base with a 500 kW, 2,000 kWh lithium-ion system during outages.


Key Points

A renewable, battery-backed microgrid powering Ramona's Air Attack Base, boosting wildfire response and PSPS resilience.

✅ 500 kW, 2,000 kWh lithium-ion storage replaces diesel

✅ Keeps Cal Fire and USFS aircraft operations powered

✅ Supports PSPS continuity and rural water reliability


It figures to be another dry year — with the potential to spark wildfires in the region. But San Diego Gas & Electric just completed a renewable energy upgrade to a microgrid in Ramona that will help firefighters and reduce the effects of power shutoffs to backcountry residents.

The microgrid will provide backup power to the Ramona Air Attack Base, helping keep the lights on during outages, home to Cal Fire and the U.S. Forest Service's fleet of aircrafts that can quickly douse fires before they get out of hand.

"It gives us peace of mind to have backup power for a critical facility like the Ramona Air Attack Base, especially given the fact that fire season in California has become year-round," Cal Fire/San Diego County Fire Chief Tony Mecham said in a statement.

The air attack base serves as a hub for fixed-wing aircraft assigned to put out fires. Cal Fire staffs the base throughout the year with one two airtankers and one tactical aircraft. The base also houses the Forest Service's Bell 205 A++ helicopter and crew to protect the Cleveland National Forest. Aircraft for both CalFire and the Forest Service can also be mobilized to help fight fires throughout the state.

This summer, the Ramona microgrid won't have to rely on diesel generation. Instead, the facility next to the town's airport will be powered by a 500 kilowatt and 2,000 kilowatt-hour lithium-ion battery storage system that won't generate any greenhouse gas emissions.

"What's great about it, besides that it's a renewable resource, is that it's a permanent installation," said Jonathan Woldemariam, SDG&E's director of wildfire mitigation and vegetation management. "In other words, we don't have to roll a portable generator out there. It's something that can be leveraged right there because it's already installed and ready to go."

Microgrids have taken on a larger profile across the state because they can operate independently of the larger electric grid, where repairing California's grid is an ongoing challenge, thus allowing small areas or communities to keep the power flowing for hours at a time during emergencies.

That can be crucial in wildfire-prone areas affected by Public Safety Power Shutoffs, or PSPS, the practice in which investor-owned utilities in California de-energize electrical power lines in a defined area when conditions are dry and windy in order to reduce the risk of a power line falling and igniting a wildfire, while power grid upgrades move forward statewide.

Rural and backcountry communities are particularly hard hit when the power is pre-emptively cut off because many homes rely on water from wells powered by electricity for their homes, horses and livestock.

In addition to Ramona, SDG&E has established microgrids in three other areas in High Fire Threat Districts:

The microgrids in Butterfield Ranch and Shelter Valley run on diesel power but the utility plans to complete solar and battery storage systems for each locale by the end of next year, as other regions develop new microgrid rules to guide deployment.

SDG&E has a fifth microgrid in operation — in Borrego Springs, which in 2013 became the first utility-scale microgrid in the country. It provides grid resiliency to the roughly 2,700 residents of the desert town and serves as a model for integrated microgrid projects elsewhere in delivering local electricity. While the Borrego Springs microgrid is not located in a High Fire Threat District, "when and if any power is turned off, especially the power transmission feed that goes to Borrego, we can support the customers using the microgrid out there," Woldemariam said.

Microgrid costs can be higher than conventional energy systems, even as projected energy storage revenue grows over the next decade, and the costs of the SDG&E projects are passed on to ratepayers. As per California Public Utilities Commission rules, the financial details for each of microgrid are kept confidential for at least three years.

SDG&E's microgrids are part of the utility's larger plan to reduce wildfire risk that SDG&E files with the utilities commission. In its wildfire plan for 2020 through 2022, SDG&E expected to spend $1.89 billion on mitigation measures.


Related News

View more

Oil crash only a foretaste of what awaits energy industry

Oil and Gas Profitability Decline reflects shale-driven oversupply, OPEC-Russia dynamics, LNG exports, renewables growth, and weak demand, signaling compressed margins for producers, stressed petrodollar budgets, and shifting energy markets post-Covid.


Key Points

A sustained squeeze on hydrocarbon margins from agile shale supply, weaker OPEC leverage, and expanding renewables.

✅ Shale responsiveness caps prices and erodes industry rents

✅ OPEC-Russia cuts face limited impact versus US supply

✅ Renewables and EVs slow long-term oil and gas demand


The oil-price crash of March 2020 will probably not last long. As in 2014, when the oil price dropped below $50 from $110 in a few weeks, this one will trigger a temporary collapse of the US shale industry. Unless the coronavirus outbreak causes Armageddon, cheap oil will also support policymakers’ efforts to help the global economy.

But there will be at least one important and lasting difference this time round — and it has major market and geopolitical implications.

The oil price crash is a foretaste of where the whole energy sector was going anyway — and that is down.

It may not look that way at first. Saudi Arabia will soon realise, as it did in 2015, that its lethal decision to pump more oil is not only killing US shale but its public finances as well. Riyadh will soon knock on Moscow’s door again. Once American shale supplies collapse, Russia will resume co-operation with Saudi Arabia.

With the world economy recovering from the Covid-19 crisis by then, and with electricity demand during COVID-19 shifting, moderate supply cuts by both countries will accelerate oil market recovery. In time, US shale producers will return too.

Yet this inevitable bounceback should not distract from two fundamental factors that were already remaking oil and gas markets. First, the shale revolution has fundamentally eroded industry profitability. Second, the renewables’ revolution will continue to depress growth in demand.

The combined result has put the profitability of the entire global hydrocarbon industry under pressure. That means fewer petrodollars to support oil-producing countries’ national budgets, including Canada's oil sector exposures. It also means less profitable oil companies, which traditionally make up a large segment of stock markets, an important component of so many western pension funds.

Start with the first factor to see why this is so. Historically, the geological advantages that made oil from countries such as Saudi Arabia so cheap to produce were unique. Because oil and gas were produced at costs far below the market price, the excess profits, or “rent”, enjoyed by the industry were very large.

Furthermore, collusion among low-cost producers has been a winning strategy. The loss of market share through output cuts was more than compensated by immediately higher prices. It was the raison d’être of Opec.

The US shale revolution changed all this, exposing the limits of U.S. energy dominance narratives. A large oil-producing region emerged with a remarkable ability to respond quickly to price changes and shrink its costs over time. Cutting back cheap Opec oil now only increases US supplies, with little effect on world prices.

That is why Russia refused to cut production this month. Even if its cuts did boost world prices — doubtful given the coronavirus outbreak’s huge shock to demand — that would slow the shrinkage of US shale that Moscow wants.

Shale has affected the natural gas industry even more. Exports of US liquefied natural gas now put an effective ceiling on global prices, and debates over a clean electricity push have intensified when gas prices spike.

On top of all this, there is also the renewables’ revolution, though a green revolution has not been guaranteed in the near term. Around the world, wind and solar have become ever-cheaper options to generate electricity. Storage costs have also dropped and network management improved. Even in the US, renewables are displacing coal and gas. Electrification of vehicle fleets will damp demand further, as U.S. electricity, gas, and EVs face evolving pressures.

Eliminating fossil fuel consumption completely would require sustained and costly government intervention, and reliability challenges such as coal and nuclear disruptions add to the complexity. That is far from certain. Meanwhile, though, market forces are depressing the sector’s usual profitability.

The end of oil and gas is not immediately around the corner. Still, the end of hydrocarbons as a lucrative industry is a distinct possibility. We are seeing that in dramatic form in the current oil price crash. But this collapse is merely a message from the future.


Related News

View more

Independent power project announced by B.C. Hydro now in limbo

Siwash Creek Hydroelectric Project faces downsizing under a BC Hydro power purchase agreement, with run-of-river generation, high grid interconnection costs, First Nations partnership, and surplus electricity from Site C reshaping clean energy procurement.


Key Points

A downsized run-of-river plant in BC, co-owned by Kanaka Bar and Green Valley, selling power via a BC Hydro PPA.

✅ Approved at 500 kW under a BC Hydro clean-energy program

✅ Grid interconnection initially quoted at $2.1M

✅ Joint venture: Kanaka Bar and Green Valley Power


A small run-of-river hydroelectric project recently selected by B.C. Hydro for a power purchase agreement may no longer be financially viable.

The Siwash Creek project was originally conceived as a two-megawatt power plant by the original proponent Chad Peterson, who holds a 50-per-cent stake through Green Valley Power, with the Kanaka Bar Indian Band holding the other half.

The partners were asked by B.C. Hydro to trim the capacity back to one megawatt, but by the time the Crown corporation announced its approval, it agreed to only half that — 500 kilowatts — under its Standing Order clean-energy program.

“Hydro wanted to charge us $2.1 million to connect to the grid, but then they said they could reduce it if we took a little trim on the project,” said Kanaka Bar Chief Patrick Michell.

The revenue stream for the band and Green Valley Power has been halved to about $250,000 a year. The original cost of running the $3.7-million plant, including financing, was projected to be $273,000 a year, according to the Kanaka Bar economic development plan.

“By our initial forecast, we will have to subsidize the loan for 20 years,” said Michell. “It doesn’t make any sense.”

The Kanaka Band has already invested $450,000 in feasibility, hydrology and engineering studies, with a similar investment from Green Valley.

B.C. Hydro announced it would pursue five purchase agreements last March with five First Nations projects — including Siwash Creek — including hydro, solar and wind energy projects, as two new generating stations were being commissioned at the time. A purchase agreement allows proponents to sell electricity to B.C. Hydro at a set price.

However, at least ten other “shovel-ready” clean energy projects may be doomed while B.C. Hydro completes a review of its own operations and its place in the energy sector, where legal outcomes like the Squamish power project ruling add uncertainty, including B.C.’s future power needs.

With the 1,100-megawatt Site C Dam planned for completion in 2024, and LNG demand cited to justify it, B.C. Hydro now projects it will have a surplus of electricity until the early 2030s.

Even if British Columbians put 300,000 electric vehicles on the road over the next 12 years, amid BC Hydro’s first call for power, they will require only 300 megawatts of new capacity, the company said.

A long-term surplus could effectively halt all small-scale clean energy development, according to Clean Energy B.C., even as Hydro One’s U.S. coal plant remains online in the region.

“(B.C. Hydro) dropped their offer down to 500 kilowatts right around the time they announced their review,” said Michell. “So we filled out the paperwork at 500 kilowatts and (B.C. Hydro) got to make its announcement of five projects.”

In the new few weeks, Kanaka and Green Valley will discuss whether they can move forward with a new financial model or shelve the project, he said.

B.C. Hydro declined to comment on the rationale for downsizing Siwash Creek’s power purchase agreement.

The Kanaka Bar Band successfully operates a 49.9-megawatt run-of-river plant on Kwoiek Creek with partners Innergex Renewable Energy.


Related News

View more

Sign Up for Electricity Forum’s Newsletter

Stay informed with our FREE Newsletter — get the latest news, breakthrough technologies, and expert insights, delivered straight to your inbox.

Electricity Today T&D Magazine Subscribe for FREE

Stay informed with the latest T&D policies and technologies.
  • Timely insights from industry experts
  • Practical solutions T&D engineers
  • Free access to every issue

Download the 2025 Electrical Training Catalog

Explore 50+ live, expert-led electrical training courses –

  • Interactive
  • Flexible
  • CEU-cerified