Power struggle: wind versus sun hotly debated

By Arkansas Democrat-Gazette


Substation Relay Protection Training

Our customized live online or in‑person group training can be delivered to your staff at your location.

  • Live Online
  • 12 hours Instructor-led
  • Group Training Available
Regular Price:
$699
Coupon Price:
$599
Reserve Your Seat Today
In the old Aesop fable, wind and sun battle over which is the stronger. The wind blows hard, but the sun shines hot. They both do their best to get a traveler to remove his jacket.

In the fable, sun wins. But in real-life policy questions over solar power and wind energy — over which provides the more cost-effective source of clean energy — it appears that wind has sun on the ropes. At least for the moment.

Both provide an environmentally friendly alternative to coal- and gas-fired electricity, and both emit none of the greenhouse gases associated with global warming. But solar power — despite several advantages over wind — is much more expensive, say experts.

“You get more bang for your buck from wind energy than from solar energy,” said Ryan Wiser, who leads renewable-energy research at the Lawrence Berkeley National Laboratory in California.

As the public expresses growing concern over global warming and rising utility bills, consumer advocates say itÂ’s more important than ever to balance the costs and benefits of wind power, solar power and other forms of renewable energy.

It’s not a question of whether the United States should pursue clean-air strategies — but rather which ones, and at what cost. Who stands to save money and who stands to pay more? Is nuclear power part of the solution?

In Texas, which recently leapfrogged over California to become the largest wind-power-generating state in the nation, the solar-power industry already lags far behind wind. And many more wind turbines are expected soon thanks to an aggressive and expensive plan to build more transmission lines.

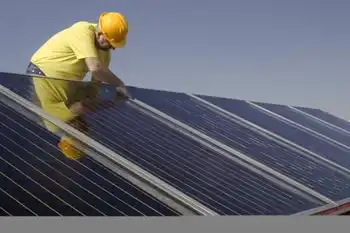
But California leads the nation in solar power and is pursuing even more through its Million Solar Roof Plan, which was signed into law by Republican Gov. Arnold Schwarzenegger in 2006.

A look at the Texas and California programs provides points for comparison.

In California, the plan is to provide new publicly funded rebates for those who install solar panels at their homes and businesses. California is charging ratepayers about $3.3 billion — or about $86 per Californian — to finance the program. That amounts to about $1 per month on a typical bill over a period of years, according to a representative of the California Public Utilities Commission.

Policymakers say the rebates will increase California solar power output by 3,000 megawatts by 2018 — or enough new power for about 1.5 million homes, under normal conditions.

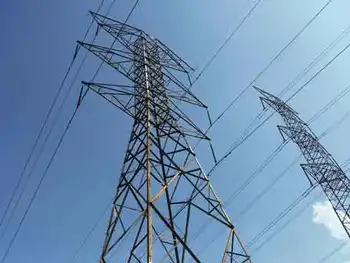
In comparison, the Competitive Renewable Energy Zone program in Texas will lead to the construction of $3 billion to $6.4 billion in transmission lines — all for wind power, and all constructed at utility ratepayers’ expense. That equates to anywhere from $150 to $320 for every Texan served by the state’s power grid, although the exact impact on home bills won’t be known until action later this year by the Texas Public Utility Commission. The cost will likely be spread over a number of years.

Under the Texas plan, the state hopes to encourage electric companies to build an additional 5,150 megawatts to 17,950 megawatts of wind turbines — or enough for 2.6 million to 9 million homes.

Bottom line: Under the California plan, the development of an additional megawatt of solar power would cost ratepayers $1.1 million. Under the Texas plan, an additional megawatt would cost $356,000 to $573,000.

But experts say solar power enjoys several advantages over wind — advantages that increases the value of sun power for those paying the bills.

For instance, because the wind typically stops blowing during the middle of hot summer days, Texas wonÂ’t get much use from those expensive new transmission lines when it needs the power the most. ThatÂ’s not a problem with solar.

Wind also presents tough — and sometimes expensive — technical challenges. Because wind turbines will stop spinning without a moment’s notice, engineers at the power grid must sometimes have more expensive standby power ready and waiting.

And finally thereÂ’s the question of power lines themselves. With wind power, ratepayers get stuck with the enormous price tag. This cost is avoided with rooftop solar power and can be minimized with other sorts of solar energy.

Wind-power advocates argue that concerns over the transmission costs are overblown. They say that savings from wind power — which has zero fuel costs — quickly offset the extra expense.

But some skeptics say that under the deregulated electricity system in Texas, thereÂ’s not a guarantee that ratepayers will see much of those savings. Instead, much of it may end up padding the bottom line of electric companies.

In California, by contrast, those who invest in solar panels can see savings reflected directly on their bills. Those savings — when combined with federal tax breaks and the new California rebates — can allow homeowners to recoup the cost of their investment in panels in a decade or so, said Marcel Hawiger, staff attorney for the Utility Reform Network, a California-based consumer advocacy group.

After that, the solar investment can lead to real reductions in home bills, he said.

Despite the advantages, Hawiger still questions whether that state’s solar initiative is a good deal for Californians. He calls the $3.3 billion addition to home rates one of “the most regressive forms of taxation” and notes that most of those installing the panels are businesses, not residences.

“Our residential customers are subsidizing commercial customers who are already getting a much better tax break for solar installation,” he said.

Despite the potentially high transmission costs and other disadvantages, wind power still remains much cheaper to produce than solar, said Severin Borenstein, director of the University of California Energy Institute.

He estimated solar power’s long-run average production cost at 25 cents to 30 cents per kilowatt hour — not including government subsidies and tax credits — as compared to 5 cents to 9 cents for wind power.

“Solar is four times as expensive than wind — or at least three times as expensive — even when you count transmission,” he said.

Hawiger said the most cost-effective way of reducing greenhouse gases remains energy-conservation efforts, and the adoption and enforcement of strict building codes that ensure that new homes are energy-efficient.

Related News

Warren Buffett’s Secret To Cheap Electricity: Wind

Berkshire Hathaway Energy Wind Power drives cheap electricity rates in Iowa via utility-scale wind turbines, integrated transmission, battery storage, and grid management, delivering renewable energy, stable pricing, and long-term rate freezes through 2028.


Key Points

A vertically integrated wind utility lowering Iowa rates via owned generation, transmission, and advanced grid control.

✅ Owned wind assets meet Iowa residential demand

✅ Integrated transmission lowers costs and losses

✅ Rate freeze through 2028 sustains cheap power


In his latest letter to Berkshire Hathaway shareholders, Warren Buffett used the 20th anniversary of Berkshire Hathaway Energy to tout its cheap electricity bills for customers.

When Berkshire purchased the majority share of BHE in 2000, the cost of electricity for its residential customers in Iowa was 8.8 cents per kilowatt-hour (kWh) on average. Since then, these electricity rates have risen at a paltry <1% per year, with a freeze on rate hikes through 2028. As anyone who pays an electricity bill knows, that is an incredible deal.  

As Buffett himself notes with alacrity, “Last year, the rates [BHE’s competitor in Iowa] charged its residential customers were 61% higher than BHE’s. Recently, that utility received a rate increase that will widen the gap to 70%.”


The Winning Strategy

So, what’s Buffett’s secret to cheap electricity? Wind power.

“The extraordinary differential between our rates and theirs is largely the result of our huge accomplishments in converting wind into electricity,” Buffett explains. 

Wind turbines in Iowa that BHE owns and operates are expected to generate about 25.2 million megawatt-hours (MWh) of electricity for its customers, as projects like Building Energy operations begin to contribute. By Buffett’s estimations, that will be enough to power all of its residential customers’ electricity needs in Iowa.  


The company has plans to increase its renewable energy generation in other regions as well. This year, BHE Canada is expected to start construction on a 117.6MW wind farm in Alberta, Canada with its partner, Renewable Energy Systems, that will provide electricity to 79,000 homes in Canada’s oil country.

Observers note that Alberta is a powerhouse for both green energy and fossil fuels, underscoring the region's unique transition.

But I would argue that the secret to BHE’s success perhaps goes deeper than transitioning to sources of renewable energy. There are plenty of other utility companies that have adopted wind and solar power as an energy source. In the U.S., where renewable electricity surpassed coal in 2022, at least 50% of electricity customers have the option to buy renewable electricity from their power supplier, according to the Department of Energy. And some states, such as New York, have gone so far as to allow customers to pick from providers who generate their electricity.

What differentiates BHE from a lot of the competition in the utility space is that it owns the means to generate, store, transmit and supply renewable power to its customers across the U.S., U.K. and Canada, with lessons from the U.K. about wind power informing policy.

In its financial filings for 2019, the company reported that it owns 33,600MW of generation capacity and has 33,400 miles of transmission lines, as well as a 50% interest in Electric Transmission Texas (ETT) that has approximately 1,200 miles of transmission lines. This scale and integration enables BHE to be efficient in the distribution and sale of electricity, including selling renewable energy across regions.

BHE is certainly not alone in building renewable-energy fueled electricity dominions. Its largest competitor, NextEra, built 15GW of wind capacity and has started to expand its utility-scale solar installations. Duke Energy owns and operates 2,900 MW of renewable energy, including wind and solar. Exelon operates 40 wind turbine sites across the U.S. that generate 1,500 MW.


Integrated Utilities Power Ahead

It’s easy to see why utility companies see wind as a competitive source of electricity compared to fossil fuels. As I explained in my previous post, Trump’s Wrong About Wind, the cost of building and generating wind energy have fallen significantly over the past decade. Meanwhile, improvements in battery storage and power management through new technological advancements have made it more reliable (Warren Buffett bet on that one too).

But what is also striking is that integrated power and transmission enables these utility companies to make those decisions; both in terms of sourcing power from renewable energy, as well as the pricing of the final product. Until wind and solar power are widespread, these utility companies are going to have an edge of the more fragmented ends of the industry who can’t make these purchasing or pricing decisions independently. 

Warren Buffett very rarely misses a beat. He’s not the Oracle of Omaha for nothing. Berkshire Hathaway’s ownership of BHE has been immensely profitable for its shareholders. In the year ended December 31, 2019, BHE and its subsidiaries reported net income attributable to BHE shareholders of $2.95 billion.

There’s no question that renewable energy will transform the utility industry over the next decade. That change will be led by the likes of BHE, who have the power to invest, control and manage their own energy generation assets.


Related News

View more

Iran turning thermal power plants to combined cycle to save energy

Iran Combined-Cycle Power Plants drive energy efficiency, cut greenhouse gases, and expand megawatt capacity by converting thermal units; MAPNA-led upgrades boost grid reliability, reduce fuel use, and accelerate electricity generation growth nationwide.


Key Points

Upgraded thermal plants that reuse waste heat to boost efficiency, cut emissions, and add capacity to Iran's grid.

✅ 27 thermal plants converted; 160 more viable units identified

✅ Adds 12,600 MW capacity via heat recovery steam generators

✅ Combined-cycle share: 31.2% of 80.509 GW capacity


Iran has turned six percent of its thermal power plans into combined cycle plants in order to reduce greenhouse gases and save energy, with potential to lift thermal plants' PLF under rising demand, IRNA reported, quoting an energy official.

According to the MAPNA Group’s Managing Director Abbas Aliabadi, so far 27 thermal power plants have been converted to combined-cycle ones, aligning with Iran’s push to transmit power to Europe as a regional hub.

“The conversion of a thermal power plant to a combined cycle one takes about one to two years, however, it is possible for us to convert all the country’s thermal power plants into combined cycle plants over a five-year period.

Currently, a total of 478 thermal power plants are operating throughout Iran, of which 160 units could be turned into combined cycle plants. In doing so, 12,600 megawatts will be added to the country’s power capacity, supporting ongoing exports such as supplying a large share of Iraq's electricity under existing arrangements.

Related cross-border work includes deals to rehabilitate Iraq's power grid that support future exchanges.

As reported by IRNA on Wednesday, Iran’s Nominal electricity generation capacity has reached 80,509 megawatts (80.509 gigawatts), and it is deepening energy cooperation with Iraq to bolster regional reliability. The country increased its electricity generation capacity by 500 megawatts (MW) compared to the last year (ended on March 20).

Currently, with a total generation capacity of 25,083 MW (31.2 percent) combined cycle power plants account for the biggest share in the country’s total power generation capacity followed by gas power plants generating 29.9 percent, amid global trends where renewables are set to eclipse coal and regional moves such as Israel's coal reduction signal accelerating shifts. EF/MA


Related News

View more

Crucial step towards completing nuclear plant achieved in Abu Dhabi

Barakah Unit 4 Cold Hydrostatic Testing validates reactor coolant system integrity at the Barakah Nuclear Energy Plant in Abu Dhabi, UAE, confirming safety, quality, and commissioning readiness under ENEC and KEPCO oversight.


Key Points

Pressure test of Unit 4's reactor coolant system, confirming integrity and safety for commissioning at Barakah.

✅ 25% above normal operating pressure verified.

✅ Welds, joints, and high-pressure components inspected.

✅ Supports safe, reliable, emissions-free baseload power.


The Emirates Nuclear Energy Corporation (ENEC) has successfully completed Cold Hydrostatic Testing (CHT) at Unit 4 of the Barakah Nuclear Energy Plant, the Arab world’s first nuclear energy plant being built in the Al Dhafra region of Abu Dhabi, UAE. The testing incorporated the lessons learned from the previous three units and is a crucial step towards the completion of Unit 4, the final unit of the Barakah plant.

As a part of CHT, the pressure inside Unit 4’s systems was increased to 25 per cent above what will be the normal operating pressure, demonstrating, as seen across global nuclear projects, the quality and robust nature of the Unit’s construction. Prior to the commencement of CHT, Unit 4’s Nuclear Steam Supply Systems were flushed with demineralised water, and the Reactor Pressure Vessel Head and Reactor Coolant Pump Seals were installed. During the Cold Hydrostatic Testing, the welds, joints, pipes and components of the reactor coolant system and associated high-pressure systems were verified.

Mohammed Al Hammadi, Chief Executive Officer of ENEC said: “I am proud of the continued progress being made at Barakah despite the circumstances we have all faced in relation to COVID-19. The UAE leadership’s decisive and proactive response to the pandemic supported us in taking timely, safety-led actions to protect the health and safety of our workforce and our plant. These actions, alongside the efforts of our talented and dedicated workforce, have enabled the successful completion of CHT at Unit 4, which was completed in adherence to the highest standards of safety, quality, and security.

“With this accomplishment, we move another step closer to achieving our goal of supplying up to a quarter of our nation’s electricity needs through the national grid and powering its future growth with safe, reliable, and emissions-free electricity,” he added.

By the end of 2019, ENEC and Korea Electric Power Corporation (KEPCO), working with Korea Hydro & Nuclear Power (KHNP) on the project, had successfully completed all major construction work including major concrete pouring, installation of the Turbine Generator, and the internal components of the Reactor Pressure Vessel (RPV) of Unit 4, which paved the way for the commencement of testing and commissioning.

The testing at Unit 4 represents a significant achievement in the development of the UAE Peaceful Nuclear Energy Program, following the successful completion of fuel assembly loading into Unit 1 in March 2020, confirming that the UAE has officially become a peaceful nuclear energy operating nation. Preparations are now in the final stages for the safe start-up of Unit 1, which subsequently reached 100% power ahead of commercial operations, in the coming months.

ENEC is currently in the final stages of construction of units 2, 3 and 4 of the Barakah Nuclear Energy Plant, as China’s nuclear program continues its steady development globally. The overall construction of the four units is more than 94% complete. Unit 4 is more than 84 per cent, Unit 3 is more than 92 per cent and Unit 2 is more than 95 per cent. The four units at Barakah will generate up to 25 per cent of the UAE’s electricity demand by producing 5,600 MW of clean baseload electricity, as projects such as new reactors in Georgia take shape, and preventing the release of 21 million tons of carbon emissions each year – the equivalent of removing 3.2 million cars off the roads annually.


Related News

View more

IEA warns fall in global energy investment may lead to shortages

Global Energy Investment Decline risks future oil and electricity supply, says the IEA, as spending on upstream, coal plants, and grids falls while renewables, storage, and flexible generation lag in the energy transition.


Key Points

Multi-year cuts to oil, power, and grid spending that increase risks of future supply shortages and market tightness.

✅ IEA warns underinvestment risks oil supply squeeze

✅ China and India slow coal plant additions; renewables rise

✅ Batteries aid flexibility but cannot replace seasonal storage


An almost 20 per cent fall in global energy investment over the past three years could lead to oil and electricity shortages, as surging electricity demand persists, and there are concerns about whether current business models will encourage sufficient levels of spending in the future, according a new report.

The International Energy Agency’s second annual IEA benchmark analysis of energy investment found that while the world spent $US1.7 trillion ($2.2 trillion) on fossil-fuel exploration, new power plants and upgrades to electricity grids last year, with electricity investment surpassing oil and gas even as global energy investment was down 12 per cent from a year earlier and 17 per cent lower than 2014.

While the IEA said continued oversupply of oil and electricity globally would prevent any imminent shock, falling investment “points to a risk of market tightness and undercapacity at some point down the line’’.

The low crude oil price drove a 44 per cent drop in oil and gas investment between 2014 and 2016. It fell 26 per cent last year. It was due to falls in upstream activity and a slowdown in the sanctioning of conventional oilfields to the lowest level in more than 70 years.

“Given the depletion of existing fields, the pace of investment in conventional fields will need to rise to avoid a supply squeeze, even on optimistic assumptions about technology and the impact of climate policies on oil demand,’’ the IEA warned in its report released yesterday evening. “The energy transition has barely begun in several key sectors, such as transport and industry, which will continue to rely heavily on oil, gas and coal for the foreseeable future.’’

The fall in global energy spending also reflected declining investment in power generation, particularly from coal plants.

While 21 per cent of global ­energy investment was made by China in 2016, the world’s fastest growing economy had a 25 per cent decline in the commissioning of new coal-fired power plants, due largely to air pollution issues and investment in renewables.

Investment in new coal-fired plants also fell in India.

“India and China have slammed the brakes on coal-fired generation. That is the big change we have seen globally,’’ said ­Bruce Mountain a director at CME Australia.

“What it confirms is the ­pressures and the changes we are seeing in Australia, the restructuring of our energy supply, is just part of a global trend. We are facing the pressures more sharply in Australia because our power prices are very high. But that same shift in energy source in Australia are being mirrored internationally.’’ The IEA — a Paris-based adviser to the OECD on energy policy — also highlighted Australia’s reduced power reserves in its report and called for regulatory change to encourage greater use of renewables.

“Australia has one of the highest proportions of households with PV systems on their roof of any country in the world, and its ­electricity use in its National ­Electricity Market is spread out over a huge and weakly connected network,’’ the report said.

“It appears that a series of accompanying investments and regulatory changes are needed, including a plan to avoid supply threats, to use Australia’s abundant wind and solar potential: changing system operation methods and reliability procedures as well as investment into network capacity, flexible generation and storage.’’ The report found that in Australia there had been an increase in grid-scale installations mostly associated with large-scale solar PV plants.

Last month the Turnbull ­government revealed it was prepared to back the construction of new coal-fired power stations to prevent further shortfalls in electricity supplies, while the PM ruled out taxpayer-funded plants and declared it was open to using “clean coal” technology to replace existing generators.

He also pledged “immediate” ­action to boost the supply of gas by forcing exporters to divert ­production into the domestic ­market.

Since then technology billionaire Elon Musk has promised to solve South Australia’s energy ­issues by building the world’s largest lithium-ion battery in the state.

But the IEA report said batteries were unlikely to become a “one size fits all” single solution to ­electricity security and flexibility provision.

“While batteries are well-suited to frequency control and shifting hourly load, they cannot provide seasonal storage or substitute the full range of technical services that conventional plants provide to stabilise the system,’’ the report said.

“In the absence of a major technological breakthrough, it is most likely that batteries will complement rather than substitute ­conventional means of providing system flexibility. While conventional plants continue to provide essential system services, their business model is increasingly being called into question in ­unbundled systems.’’


Related News

View more

Pickering NGS life extensions steer Ontario towards zero carbon horizon

OPG Pickering Nuclear Refurbishment extends four CANDU reactors to bolster Ontario clean energy, grid reliability, and decarbonization goals, leveraging Darlington lessons, mature supply chains, and AtkinsRealis OEM expertise for cost effective life extension.


Key Points

Modernizing four Pickering CANDU units to extend life, add clean power, and enhance Ontario grid reliability.

✅ Extends four 515 MW CANDU reactors by 30 years

✅ Supports clean, reliable baseload and decarbonization

✅ Leverages Darlington playbook and AtkinsRealis OEM supply chain


In a pivotal shift last month, Ontario Power Generation (OPG) revised its strategy for the Pickering Nuclear Power Station, scrapping plans to decommission its six remaining reactors. Instead, OPG has opted to modernize four reactors (Pickering B Units 5-8) starting in 2027, while Units 1 and 4 are slated for closure by the end of the current year.

This revision ensures the continued operation of the four 515 MW Canada Deuterium Uranium (CANDU) reactors—originally constructed in the 1970s and 1980s—extending their service life by at least 30 more years amid an extension request deadline for Pickering.

Todd Smith, Ontario's Energy Minister, underscored the significance of nuclear power in maintaining Ontario's status as a region with one of the cleanest and most reliable electricity grids globally. He emphasized the integral role of nuclear facilities, particularly the Pickering station, in the provincial energy strategy during the announcement supporting continued operations, which was made in the presence of union workers at the plant.

The Pickering station has demonstrated remarkable efficiency and reliability, notably achieving its second-highest output in 2023 and setting a record in 2022 for continuous operation. Extending the lifespan of nuclear plants like Pickering is deemed the most cost-effective method for sustaining low-carbon electricity, according to research conducted by the International Energy Agency (IEA) and the OECD Nuclear Energy Agency (NEA) across 243 plants in 24 countries.

The refurbishment project is poised to significantly boost Ontario's economy, projected to add CAN$19.4 billion to the GDP over 11 years and generate approximately 11,000 jobs annually. The Independent Electricity System Operator (IESO) has indicated that to meet the province's future electrification and decarbonization goals, as it faces a growing electricity supply gap, Ontario will need to double its nuclear capacity by 2050, requiring an addition of 17.8 GW of nuclear power.

Subo Sinnathamby, OPG's Senior Vice President of Nuclear Refurbishment, emphasized the necessity of nuclear energy in reducing reliance on natural gas. Sinnathamby, who is leading the refurbishment efforts at OPG's Darlington nuclear power station, where SMR plans are also underway, highlighted the positive impact of the Darlington and Bruce Power projects on the nuclear power supply chain and workforce.

The procurement strategy employed for Darlington, which involved placing orders early to ensure readiness among suppliers, is set to be replicated for the Pickering refurbishment. This approach aims to facilitate a seamless transition of skilled workers and resources from Darlington to Pickering refurbishment, leveraging a matured supply chain and experienced vendors.

AtkinsRealis, the original equipment manufacturer (OEM) for CANDU reactors, has a track record of successfully refurbishing CANDU plants worldwide. The CANDU reactor design, known for its refurbishment capabilities, allows for individual replacement of pressure tubes and access to fuel channels without decommissioning the reactor. Gary Rose, Executive Vice-President of Nuclear at AtkinsRealis, highlighted the economic benefits and environmental benefits of refurbishing reactors, stating it as a viable and swift solution to maximize fossil-free energy.

Looking forward, AtkinsRealis is exploring the potential for multiple refurbishments of CANDU reactors, which could extend their operational life beyond 100 years, addressing local energy needs and economic factors in the decision-making process. This innovative approach underscores the role of nuclear refurbishment in meeting global energy demands sustainably and economically.


Related News

View more

During this Pandemic, Save Money - How To Better Understand Your Electricity Bill

Commercial Electric Tariffs explain utility rate structures, peak demand charges, kWh vs kW pricing, time-of-use periods, voltage, delivery, capacity ratchets, and riders, guiding facility managers in tariff analysis for accurate energy savings.


Key Points

Commercial electric tariffs define utility pricing for energy, demand, delivery, time-of-use periods, riders, and ratchet charges.

✅ Separate kWh charges from kW peak demand fees.

✅ Verify time-of-use windows and demand interval length.

✅ Review riders, capacity ratchets, and minimum demand clauses.


Especially during these tough economic times, as major changes to electric bills are debated in some states, facility executives who don’t understand how their power is priced have been disappointed when their energy projects failed to produce expected dollar savings. Here’s how not to be one of them.

Your electric rate is spelled out in a document called a “tariff” that can be downloaded from your utility’s web page. A tariff should clearly spell out the costs for each component that is part of your rate, reflecting cost allocation practices in your region. Don’t be surprised to learn that it contains a bunch of them. Unlike residential electric rates, commercial electric bills are not based solely on the quantity of kilowatt-hours (kWh) consumed in a billing period (in the United States, that’s a month). Instead, different rates may apply to how your power is supplied, how it is delivered via electricity delivery charges, when it was consumed, its voltage, how fast it was used (in kW), and other factors.

If a tariff’s lingo and word structure are too opaque, spend some time with a utility account rep to translate it. Many state utility commissions also have customer advocates that may assist as they explore new utility rate designs that affect customers. Alternatively, for a fee, facility managers can privately chat with an energy consultant.

Common mistakes

Many facility managers try to estimate savings based on an averaged electric rate, i.e., annual electric spend divided by annual kWh. However, in markets where electricity demand is flat, such a number may obscure the fastest rising cost component: monthly peak demand charges, measured in dollars per kW (or kilo-volt-amperes, kVA).

This charge is like a monthly speeding ticket, based solely on the highest speed you drove during that time. In some areas, peak demand charges now account for 30 to 60 percent of a facility’s annual electric spend. When projecting energy cost savings, failing to separately account for kW peak demand and kWh consumption may result in erroneous results, and a lot of questions from the C-suite.

How peak demand charges are calculated varies among utilities. Some base it on the highest average speed of use across one hour in a month, while others may use the highest average speed during a 15- or 30-minute period. Others may average several of the highest speeds within a defined time period (for example, 8 a.m. to 6 p.m. on weekdays). It is whatever your tariff says it is.

Because some power-consuming (or producing) devices, including those tied to smart home electricity networks, vary in their operation or abilities, they may save money on a few — but not all — of those rate components. If an equipment vendor calculates savings from its product by using an average electric rate, take pause. Tell the vendor to return after the proposal has been redone using tariff-based numbers.

When a vendor is the only person calculating potential savings from using a product, there’s also a built-in conflict of interest: The person profiting from an equipment sale should not also be the one calculating its expected financial return. Before signing any energy project contracts, it’s essential that someone independent of the deal reviews projected savings. That person (typically an energy or engineering consultant) should be quite familiar with your facility’s electric tariff, including any special provisions, riders, discounts, etc., that may pertain. When this doesn’t happen, savings often don’t occur as planned. 

For example, some utilities add another form of demand charge, based on the highest kW in a year. It has various names: capacity, contract demand, or the generic term “ratchet charge.” Some utilities also have a minimum ratchet charge which may be based on a percent of a facility’s annual kW peak. It ensures collection of sufficient utility revenue to cover the cost of installed transmission and distribution even when a customer significantly cuts its peak demand.


Related News

View more

Sign Up for Electricity Forum’s Newsletter

Stay informed with our FREE Newsletter — get the latest news, breakthrough technologies, and expert insights, delivered straight to your inbox.

Electricity Today T&D Magazine Subscribe for FREE

Stay informed with the latest T&D policies and technologies.
  • Timely insights from industry experts
  • Practical solutions T&D engineers
  • Free access to every issue

Download the 2025 Electrical Training Catalog

Explore 50+ live, expert-led electrical training courses –

  • Interactive
  • Flexible
  • CEU-cerified