Build Back Better Act Energy Savings curb volatile fossil fuel heating bills by accelerating electrification and renewable electricity, insulating households from natural gas, propane, and oil price spikes while cutting emissions and lowering energy costs.
Key Points
BBBA policies expand clean power and electrification to curb volatility, lower bills, and cut emissions.
✅ Tax credits for renewables, EVs, and efficient all-electric homes
✅ Shields households from natural gas, propane, and heating oil spikes
✅ Cuts methane, lowers bills, and improves grid reliability and jobs
Experts are forecasting serious sticker shock from home heating bills this winter. Nearly 60 percent of United States’ households heat their homes with fossil fuels, including natural gas, propane, or heating oil, and these consumers are expected to spend much more this winter because of fuel price increases.
That could greatly burden many families and businesses already operating on thin margins. Yet homes that use electricity for heating and cooking are largely insulated from the pain of volatile fuel markets, and they’re facing dramatically lower price increases as a result.
Projections say cost increases for households could range anywhere from 22% to 94% more, depending on the fuel used for heating and the severity of the winter temperatures. But the added expenditures for the 41% of U.S. households using electricity for heating are much less stark—these consumers will see only a 6% price increase on average. The projected fossil fuel price spikes are largely due to increased demand, limited supply, declining fuel stores, and shifting investment priorities in the face of climate change.
The fossil fuel industry is already seizing this moment to use high prices to persuade policymakers to vote against clean energy policies, particularly the Build Back Better Act (BBBA). Spokespeople with ties to the fossil fuel industry and some consumer groups are trying to pin higher fuel prices on the proposed legislation even before it has passed, even as analyses show the energy crisis is not spurring a green revolution on its own, let alone begun impacting fuel markets. But the claim the BBBA would cost Americans and the economy is false.
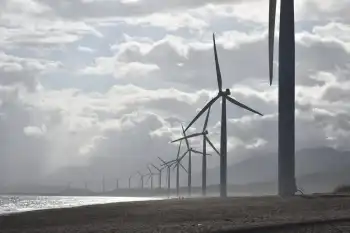
The facts tell a different story. Adopting smart climate policies and accelerating the clean energy transition are precisely the solutions to counter this vicious cycle by ending our dependance on volatile fossil fuels. The BBBA will ensure reliable, affordable clean electricity for millions of Americans, in line with a clean electricity standard many experts advocate—a key strategy for avoiding future vulnerability. Unlike fossil fuels subject to the whims of a global marketplace, wind and sunshine are always free. So renewable-generated electricity comes with an ultra-low fixed price decades into the future.
By expanding clean energy and electric vehicle tax credits, creating new incentives for efficient all-electric homes, and dedicating new funding for state and local programs, the BBBA provides practical solutions that build on lessons from Biden's climate law to protect Americans from price shocks, save consumers money, and reduce emissions fueling dangerous climate change.
What’s really causing the gas price spikes?
The U.S. Energy Information Administration’s winter 2021 energy price forecasts project that homes heated with natural gas, fuel oil, and propane will see average price increases of 30%, 43%, and 54%, respectively. Those who heat their homes with electricity, on the other hand, should expect a modest 6% increase. At the pump, drivers are seeing some of the highest gas prices in nearly a decade as the U.S. energy crisis ripples through electricity, gas, and EV markets today. And the U.S. is not alone. Countries around the globe are experiencing similar price jumps, including Britain's high winter energy costs this season.
A closer look confirms the cause of these high prices is not clean energy or climate policies—it’s fossil fuels themselves.
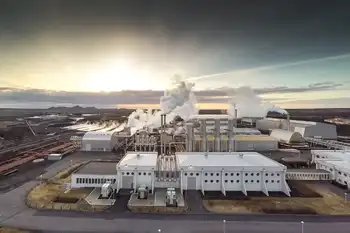
First, the U.S. (and the world) are just now feeling the effects of the oil and gas industry’s reduced fuel production and spending due to the pandemic. COVID-19 brought the world’s economies to a screeching halt, and most countries have not returned to pre-COVID economic activity. During the past 20 months, the oil and gas industry curtailed its production to avoid oversupply as demand fell to all-time lows. Just as businesses were reopening, stored fuel was needed to meet high demand for cooling during 2021’s hottest summer on record, driving sky-high summer energy bills for many households. February’s Texas Big Freeze also disrupted gas distribution and production.
The world is moving again and demand for goods and services is rebounding to pre-pandemic levels. But even with higher energy demand, OPEC announced it would not inject more oil into the economy. Major oil companies have also held oil and gas spending flat in 2021, with their share of overall upstream spending at 25%, compared with nearly 40% in the mid-2010s. And as climate change threats loom in the financial world, investors are reducing their exposure to the risks of stranded assets, increasingly diversifying and divesting from fossil fuels.
Second, despite strong and sustained growth for renewable energy, energy storage, and electric vehicles, the relatively slow pace to adopt fossil fuel alternatives at scale has left U.S. households and businesses tethered to an industry well-known for price volatility. Today, some oil drillers are using profits from higher gas prices to pay back debt and reward shareholders as demanded by investors, instead of increasing supply. Rising prices for a limited commodity in high demand is generating huge profits for many of the world’s largest companies at the expense of U.S. households.
Because 48% of homes use fossil gas for heating and another 10% heat with propane and fuel oil, more than half of U.S. households will feel the impact of rising prices on their home energy bills. One in four U.S. households continues to experience a high energy burden (meaning their energy expenses consume an inordinate amount of their income), including risks of pandemic power shut-offs that deepen energy insecurity, and many are still experiencing financial hardships exacerbated by the pandemic. Those with inefficient fossil-fueled appliances, homes, and cars will be hardest hit, and many families with fixed- and lower-incomes could be forced to choose between heat or other necessities.
We have the solutions—the BBBA will unlock their benefits for all households
Short-term band-aids may be enticing, but long-term policies are the only way out of this negative feedback loop. Clean energy and building electrification will prevent more costly disasters in the future, but they’re the very solutions the fossil fuel industry fights at every turn. All-electric homes and vehicles are a natural hedge against the price spikes we’re experiencing today since renewables are inherently devoid of fuel-related price fluctuations.
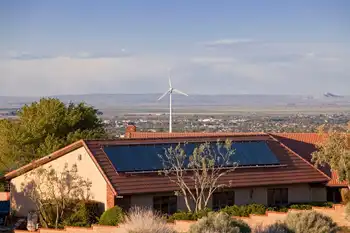
RMI analysis shows all-electric single-family homes in all regions of the country have lower energy bills than a comparable mixed fuel-homes (i.e., electricity and gas). Electric vehicles also save consumers money. Research from University of California, Berkeley and Energy Innovation found consumers could save a total of $2.7 trillion in 2050—or $1,000 per year, per household for the next 30 years—if we accelerate electric vehicle deployment in the coming decade.
The BBBA would help deliver these consumer savings by expanding and expediting clean energy, while ensuring equitable adoption among lower-income households and underserved communities. Extending and expanding clean energy tax credits; new incentives for electric vehicles (including used electric vehicles); and new incentives for energy efficient homes and all-electric appliances (and electrical upgrades) will reduce up-front costs and spur widespread adoption of all-electric homes, buildings, and cars.
A combination of grants, incentives, and programs will promote private sector investments in a decarbonized economy, while also funding and supporting state and local governments already leading the way. The BBBA also allocates dedicated funding and makes important modifications (such as higher rebate amounts and greater point-of-purchase availability) to ensure these technologies are available to low-income households, underserved urban and rural communities, tribes, frontline communities, and people living in multifamily housing.
Finally, the BBBA proposes to make oil and gas polluters pay for the harm they are causing to people’s health and the climate through a methane fee. This fee would cost companies less than 1% of their revenue, meaning the industry would retain over 99% of its profits. In return return we’d see substantial reductions of a powerful greenhouse gas and a healthier environment in communities living near fossil fuel production. These benefits also come with a stronger economy—Energy Innovation analysis shows the methane fee would create more than 70,000 jobs by 2050 and boost gross domestic product more than $250 billion from 2023 to 2050.
The facts speak for themselves. Gas prices are rising because of reasons totally unrelated to smart climate and clean energy policies, which research shows actually lower costs. For the first time in more than a decade, America has the opportunity to enact a comprehensive energy policy that will yield measurable savings to consumers and free us from oil and gas industry control over our wallets.
The BBBA will help the U.S. get off the fossil fuel rollercoaster and achieve a stable energy future, ensuring that today’s price spikes will be a thing of the past. Proving, once and for all, that the solution to our fossil fuel woes is not more fossil fuels.
Related News