European Green Deal Electrification accelerates decarbonization via renewables, electric vehicles, heat pumps, and clean industry, backed by sustainable finance, EIB green lending, just transition funds, and energy taxation reform to phase out fossil fuels.
Key Points
An EU plan to replace fossil fuels with renewable electricity in transport, buildings, and industry, supported by green finance.
✅ Doubles electricity's share to cut CO2 and phase out fossil fuels.
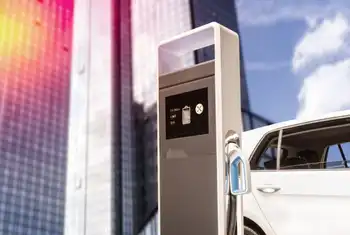
✅ Drives EVs, heat pumps, and electrified industry via renewables.
✅ Funded by EIB lending, EU budget, and just transition support.
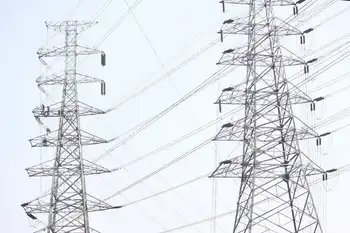
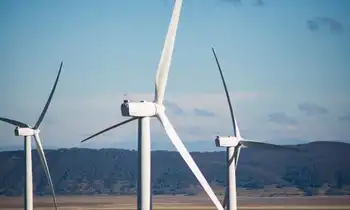
The European Union is preparing an ambitious plan to completely decarbonize by 2050. Increasing the share of electricity in Europe’s energy system – electricity that will increasingly come from renewable sources - will be at the center of this strategy, aligning with the broader global energy transition under way, the new head of the European Commission’s energy department said yesterday.
This will mean more electric cars, electric heating and electric industry. The idea is that fossil fuels should no longer be a primary energy source, heating homes, warming food or powering cars. In the medium term they should only be used to generate electricity, a shift mirrored by New Zealand's electricity shift efforts, which then powers these things, resulting in less CO2 emissions.
“First assessments show we need to double the share of electricity in energy consumption by 2050,” Ditte Juul-Jørgensen said at an event in Brussels this week, a goal echoed by recent calls to double investment in power systems from world leaders. “We’ve already seen an increase in the last decade, but we need to go further”.
Juul-Jørgensen, who started in her job as director-general of the commission’s energy department in August, has come to the role at a pivotal time for energy. The 2050 decarbonization proposal from the Commission, the EU’s executive branch, is expected to be approved next month by EU national leaders. A veto from Poland that has blocked adoption until now is likely to be overcome if Poland and other Eastern European countries are offered financial assistance from a “just transition fund”, according to EU sources.
Ursula von der Leyen, the incoming President of the Commission, has promised to unveil a “European Green Deal” in her first 100 days in office designed to get the EU to its 2050 goal. Juul-Jørgensen will be working with the incoming EU Energy Commissioner, Kadri Simson, on designing this complex strategy. The overall aim will be to phase out fossil fuels, and increase the use of electricity from green sources, amid trends like oil majors pivoting to electric across Europe today.
“This will be about how do we best make use of electricity to feed into other sectors,” Juul-Jørgensen said. “We need to think about transforming it into other sources, and how to best transport it.”
“But the biggest challenge from what I see today is that of investment and finance - the changes we have to make are very significant.”
Financing problems
The Commission is going to try to tackle the challenges of financing the energy transition with two tools: dedicated climate funding in the EU budget, and dedicated climate lending from the European Investment Bank.
“The EIB will play an increasing role in future. We hope to see agreement [with the EIB board] on that in the coming months so there’s a clear operator in the EIB to support the green transition. We’re looking at something around €400 billion a year.”
The Commission’s proposed dedicated climate spending in the next seven-year budget must still be approved by the 28 EU national governments. Juul-Jørgensen said there is unanimous agreement on the amount: 25% of the budget. But there is disagreement about how to determine what is green spending.
“A lot of work has been ongoing to ensure that when it comes to counting it reflects the reality of the investments,” she said. “We’re working on the taxonomy on sustainable finance - internally identifying sectors contributing to overall climate objectives.”
Electricity pact
Juul-Jørgensen was speaking at an event organized by the the Electrification Alliance, a pact between nine industry organizations to lobby for electricity to be put at the heart of the European green deal. They signed a declaration at the event calling for a variety of measures to be included in the green deal, reflecting debates over a fully renewable grid by 2030 in other jurisdictions, including a change to the EU’s energy taxation regime which incentivizes a switch from fossil fuel to electricity consumption.
“Electrification is the most important solution to turn the vision of a fossil-free Europe into reality,” said Laurence Tubiana, CEO of the European Climate Foundation, one of the signatories, and co-architect of the Paris Agreement.
“We are determined to deliver, but we must be mindful of the different starting points and secure sufficient financing to ensure a fair transition”, said Magnus Hall, President of electricity industry association Eurelectric, another signatory.
The energy taxation issue has been particularly tricky for the EU, since any change in taxation rules requires the unanimous consent of all 28 EU countries. But experts say that current taxation structures are subsidizing fossil fuels and punishing electricity, as recent UK net zero policy changes illustrate, and unless this is changed the European Green Deal can have little effect.
“Yes this issue will be addressed in the incoming commission once it takes up its function,” Juul-Jørgensen said in response to an audience question. “We all know the challenge - the unanimity requirement in the Council - and so I hope that member states will agree to the direction of work and the need to address energy taxation systems to make sure they’re consistent with the targets we’ve set ourselves.”
But some are concerned that the transformation envisioned by the green deal will have negative impacts on some of the most vulnerable members of society, including those who work in the fossil fuel sector.
This week the Centre on Regulation in Europe sent an open letter to Frans Timmermans, the Commission Vice President in charge of climate, warning that they need to be mindful of distributional effects. These worries have been heightened by the yellow vest protests in France, which were sparked by French President Emmanuel Macron’s attempt to increase fuel taxes for non-electric cars.
“The effectiveness of climate action and sustainability policies will be challenged by increasing social and political pressures,” wrote Máximo Miccinilli, the center’s director for energy. “If not properly addressed, those will enhance further populist movements that undermine trust in governance and in the public institutions.”
Miccinilli suggests that more research be done into identifying, quantifying and addressing distributional effects before new policies are put in place to phase out fossil fuels. He proposes launching a new European Observatory for Distributional Effects of the Energy Transition to deal with this.
EU national leaders are expected to vote on the 2050 decarbonization target, building on member-state plans such as Spain's 100% renewable electricity goal by mid-century, at a summit in Brussels on December 12, and Von der Leyen will likely unveil her European Green Deal in March.
Related News