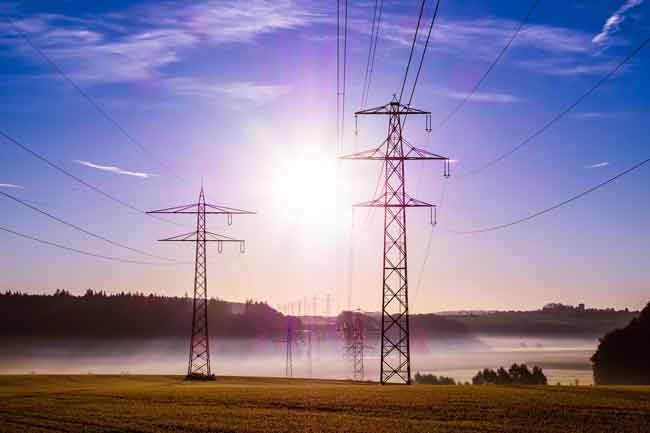
Wireless power transfer pursued

By Associated Press


Protective Relay Training - Basic

Our customized live online or in‑person group training can be delivered to your staff at your location.

  • Live Online
  • 12 hours Instructor-led
  • Group Training Available
Regular Price:
$699
Coupon Price:
$599
Reserve Your Seat Today
Imagine juicing up your laptop computer or cell phone without plugging into an electrical socket. That luxury could be provided by wireless power transmission, a concept bandied about for decades that is creeping closer to becoming viable.

Building off work unveiled last year by Massachusetts Institute of Technology researchers, Intel Corp. demonstrated how to make a 60-watt light bulb glow from an energy source 3 feet away. The Intel team did it with relatively high efficiency, losing only a quarter of the energy the researchers started with.

"That to me is the most striking part about it – transmitting 60 watts at 75 percent efficiency over several feet," Intel's chief technology officer, Justin Rattner, said in an interview. "The power pack for your laptop isn't that efficient... it's one of those things that's almost too good to be true."

Wireless transmission of electricity makes use of some basic physics – electric coils that resonate at the same frequency can transmit energy to each other at a distance.

But this technology has a long way to evolve before it becomes a commercial product. In both the MIT and the Intel work, researchers used charging coils far too large for wide-scale use.

Eventually, a homeowner could attach a large transmitter to a wall – or even bury it inside the wall – and plant smaller receivers inside nearby tables and chairs and other pieces of furniture, creating the ultimate in recharging convenience.

Related News

Texas produces and consumes the most electricity in the US

Texas ERCOT Power Grid leads U.S. wind generation yet faces isolated interconnection, FERC exemption, and high industrial energy use, with distinct electricity and natural gas prices managed by a single balancing authority.


Key Points

The state-run interconnection that balances Texas electricity, isolated from FERC oversight and other U.S. grids.

✅ Largest U.S. wind power producer, high industrial demand

✅ Operates one balancing authority, independent interconnection

✅ Pays lower electricity, higher natural gas vs national average


For nearly two decades, the Lone Star State has generated more wind-sourced electricity than any other state in the U.S., according to the Energy Information Administration, or EIA.

In 2022, EIA reported Texas produced more electricity than any other state and generated twice as much as second-place Florida.

However, Texas also leads the country in another category. According to EIA, Texas is the largest energy-consuming state in the nation across all sectors with more than half of the state’s energy being used by the industrial sector.

As of May 2023, Texas residents paid 43% more for natural gas and around 10% less for electricity compared to the national average, according to EIA, and in competitive areas shopping for electricity is getting cheaper as well. Commercial and industrial sectors on average for the same month paid 25% less for electricity compared to the national average.


U.S. electric system compared to Texas
The U.S. electric system is essentially split into three regions called interconnections and are managed by a total of 74 entities called balancing authorities that ensure that power supply and demand are balanced throughout the region to prevent the possibility of blackouts, according to EIA.

The three regions (Interconnections):

Eastern Interconnection: Covers all U.S. states east of the Rocky Mountains, a portion of northern Texas, and consists of 36 balancing authorities.
Western Interconnection: Covers all U.S. states west of the Rockies and consists of 37 balancing authorities.
ERCOT: Covers the majority of Texas and consists of one balancing authority (itself).

During the 2021 winter storm, Texas electric cooperatives were credited with helping maintain service in many communities.

“ERCOT is unique in that the balancing authority, interconnection, and the regional transmission organization are all the same entity and physical system,” according to EIA, a structure often discussed in analyses of Texas power grid challenges today.

With this being the case, Texas is the only state in the U.S. that balances itself, the only state that is not subject to the jurisdiction of the Federal Energy Regulatory Commission, or FERC, and the only state that is not synchronously interconnected to the grid in the rest of the United States in the event of tight grid conditions, highlighting ongoing discussions about improving Texas grid reliability before peak seasons, according to EIA.

Every other state in the U.S. is connected to a web of multiple balancing authorities that contribute to ensuring power supply and demand are met.

California, for example, was the fourth largest electricity producer and the third largest electricity consumer in the nation in 2022, according to EIA, and California imports the most electricity from other states while Pennsylvania exports the most.

Although California produces significantly less electricity than Texas, it has the ability to connect with more than 10 neighboring balancing authorities within the Western Interconnection to interchange electricity, a dynamic that can see clean states importing dirty electricity under certain market conditions. ERCOT being independent only has electricity interchange with two balancing authorities, one of which is in Mexico.

Regardless of Texas’ unique power structure compared to the rest of the nation, the vast majority of the U.S. risked electricity supplies during this summer’s high heat, as outlined in severe heat blackout risks reports, according to EIA.


Related News

View more

No time to be silent on NZ's electricity future

New Zealand Renewable Energy Strategy examines decarbonisation, GHG emissions, and net energy as electrification accelerates, expanding hydro, geothermal, wind, and solar PV while weighing intermittency, storage, materials, and energy security for a resilient power system.


Key Points

A plan to expand electricity generation, balancing decarbonisation, net energy limits, and energy security.

✅ Distinguishes decarbonisation targets from renewable capacity growth

✅ Highlights net energy limits, intermittency, and storage needs

✅ Addresses materials, GHG build-out costs, and energy security


The Electricity Authority has released a document outlining a plan to achieve the Government’s goal of more than doubling the amount of electricity generated in New Zealand over the next few decades.

This goal is seen as a way of both reducing our greenhouse gas (GHG) emissions overall, as everything becomes electrified, and ensuring we have a 100 percent renewable energy system at our disposal. Often these two goals are seen as being the same – to decarbonise we must transition to more renewable energy to power our society.

But they are quite different goals and should be clearly differentiated. GHG emissions could be controlled very effectively by rationing the use of a fossil fuel lockdown approach, with declining rations being available over a few years. Such a direct method of controlling emissions would ensure we do our bit to remain within a safe carbon budget.

If we took this dramatic step we could stop fretting about how to reduce emissions (that would be guaranteed by the rationing), and instead focus on how to adapt our lives to the absence of fossil fuels.

Again, these may seem like the same task, but they are not. Decarbonising is generally thought of in terms of replacing fossil fuels with some other energy source, signalling that a green recovery must address more than just wind capacity. Adapting our lives to the absence of fossil fuels pushes us to ask more fundamental questions about how much energy we actually need, what we need energy for, and the impact of that energy on our environment.

MBIE data indicate that between 1990 and 2020, New Zealand almost doubled the total amount of energy it produced from renewable energy sources - hydro, geothermal and some solar PV and wind turbines.

Over this same time period our GHG emissions increased by about 25 percent. The increase in renewables didn’t result in less GHG emissions because we increased our total energy use by almost 50 percent, mostly by using fossil fuels. The largest fossil fuel increases were used in transport, agriculture, forestry and fisheries (approximately 60 percent increases for each).

These data clearly demonstrate that increasing renewable energy sources do not necessarily result in reduced GHG emissions.

The same MBIE data indicate that over this same time period, the amount of Losses and Own Use category for energy use more than doubled. As of 2020 almost 30 percent of all energy consumed in New Zealand fell into this category.

These data indicate that more renewable energy sources are historically associated with less energy actually being available to do work in society.

While the category Losses and Own Use is not a net energy analysis, the large increase in this category makes the call for a system-wide net energy analysis all the more urgent.

Net energy is the amount of energy available after the energy inputs to produce and deliver the energy is subtracted. There is considerable data available indicating that solar PV and wind turbines have a much lower net energy surplus than fossil fuels.

And there is further evidence that when the intermittency and storage requirements are engineered into a total renewable energy system, the net energy of the entire system declines sharply. Could the Losses and Other Uses increase over this 30-year period be an indication of things to come?

Despite the importance of net energy analysis in designing a national energy system which is intended to provide energy security and resilience, there is not a single mention of net energy surplus in the EA reference document.

So over the last 30 years, New Zealand has doubled its renewable energy capacity, and at the same time increased its GHG emissions and reduced the overall efficiency of the national energy system.

And we are now planning to more than double our renewable energy system yet again over the next 30 years, even as zero-emissions electricity by 2035 is being debated elsewhere. We need to ask if this is a good idea.

How can we expand New Zealand’s solar PV and wind turbines without using fossil fuels? We can’t.

How could we expand our solar PV and wind turbines without mining rare minerals and the hidden costs of clean energy they entail, further contributing to ecological destruction and often increasing social injustices? We can't.

Even if we could construct, deliver, install and maintain solar PV and wind turbines without generating more GHG emissions and destroying ecosystems and poor communities, this “renewable” infrastructure would have to be replaced in a few decades. But there are at least two major problems with this assumed scenario.

The rare earth minerals required for this replacement will already be exhausted by the initial build out. Recycling will only provide a limited amount of replacements.

The other challenge is that a mostly “renewable” energy system will likely have a considerably lower net energy surplus. So where, in 2060, will the energy come from to either mine or recycle the raw materials, and to rebuild, reinstall and maintain the next iteration of a renewable energy system?

There is currently no plan for this replacement. It is a serious misnomer to call these energy technologies “renewable”. They are not as they rely on considerable raw material inputs and fossil energy for their production and never ending replacement.

New Zealand is, of course, blessed with an unusually high level of hydro electric and geothermal power. New Zealand currently uses over 170 GJ of total energy per capita, 40 percent of which is “renewable”. This provides approximately 70 GJ of “renewable” energy per capita with our current population.

This is the average global per capita energy level from all sources across all nations, as calls for 100% renewable energy globally emphasize. Several nations operate with roughly this amount of total energy per capita that New Zealand can generate just from “renewables”.

It is worth reflecting on the 170 GJ of total energy use we currently consume. Different studies give very different results regarding what levels are necessary for a good life.

For a complex industrial society such as ours, 100 GJ pc is said to be necessary for a high levels of wellbeing, determined both subjectively (life satisfaction/ happiness measures), and objectively (e.g. infant mortality levels, female morbidity as an index of population health, access to nutritious food and educational and health resources, etc). These studies do not take into account the large amount of energy that is wasted either through inefficient technologies, or frivolous use, which effective decarbonization strategies seek to reduce.

Other studies that consider the minimal energy needed for wellbeing suggest a much lower level of per capita energy consumption is required. These studies take a different approach and focus on ensuring basic wellbeing is maintained, but not necessarily with all the trappings of a complex industrial society. Their results indicate a level of approximately 20 GJ per capita is adequate.

In either case, we in New Zealand are wasting a lot of energy, both in terms of the efficiency of our technologies (see the Losses and Own Use info above), and also in our uses which do not contribute to wellbeing (think of the private vehicle travel that could be done by active or public transport – if we had good infrastructure in place).

We in New Zealand need a national dialogue about our future. And energy availability is only one aspect. We need to discuss what our carrying capacity is, what level of consumption is sustainable for our population, and whether we wish to make adjustments in either our per capita consumption or our population. Both together determine whether we are on the sustainable side of carrying capacity. Currently we are on the unsustainable side, meaning our way of life cannot endure. Not a good look for being a good ancestor.

The current trajectory of the Government and Electricity Authority appears to be grossly unsustainable. At the very least they should be able to answer the questions posed here about the GHG emissions from implementing a totally renewable energy system, the net energy of such a system, and the related environmental and social consequences.

Public dialogue is critical to collectively working out our future. Allowing the current profit-driven trajectory to unfold is a recipe for disasters for our children and grandchildren.

Being silent on these issues amounts to complicity in allowing short-term financial interests and an addiction to convenience jeopardise a genuinely secure and resilient future. Let’s get some answers from the Government and Electricity Authority to critical questions about energy security.


Related News

View more

4 ways the energy crisis hits U.S. electricity, gas, EVs

U.S. Energy Crunch disrupts fuel and power markets, driving natural gas price spikes, coal resurgence, utility mix shifts, supply chain strains for EV batteries, and inflation pressures, complicating climate policy, OPEC outreach and LNG trade


Key Points

Supply-demand gaps raise fuel costs, revive coal, strain EV materials, and complicate U.S. climate policy and plans.

✅ Natural gas spikes shift generation from gas to coal

✅ Supply chain shortages hit nickel, silicon, and chips

✅ Policy tensions between price relief and decarbonization


A global energy crunch is creating pain for people struggling to fill their tanks and heat their homes, as well as roiling the utility industry’s plans to change its mix of generation and complicating the Biden administration’s plans to tackle climate change.

The ripple effects of a surge in natural gas prices include a spike in coal use and emissions that counter clean energy targets. High fossil fuel prices also are translating into high prices and a supply crunch for key minerals like silicon used in clean energy projects. On a call with investors yesterday, a Tesla Inc. executive said the company is having a hard time finding enough nickel for batteries.

The crisis could pose political problems for the Biden administration, which spent the last few months fending off criticism about rising fuel prices and inflation (Energywire, Oct. 14).

“Energy issues at this moment are as salient to the American public as they have been in quite some time,” said Christopher Borick, who directs the Muhlenberg College Institute of Public Opinion in Pennsylvania, where Biden stopped yesterday to pitch his infrastructure plan.

While gasoline prices have gotten headlines all summer, natural gas prices have risen faster than motor fuels, more than doubling from an average $1.92 per thousand cubic feet in September 2020 to $5.16 last month. By comparison, gasoline prices have risen about 55 percent in the last year, to $3.36 per gallon nationwide this week, according to AAA.

The roots of the problem go back to the beginning of the pandemic and the recession in 2020. Oil and gas prices fell so fast then that many producers, particularly in the U.S., simply stopped drilling.

Oil companies began predicting a few months later that the abrupt shutdown would eventually lead to shortages and price spikes when the economy recovered. Those predictions turned out to be accurate.

With the economy beginning to recover, demand for gas has gone up, but there’s not enough supply to go around.

While the U.S. energy crunch isn’t as severe as Europe’s energy crisis today, and analysts predict that gas prices will gradually fall next year, consumers could be in for a rough couple of months.

Here’s four ways the global energy crisis is impacting the United States, from the electricity sector to the political landscape:

What are the political repercussions?
For the Biden administration, the energy price hikes come amid fears of rising inflation and persistent supply bottlenecks at the nation’s ports as its climate ambitions face headwinds in Congress.

“The confluence of energy prices, logistical challenges and the need to move on climate have raised this to the top tier,” said Borick, who in the past has polled on energy and environmental issues in Pennsylvania.

Borick noted the administration is facing counterpressures: Even as it pushes to decarbonize the nation’s electric system, it wants to keep gas prices in check. High gasoline prices have been linked to declining political approval ratings, including for presidents, even if much of the price hikes are beyond their control.

White House press secretary Jen Psaki said earlier this month that the administration can take steps to address what it called “short-term supply issues,” but also needs to focus on the long term — and climate.

In hopes of capping prices, the White House has spoken with members of OPEC about increasing oil production — though OPEC has little control over natural gas prices. And earlier this month, the administration talked to U.S. oil and gas producers about helping to bring down prices.

That comes even as environmentalists have pushed Biden to ban federal fossil fuel leasing and drilling and stop new projects.

The moves to curb prices have prompted ridicule from Republicans, who have accused Biden of declaring war on U.S. energy by canceling the Keystone XL pipeline.

“The Biden administration won’t say it out loud, yet let’s admit it: There is a crisis,” Sen. John Barrasso (R-Wyo.) said this week on the Senate floor. “It is one that Joe Biden and his administration has created. It is a crisis of Joe Biden’s own making.”

The situation has also resurfaced comparisons to former President Carter, who struggled politically in the 1970s with gasoline shortages and other energy pressures. Some political scientists say, though, the comparison between the two isn’t apples to apples.

"In 1979, the crisis began with the Iranian Revolution, producing a supply shortage. In the USA, some states rationed the supply. That’s not occurring now. Oil prices were also regulated, another difference, “ said Terry Madonna, a senior fellow in residence for political affairs at Millersville University.

A Morning Consult poll released yesterday carried warning signs for Democrats with worries about the economy on the rise across the political spectrum.

Voters, however, were evenly split on how Biden is handling energy. Forty-two percent of respondents approve of Biden’s energy policy, compared with 45 percent who disapproved. The margin of error is 2 percentage points.

Will the electricity mix change?
Higher gas prices are giving coal a boost in some markets.

Atlanta-based Southern Co. told CNBC earlier this week, for instance, that coal was about 17 percent of the company’s power mix last year. That has changed in 2021.

“The unintended consequence of high gas prices is that coal becomes more economic, and so my sense is … our coal production has bumped up above 20 percent,” Southern CEO Tom Fanning said. “Now, how long that’ll persist, I don’t know.”

Fanning said “what we’re seeing right now, and the real challenge in America, is this notion of energy in transition.”

But the U.S. power sector has been evolving for years, with more renewables and less coal on the grid, and experts say the current energy crunch won’t change long-term utility trends in the industry.

“In general, I wouldn’t place too much emphasis on short-term fluctuations,” Jay Apt, a professor at Carnegie Mellon University, said in an email. “There is still a robust supply chain for most components needed for low-pollution power, including renewables.”

In fact, elevated fossil fuel prices, and high natural gas prices in particular, could accelerate the move toward wind, solar and batteries in some areas. That’s because power plants that run on coal and natural gas can be affected by rising and volatile fuel prices, as illustrated by the recent move in commodities globally. That means higher costs to run the facilities, even if power prices often climb along with gas prices.

“If I were a utility planner, this would cause me to double down on new generation from [wind] and solar and storage as opposed to building additional natural gas plants where, you know, I could be having these super high and volatile operating costs,” said Bri-Mathias Hodge, an associate professor in the Department of Electrical, Computer and Energy Engineering at the University of Colorado, Boulder.

Ed Hirs, an energy fellow at the University of Houston, said the current global situation doesn’t change the U.S. power sector’s overall move toward generation with lower operating costs.

For example, he said nuclear and coal plants can require hundreds of employees, and both have fuel costs. Hirs said a gas facility also needs fuel and may need dozens of employees. Wind and solar facilities often need a smaller number of workers and don’t require fuel in their operations, he noted.

“Eventually the cheap wins out,” Hirs said.

That isn’t even factoring in climate change — the reason world leaders are seeking to slash greenhouse gas emissions. Indeed, lowering emissions remains a priority among many states and big companies in the U.S.

Over the next 10 to 15 years, Hirs said, a key question will be whether battery technology can compete economically in terms of backing up renewables. He said a national carbon price, if enacted, would aid renewables and enhance returns on batteries.

“The real battle is going to be between natural gas and battery storage,” Hirs said.

Apt and M. Granger Morgan, who’s also a Carnegie Mellon professor, noted in a Hill piece last month that the U.S. gets about 40 percent of its power from carbon-free sources, including nuclear.

“Modelers and many power system operators agree that it is possible that renewables can cost-effectively make up roughly 80% of electricity generation,” the professors wrote, adding that other sources could include “storage and gas turbines powered with hydrogen, synfuels, or natural gas with carbon capture.”

What about EVs and renewables?
As for electric vehicles, executives with Tesla said on a call yesterday that supply-chain problems are the major brake on production for both vehicles and batteries.

Chief Financial Officer Zachary Kirkhorn said that the company’s factories aren’t running at full capacity because of an ongoing shortage of semiconductor chips. Customers are waiting longer for vehicles, he said, and wait lists are growing.

The challenges extend to raw materials. In batteries, Kirkhorn said, the company is having trouble finding enough nickel, and in vehicles, it is scrounging for aluminum. He said the problem is "not small," and that prices may rise as supply contracts come up for renewal.

The supply problems are creating "cost headwinds," he said, and so are rising labor costs. Tesla is not immune from the worker shortages that are plaguing the entire U.S. economy.

The production woes aren’t limited to Tesla: Automakers around the world have have had their output crimped by the chip shortage that accompanied the economic rebound after pandemic lockdowns. Unlike many other automakers, Tesla hasn’t been forced to pause its factory lines.

Tesla said it is poised to greatly expand its production of batteries for the electric grid — with a caveat.

Last month, Tesla broke ground on a new California factory to make Megapack, its 3 megawatt-per-hour lithium-ion batteries for use by power companies. That future factory’s capacity, 40 gigawatt per hour a year, is vastly more than the 3 GWh it made in the last calendar year.

However, today’s supply-chain problems are braking the making of both Megapack and Powerwall, Tesla’s battery for homes, Kirkhorn said. He added that production will increase "as soon as parts allow us."

Other advocates for EVs and renewable power expressed little concern about the supply crunch’s meaning for their industries, noting that higher prices alone don’t automatically trigger a broader green revolution on their own.

Those problems likely wouldn’t change the immediate course of the energy transition, researchers said.

"Short-term trends, week to week or even month to month, don’t matter much for investors or policy makers," wrote John Graham, a former budget official with the Bush administration and professor at Indiana University’s O’Neill School of Public and Environmental Affairs, in an email to E&E News.

The crunch may give policymakers a glimpse of the future, however, according to one minerals analyst.

"This isn’t going to be an outlier. I think increasingly you’re going to see pockets of the world start to feel these strains," said Andrew Miller, product director at Benchmark Mineral Intelligence, which focuses its research on battery minerals and battery supply chains.

The U.S. and its allies are only now beginning to develop their own supply chains for batteries and other key clean energy technologies, he noted. "The issue you’re facing, and this is one coming over time, is to have the platform in place. You have to have the supply chain of raw materials," he said.

"I think you’re going to see the most turbulence over the coming decade. … It’s not going to be a smooth transition,” added Miller.

How long will gas prices stay high?
The gap between natural gas demand and supply has led to severe price spikes in Europe, where utilities and other gas buyers have to compete against China for cargoes of liquefied natural gas, according to a research note from IHS Markit Ltd.

Here in the U.S., the causes are the same, but the results aren’t as extreme. Less than 10 percent of domestic gas production is exported as LNG, so American customers don’t have to compete as much against overseas buyers.

Instead, gas-hungry sectors of the economy have run into another problem, IHS analyst Matthew Palmer said in an interview. Gas producers have been cautious about increasing their output, largely because of pressure from investors to limit their spending.

“That theme has really put a governor on production,” he said.

The disconnect will likely mean higher home gas bills and higher electric prices this winter, although deep freeze events or warm weather could disrupt the trend, he said. The U.S. Energy Information Administration is predicting that average heating bills for homes that use gas furnaces will rise 30 percent this winter.

This comes as U.S. gas supply remains high, according to a biennial assessment from the Potential Gas Committee, a group of volunteer geoscientists, engineers and other experts.

Including reserves, future gas supply in the U.S. stands at a record 3,863 trillion cubic feet, up 25 tcf from levels reported in 2019, the group said Tuesday at an event co-hosted with the American Gas Association.

Of that total, so-called technically recoverable resources — or those in the ground but not yet recovered — are 3,368 tcf, the PGC said, down less than 0.2 percent from the last assessment.

The amount of technically recoverable gas went relatively unchanged from year-end 2018 for several reasons, including a lack of company activity in exploration efforts last year due to COVID, said Alexei Milkov, the group’s executive director.

Another factor is that basins mature and shale plays “cannot increase in resources forever,” said Milkov, also a professor of geology and geological engineering at the Colorado School of Mines.

Still, Milkov added, “We cannot tell you right now if we are on a new plateau, or if we are going to start seeing more growth in gas resources again, right, because it’s a complex issue.”

The EIA predicts that gas production will increase and prices will begin to drop in 2022.

David Flaherty, CEO of the Republican polling firm Magellan Strategies in Colorado, said prices could particularly hit seniors. But he said he expected the energy crunch to ease in the U.S. well before the election.

“By early summer, this is likely to be behind us,” he said.


Related News

View more

Which of the cleaner states imports dirty electricity?

Hourly Electricity Emissions Tracking maps grid balancing areas, embodied emissions, and imports/exports, revealing carbon intensity shifts across PJM, ERCOT, and California ISO, and clarifying renewable energy versus coal impacts on health and climate.


Key Points

An hourly method tracing generation, flows, and embodied emissions to quantify carbon intensity across US balancing areas.

✅ Hourly traces of imports/exports and generation mix

✅ Consumption-based carbon intensity by balancing area

✅ Policy insights for renewables, coal, health costs


In the United States, electricity generation accounts for nearly 30% of our carbon emissions. Some states have responded to that by setting aggressive renewable energy standards; others are hoping to see coal propped up even as its economics get worse. Complicating matters further is the fact that many regional grids are integrated, and as America goes electric the stakes grow, meaning power generated in one location may be exported and used in a different state entirely.

Tracking these electricity exports is critical for understanding how to lower our national carbon emissions. In addition, power from a dirty source like coal has health and environment impacts where it's produced, and the costs of these aren't always paid by the parties using the electricity. Unfortunately, getting reliable figures on how electricity is produced and where it's used is challenging, even for consumers trying to find where their electricity comes from in the first place, leaving some of the best estimates with a time resolution of only a month.

Now, three Stanford researchers—Jacques A. de Chalendar, John Taggart, and Sally M. Benson—have greatly improved on that standard, and they have managed to track power generation and use on an hourly basis. The researchers found that, of the 66 grid balancing areas within the United States, only three have carbon emissions equivalent to our national average, and they have found that imports and exports of electricity have both seasonal and daily changes. de Chalendar et al. discovered that the net results can be substantial, with imported electricity increasing California's emissions/power by 20%.

Hour by hour
To figure out the US energy trading landscape, the researchers obtained 2016 data for grid features called balancing areas. The continental US has 66 of these, providing much better spatial resolution on the data than the larger grid subdivisions. This doesn't cover everything—several balancing areas in Canada and Mexico are tied in to the US grid—and some of these balancing areas are much larger than others. The PJM grid, serving Pennsylvania, New Jersey, and Maryland, for example, is more than twice as large as Texas' ERCOT, in a state that produces and consumes the most electricity in the US.

Despite these limitations, it's possible to get hourly figures on how much electricity was generated, what was used to produce it, and whether it was used locally or exported to another balancing area. Information on the generating sources allowed the researchers to attach an emissions figure to each unit of electricity produced. Coal, for example, produces double the emissions of natural gas, which in turn produces more than an order of magnitude more carbon dioxide than the manufacturing of solar, wind, or hydro facilities. These figures were turned into what the authors call "embodied emissions" that can be traced to where they're eventually used.

Similar figures were also generated for sulfur dioxide and nitrogen oxides. Released by the burning of fossil fuels, these can both influence the global climate and produce local health problems.

Huge variation
The results were striking. "The consumption-based carbon intensity of electricity varies by almost an order of magnitude across the different regions in the US electricity system," the authors conclude. The low is the Bonneville Power grid region, which is largely supplied by hydropower; it has typical emissions below 100kg of carbon dioxide per megawatt-hour. The highest emissions come in the Ohio Valley Electric region, where emissions clear 900kg/MW-hr. Only three regional grids match the overall grid emissions intensity, although that includes the very large PJM (where capacity auction payouts recently fell), ERCOT, and Southern Co balancing areas.

Most of the low-emissions power that's exported comes from the Pacific Northwest's abundant hydropower, while the Rocky Mountains area exports electricity with the highest associated emissions. That leads to some striking asymmetries. Local generation in the hydro-rich Idaho Power Company has embodied emissions of only 71kg/MW-hr, while its imports, coming primarily from Rocky Mountain states, have a carbon content of 625kg/MW-hr.

The reliance on hydropower also makes the asymmetry seasonal. Local generation is highest in the spring as snow melts, but imports become a larger source outside this time of year. As solar and wind can also have pronounced seasonal shifts, similar changes will likely be seen as these become larger contributors to many of these regional grids. Similar things occur daily, as both demand and solar production (and, to a lesser extent, wind) have distinct daily profiles.

The Golden State
California's CISO provides another instructive case. Imports represent less than 30% of its total electric use in 2016, yet California electricity imports provided 40% of its embodied emissions. Some of these, however, come internally from California, provided by the Los Angeles Department of Water and Power. The state itself, however, has only had limited tracking of imported emissions, lumping many of its sources as "other," and has been exporting its energy policies to Western states in ways that shape regional markets.

Overall, the 2016 inventory provides a narrow picture of the US grid, as plenty of trends are rapidly changing our country's emissions profile, including the rise of renewables and the widespread adoption of efficiency measures and other utility trends in 2017 that continue to evolve. The method developed here can, however, allow for annual updates, providing us with a much better picture of trends. That could be quite valuable to track things like how the rapid rise in solar power is altering the daily production of clean power.

More significantly, it provides a basis for more informed policymaking. States that wish to promote low-emissions power can use the information here to either alter the source of their imports or to encourage the sites where they're produced to adopt more renewable power. And those states that are exporting electricity produced primarily through fossil fuels could ensure that the locations where the power is used pay a price that includes the health costs of its production.


Related News

View more

Duke Energy installing high-tech meters for customers

Duke Energy Smart Meters enable remote meter reading, daily energy usage data, and two-way outage detection via AMI, with encrypted data, faster restoration, and remote connect/disconnect for Indiana customers in Howard County.


Key Points

Advanced meters that support remote readings, daily usage insights, two-way outage detection, and secure, encrypted data.

✅ Daily energy usage available online the next day

✅ Two-way communications speed outage detection and restoration

✅ Remote connect/disconnect; manual reads optional with opt-out fee


Say goodbye to your neighborhood meter reader. Say hello to your new smart meter.

Over the next three months, Duke Energy will install nearly 43,000 new high-tech electric meters for Howard County customers that will allow the utility company to remotely access meters via the digital grid instead of sending out employees to a homeowner's property for walk-by readings.

That means there's no need to estimate bills when meters can't be easily accessed, such as during severe weather or winter storms.

Other counties serviced by Duke Energy slated to receive the meters include Miami, Tipton, Cass and Carroll counties.

Angeline Protogere, Duke Energy's lead communication consultant, said besides saving the company money and manpower, the new smart meters come with a host of benefits for customers enabled by smart grid solutions today.

The meters are capable of capturing daily energy usage data, which is available online the next day. Having this information available on a daily basis can help customers make smarter energy decisions and support customer analytics that avoid billing surprises at the end of the month, she said.

"The real advantage is for the consumer, because they can track their energy usage and adjust their usage before the bills come," Protogere said.

When it comes to power outages, the meters are capable of two-way communications. That allows the company to know more about an outage through synchrophasor monitoring, which can help speed up restoration. However, customers will still need to notify Duke Energy if their power goes out.

If a customer is moving, they don't have to wait for a Duke Energy representative to come to the premises to connect or disconnect the energy service because requests can be performed remotely.

Protogere said when it comes to installing the meters, the changeover takes less than 5 minutes to complete. Customers should receive advance notices from the company, but the technician also will knock on the door to let the customer know they are there.

If no one is available and the meter is safely accessible, the technician will go ahead and change out the meter, Protogere said. There will be a momentary outage between the time the old meter is removed and the new meter is installed.

Kokomo and the surrounding areas are one of the last parts of the state to receive Duke Energy's new, high-tech meters, which are commonly used by other utility companies and in smart city initiatives across the U.S.

Protogere said statewide, the company started installing smart meters in August 2016 as utilities deploy digital transformer stations to modernize the grid. To date, they have installed 694,000 of the 854,000 they have planned for the state.

The company says the information stored and transmitted on the smart meters is safe, protected and confidential. Duke Energy said on its website that it does not share data with anyone without customers' authorization. The information coming from the meters is encrypted and protected from the moment it is collected until the moment it is purged, the company said.

Digital smart meter technology uses radio frequency bands that have been used for many years in devices such as baby monitors and medical monitors. The radio signals are far below the levels emitted by common household appliances and electronics, including cellphones and microwave ovens.

According to the World Health Organization, FCC, U.S. Food and Drug Administration and Electric Power Research Institute, no adverse health effects have been shown to occur from the radio frequency signals produced by smart meters or other such wireless networks.

However, customers can still opt-out of getting a smart meter and continue to have their meter manually read.

Those who choose not to get a smart meter must pay a $75 initial opt-out fee and an additional $17.50 monthly meter reading charge per account.

If smart meters have not yet been installed, Duke Energy will waive the $75 initial opt-out fee if customers notify the company they want to opt out within 21 days of receiving the installation postcard notice.


Related News

View more

OPG, TVA Partner on New Nuclear Technology Development

OPG-TVA SMR Partnership advances advanced nuclear technology and small modular reactors for 24/7 carbon-free baseload power, enabling net-zero goals, cross-border licensing, and deployment within a North American clean energy hub.


Key Points

A cross-border effort by OPG and TVA to develop, license, and deploy SMRs for reliable, carbon-free baseload power.

✅ Coordinates design, licensing, construction, and operations

✅ Supports 24/7 baseload, net-zero targets, and energy security

✅ Leverages Darlington and Clinch River early site permits


Two of North America's leading nuclear utilities unveiled a pioneering partnership to develop advanced nuclear technology as an integral part of a clean energy future and creating a North American energy hub. Ontario Power Generation, whose OPG's SMR commitment is well established, and the Tennessee Valley Authority will jointly work to help develop small modular reactors as an effective long-term source of 24/7 carbon-free energy in both Canada and the U.S.

The agreement allows the companies to coordinate their explorations into the design, licensing, construction and operation of small modular reactors.

"As leaders in our industry and nations, OPG and TVA share a common goal to decarbonize energy generation while maintaining reliability and low-cost service, which our customers expect and deserve," said Jeff Lyash, TVA President and CEO. "Advanced nuclear technology will not only help us meet our net-zero carbon targets but will also advance North American energy security."

"Nuclear energy has long been key to Ontario's clean electricity grid, and is a crucial part of our net-zero future," said Ken Hartwick, OPG President and CEO. "Working together, OPG and TVA will find efficiencies and share best practices for the long-term supply of the economical, carbon-free, reliable electricity our jurisdictions need, supported by ongoing Pickering life extensions across Ontario's fleet."

OPG and TVA have similar histories and missions. Both are based on public power models that developed from renewable hydroelectric generation before adding nuclear to their generation mixes. Today, nuclear generation accounts for significant portions of their carbon-free energy portfolios, with Ontario advancing the Pickering B refurbishment to sustain capacity.

Both are also actively exploring SMR technologies. OPG is moving forward with plans to deploy an SMR at its Darlington nuclear facility in Clarington, ON, as part of broader Darlington SMR plans now underway. The Darlington site is the only location in Canada licensed for new nuclear with a completed and accepted Environmental Assessment. TVA currently holds the only Nuclear Regulatory Commission Early Site Permit in the U.S. for small modular reactor deployment at its Clinch River site near Oak Ridge, TN.

No exchange of funding is involved. However, the collaboration agreement will help OPG and TVA reduce the financial risk that comes from development of innovative technology, as well as future deployment costs.

"TVA has the most recent experience completing a new nuclear plant in North America at Watts Bar and that knowledge is invaluable to us as we work toward the first SMR groundbreaking at Darlington," said Hartwick. "Likewise, because we are a little further along in our construction timing, TVA will gain the advantage of our experience before they start work at Clinch River."

"It's a win-win agreement that benefits all of those served by both OPG and TVA, as well as our nations," said Lyash. "Moving this technology forward is not only a significant step in advancing a clean energy future and Canada's climate goals, but also in creating a North American energy hub."

"With the demand for clean electricity on the rise around the world, Ontario's momentum is growing. The world is watching Ontario as we advance our work to fully unleash our nuclear advantage, alongside a premiers' SMR initiative that underscores provincial collaboration. I congratulate OPG and TVA – two great industry leaders – for working together to deploy SMRs and showcase and apply Canada's nuclear expertise that will deliver economic, health and environmental benefits for all of us to enjoy," said Todd Smith, Ontario Minister of Energy.

"The changing climate is a global crisis that requires global solutions. The partnership between the Tennessee Valley Authority and Ontario Power Generation to develop and deploy advanced nuclear technology is exactly the kind of innovative collaboration that is needed to quickly bring the next generation of nuclear carbon-free generation to market. I applaud the leadership that both companies are demonstrating to further strengthen our cross-border relationships," said Maria Korsnick, President and CEO, Nuclear Energy Institute.


Related News

View more

Sign Up for Electricity Forum’s Newsletter

Stay informed with our FREE Newsletter — get the latest news, breakthrough technologies, and expert insights, delivered straight to your inbox.

Electricity Today T&D Magazine Subscribe for FREE

Stay informed with the latest T&D policies and technologies.
  • Timely insights from industry experts
  • Practical solutions T&D engineers
  • Free access to every issue

Live Online & In-person Group Training

Advantages To Instructor-Led Training – Instructor-Led Course, Customized Training, Multiple Locations, Economical, CEU Credits, Course Discounts.

Request For Quotation

Whether you would prefer Live Online or In-Person instruction, our electrical training courses can be tailored to meet your company's specific requirements and delivered to your employees in one location or at various locations.