Texas PUC Appointments signal post-storm reform as Gov. Greg Abbott taps Peter Lake and advances Will McAdams for Senate confirmation, affecting ERCOT oversight, grid reliability, wholesale power pricing, and securitization for co-ops.
Key Points
Texas PUC appointments add Peter Lake and Will McAdams to steer ERCOT, grid reliability, and market policy.
✅ Peter Lake nominated chair to replace Arthur D'Andrea.
✅ Will McAdams advances toward Senate confirmation.
✅ Focus on ERCOT oversight, price cap debate, grid resilience.
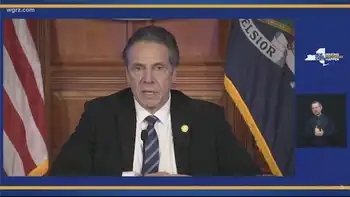
A new set of Texas electricity regulators began to take shape Monday, as Gov. Greg Abbott nominated a finance expert to be the next chairman of the Public Utility Commission while his earlier choice of a PUC member moved toward Senate confirmation.
The Republican governor put forward Peter Lake of Austin, who has spent more than five years as an Abbott appointee to the Texas Water Development Board, as his second commission pick in as many weeks.
“I am confident he will bring a fresh perspective and trustworthy leadership to the PUC,” Abbott said of Lake, who once worked as a trader of futures and derivatives for a firm belonging to the Chicago Mercantile Exchange and more recently has eagerly promoted bonds for the State Water Implementation Fund for Texas.
“Peter’s expertise in the Texas energy industry and business management will make him an asset to the agency,” Abbott, who has touted grid readiness in recent months, said in a written statement. “I urge the Senate to swiftly confirm Peter’s appointment.”
On Monday, the Senate appeared to be moving quickly to confirm Abbott’s April 1 selection for the PUC, Will McAdams, president of Associated Builders and Contractors of Texas and a former legislative aide who helped write policy for regulated industries such as electricity.
McAdams was among the 129 nominees that the Senate Nominations Committee voted out, 8-0. His nomination heads now to the Senate floor.
All three of Abbott’s handpicked PUC commissioners who were in place before and during February’s calamitous winter storm have since quit or said they’re resigning, even as Sierra Club criticism of Abbott's demands intensified in the aftermath.
February’s polar vortex left in its wake physical and financial wreckage after a nonprofit grid operator answering to the PUC, amid calls for market reforms to avoid blackouts, shut off electricity to more than 4 million Texans, causing the deaths of at least 125 people, 13 of them in the Dallas-Fort Worth area.
Gov. Greg Abbott on Thursday named Will McAdams to the embattled Public Utility Commission of Texas. McAdams is a construction industry lobbyist with strong ties to the GOP-controlled Legislature. In Feb. 17 file photo, winter storm's snowfall andn large electrical transmission lines in South Arlington are pictured.
In a 45-minute confirmation hearing, McAdams, as lawmakers discussed ways to improve electricity reliability statewide, drew praise – and few tough questions.
McAdams, who previously worked for three GOP senators, testified that had he been on the commission in February, he would not have kept in place a controversial, $9,000-per-megawatt hour price cap on wholesale power for about 32 hours on Feb. 18-19.
“I don’t see myself making that decision,” he said.
McAdams, though, hedged slightly, saying he’s not privy to all information that the Electric Reliability Council of Texas, or ERCOT, and the PUC may have had at their disposal during the crisis.
The comments were notable because Lt. Gov. Dan Patrick and the Senate have fought with Abbott and the House over $16 billion in overcharges that, according to an independent market monitor, wrongly accrued near the end of the Feb. 15-19 outages.
Sen. Charles Schwertner, R-Georgetown, said the commission’s former chairwoman, DeAnn Walker, and Bill Magness, president of ERCOT, decided to hold the high cap in place because there “was still great concern about grid stability, even though there was significant reserves.”
He pressed McAdams to call that incorrect, which McAdams did.
“Given the fact pattern that I’m privy to, senator,” it wasn’t the right move, he said. “But again, there may be other facts out there. There probably are.”
McAdams acknowledged many homeowners and businesses were traumatized.
“The public’s confidence in the ability of the PUC to effectively regulate our electric markets has been badly damaged and shaken,” he said.
McAdams spoke favorably of renewable energy, calling wind and solar “absolutely valuable resources,” as the electricity sector faces profound change nationwide. To whatever extent those are not available, the PUC should “firm that up” with “dispatchable forms of generation,” such as gas, coal and nuclear, McAdams said.
He also called for lawmakers to consider providing electricity market bailout through “securitization,” or low-interest bond financing, to rural electric co-ops that were unable to pay the massive wholesale power bills they racked up during the February crisis.
“It would prevent those systems from having to front-load those costs onto their own members and smooth that out over a term of years,” while preventing an “uplift” of costs to other market participants who wisely hedged against soaring prices, McAdams said.
Noting that more than 400 bills have been filed to change ERCOT and how it’s governed, and as Texans prepare to vote on grid modernization funding this year, McAdams told the Senate panel, “It is clear to me that the Legislature wants meaningful changes to the status quo – to ensure that something positive comes out of this tragedy.”
Lake, who if confirmed by the Senate would replace Arthur D’Andrea as PUC chairman, grew up in Tyler. He attended prep school in New England and earned an undergraduate degree from the University of Chicago and a master of business administration degree from Stanford University.
He then worked for a commodities trading firm, a behavioral health company and as a business consultant before he became director of business development for Tyler-based Lake Ronel Oil Co. in 2014.
In late 2015, Abbott named Lake to the Texas Water Development Board and in February 2018 picked him to be the chairman of the three-member board that seeks to ensure water supplies for a fast-growing state.
Lake has steered the water board as it rolled out additional loans for water projects, approved by the Legislature and voters in 2013, and took the lead after Hurricane Harvey on flood control planning and infrastructure financing.
He’s posted exuberantly on Twitter as he toured agricultural water installations, lakes in West Texas and river authorities.
If confirmed, Lake and McAdams each would make $189,500 a year.
Related News