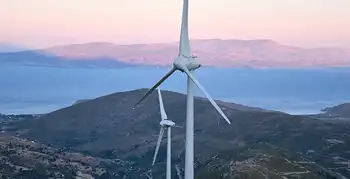
Geothermal power plant coming to Iron County

By Associated Press


Electrical Testing & Commissioning of Power Systems

Our customized live online or in‑person group training can be delivered to your staff at your location.

  • Live Online
  • 12 hours Instructor-led
  • Group Training Available
Regular Price:
$599
Coupon Price:
$499
Reserve Your Seat Today
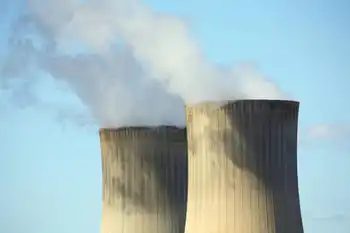
A geothermal power plant is coming to Iron County. The Iron County Commission has unanimously approved an ordinance to allow for the first plant of its kind in the county.

Raser Technologies is planning for the 10-megawatt plant to supply power to California by the end of 2009.

County officials estimate the plant will bring $13 million to the county over 20 years.

Related News

U.S. Electricity Sales Projections Continue to Fall

US Electricity Demand Outlook examines EIA forecasts, GDP decoupling, energy efficiency, electrification, electric vehicles, grid load growth, and weather variability to frame long term demand trends and utility planning scenarios.


Key Points

An analysis of EIA projections showing demand decoupling from GDP, with EV adoption and efficiency shaping future grid load.

✅ EIA lowers load growth; demand decouples from GDP.

✅ Efficiency and sector shifts depress kWh sales.

✅ EV adoption could revive load and capacity needs.


Electricity producers and distributors are in an unusual business. The product they provide is available to all customers instantaneously, literally at the flip of a switch. But the large amount of equipment, both hardware and software to do this takes years to design, site and install.

From a long range planning perspective, just as important as a good engineering design is an accurate sales projections. For the US electric utility industry the most authoritative electricity demand projec-tions come from the Department of Energy’s Energy Information Administration (EIA). EIA's compre-hensive reports combine econometric analysis with judgment calls on social and economic trends like the adoption rate of new technologies that could affect future electricity demand, things like LED light-ing and battery powered cars, and the rise of renewables overtaking coal in generation.

Before the Great Recession almost a decade ago, the EIA projected annual growth in US electricity production at roughly 1.5 percent per year. After the Great Recession began, the EIA lowered its projections of US electricity consumption growth to below 1 percent. Actual growth has been closer to zero. While the EIA did not antici-pate the last recession or its aftermath, we cannot fault them on that.

After the event, though, the EIA also trimmed its estimates of economic growth. For the 2015-2030 period it now predicts 2.1 percent economic and 0.3 percent electricity growth, down from previously projections of 2.7 percent and 1.3 percent respectively. (See Figures 1 and 2.)


Table 1. EIA electric generation projections by year of forecast (kWh billions)


Table 2. EIA forecast of GDP by year of forecast (billion 2009 $)

Back in 2007, the EIA figured that every one percent increase in economic activity required a 0.48 percent in-crease in electric generation to support it. By 2017, the EIA calculated that a 1 percent growth in economic activity now only required a 0.14 percent increase in electric output. What accounts for such a downgrade or disconnect between electricity usage and economic growth? And what factors might turn the numbers 
around?

First, the US economy lost energy intensive heavy industry like smelting, steel mills and refineries; patterns in China's electricity sector highlight how industrial shifts can reshape power demand. A more service oriented economy (think health care) relies more heavily on the movement of data or information and uses far less power than a manufacturing-oriented economy.

A small volcano in Argentina is about to fuel the next tech boom – and a little known company is going to be right at the center. Early investors stand to gain incredible profits and you can too. Read the report.

Second, internet shopping has hurt so-called "brick and mortar" retailers. Despite the departure of heavy industry, in years past a burgeoning US commercial sector increased its demand and usage of electricity to offset the industrial decline. But not anymore. Energy efficiency measures as well as per-haps greater concern about global warming and greenhouse gas emissions and have cut into electricity sales. “Do more with less” has the right ring to it.

But there may be other components to the ongoing decline in electricity usage. Academic studies show that electricity usage seems to increase with income along an S curve, and flattens out after a certain income level. That is, if you earn $1 billion per year you do not (or cannot) use ten times a much electricity as someone earning only $100 million.

But people at typical, middle income levels increase or decrease electricity usage when incomes rise or fall. The squeeze on middle income families was discussed often in the late presidential campaign. In recent decades an increasing percentage of income has gone to a small percentage of the population at the top of the income scale. This trend probably accounts for some weakness in residential sales. This suggests that government policy addressing income inequality would also boost electricity sales.

Population growth affects demand for electricity as well as the economy as a whole. The EIA has made few changes in its projections, showing 0.7 percent per year population growth in 2015- 2030 in both the 2007 and 2017 forecasts. Recent studies, however, have shown a drop in the birth rate to record lows. More troubling, from a national health perspective is that the average age of death may have stopped rising. Those two factors point to lower population growth, especially if the government also restricts immi-gration. Thus, the US may be approaching a period of rather modest population growth.

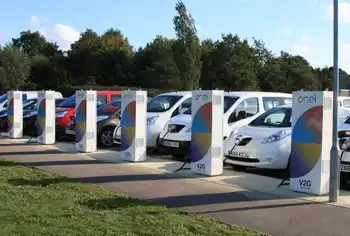
All of the above factors point to minimal sales growth for electricity producers in the US--perhaps even lower than the seemingly conservative EIA estimates. But the cloud on the horizon has a silver lining in the shape of an electric car. Both the United Kingdom and France have set dates to end of production of automobiles with internal combustion engines. Several European car makers have declared that 20 percent of their output will be electric vehicles by the early 2020s. If we adopt automobiles powered by electricity and not gasoline or diesel, electricity sales would increase by one third. For the power indus-try, electric vehicles represent the next big thing.

We don’t pretend to know how electric car sales will progress. But assume vehicle turnover rates re-main at the current 7 percent per year and electric cars account for 5 percent of sales in the first five years (as op-posed to 1 percent now), 20 percent in the next five years and 50 percent in the third five year period. Wildly optimistic assumptions? Maybe. By 2030, electric cars would constitute 28 percent of the vehicle fleet. They would add about 10 percent to kilowatt hour sales by that date, assuming that battery efficiencies do not improved by then. Those added sales would require increased electric generation output, with low-emissions sources expected to cover almost all the growth globally. They would also raise long term growth rates for 2015-2030 from the present 0.3 percent to 1.0 percent. The slow upturn in demand should give the electric companies time to gear up so to speak.

In the meantime, weather will continue to play a big role in electricity consumption. Record heat-induced demand peaks are being set here in the US even as surging global demand puts power systems under strain worldwide.

Can we discern a pattern in weather conditions 15 years out? Maybe we can, but that is one topic we don’t expect a government agency to tackle in public right now. Meantime, weather will affect sales more than anything else and we cannot predict the weather. Or can we?


Related News

View more

Germany launches second wind-solar tender

Germany's Joint Onshore Wind and Solar Tender invites 200 MW bids in an EEG auction, with PV and onshore wind competing on price per MWh, including grid integration costs and network fees under BNA rules.


Key Points

A BNA-run 200 MW EEG auction where PV and onshore wind compete on price per MWh, including grid integration costs.

✅ 200 MW cap; minimum project size 750 kW

✅ Max subsidy 87.50 per MWh; bids include network costs

✅ Solar capped at 10-20 MW; wind requires prior approval


Germany's Federal Network Agency (BNA) has launched its second joint onshore wind and solar photovoltaic (PV) tender, with a total capacity of 200 MW.

A maximum guaranteed subsidy payment has been set at 87.50 per MWh for both energy sources, which BNA says will have to compete against each other for the lowest price of electricity. According to auction rules, all projects must have a minimum of 750 kW.

The auction is due to be completed on 2 November.

The network regulator has capped solar projects at 10 MW, though this has been extended to 20 MW in some districts, amid calls to remove barriers to PV at the federal level. Onshore wind projects did not receive any such restrictions, though they require approval from Federal Immission Control three weeks prior to the bid date of 11 Octobe

Bids also require network and system integration costs to be included, and similar solicitations have been heavily subscribed, as an over-subscribed Duke Energy solar solicitation in the US market illustrates.

According to Germanys Renewable Energy Act (EEG), two joint onshore wind and solar auctions must take place each year between 2018 and 2021. After this, the government will review the scheme and decide whether to continue it beyond 2021.

The first tender, conducted in April, saw the entire 200 MW capacity given to solar PV projects, reflecting a broader solar power boost in Germany during the energy crisis. Of the 32 contracts awarded, value varied from 39.60 per MWh to 57.60 per MWh. Among the winning bids were five projects in agricultural and grassland sites in Bavaria, totalling 31 MW, and three in Baden-Wrttemberg at 17 MW.

According to the Agency, the joint tender scheme was initiated in an attempt to determine the financial support requirements for wind and solar in technology-specific auctions, however, solar powers sole win in the April auction meant it was met with criticism, even as clean energy accounts for 50% of Germany's electricity today.

The heads of the Federal Solar Industry Association (BSW-Solar) and German Wind Energy Association (BWE) saying the joint tender scheme is unsuitable for the build-out of the two technologies.

A BWE spokesman previously stressed the companys rejection of competition between wind and solar, saying: It is not clear how this could contribute to an economically meaningful balanced energy mix,

Technologies that are in various stages of development must not enter into direct competition with each other. Otherwise, innovation and development potential will be compromised.

Similarly, BSW-Solar president Carsten Krnig said: We are happy for the many solar winners, but consider the experiment a failure. The auction results prove the excellent price-performance ratio of new solar power plants, as solar-plus-storage is cheaper than conventional power in Germany, but not the suitability of joint tenders.


Related News

View more

India's Solar Growth Slows with Surge in Coal Generation

India Solar Slowdown and Coal Surge highlights policy uncertainty, grid stability concerns, financing gaps, and land acquisition issues affecting renewable energy, emissions targets, energy security, storage deployment, and tendering delays across the solar value chain.


Key Points

Analysis of slowed solar growth and rising coal in India, examining policy, grid, finance, and emissions tradeoffs.

✅ Policy uncertainty and tender delays stall solar pipelines

✅ Grid bottlenecks, storage gaps, and curtailment risks persist

✅ Financing strains and DISCOM payment delays dampen investment


India, a global leader in renewable energy adoption where renewables surpassed coal in capacity recently, faces a pivotal moment as the growth of solar power output decelerates while coal generation sees an unexpected surge. This article examines the factors contributing to this shift, its implications for India's energy transition, and the challenges and opportunities it presents.

India's Renewable Energy Ambitions

India has set ambitious targets to expand its renewable energy capacity, including a goal to achieve 175 gigawatts (GW) of renewable energy by 2022, with a significant portion from solar power. Solar energy has been a focal point of India's renewable energy strategy, as documented in on-grid solar development studies, driven by falling costs, technological advancements, and environmental imperatives to reduce greenhouse gas emissions.

Factors Contributing to Slowdown in Solar Power Growth

Despite initial momentum, India's solar power growth has encountered several challenges that have contributed to a slowdown. These include policy uncertainties, regulatory hurdles, land acquisition issues, and financial constraints affecting project development and implementation, even as China's solar PV growth surged in recent years. Delays in tendering processes, grid connectivity issues, and payment delays from utilities have also hindered the expansion of solar capacity.

Surge in Coal Generation

Concurrently, India has witnessed an unexpected increase in coal generation in recent years. Coal continues to dominate India's energy mix, accounting for a significant portion of electricity generation due to its reliability, affordability, and existing infrastructure, even as wind and solar surpassed coal in the U.S. in recent periods. The surge in coal generation reflects the challenges in scaling up renewable energy quickly enough to meet growing energy demand and address grid stability concerns.

Implications for India's Energy Transition

The slowdown in solar power growth and the rise in coal generation pose significant implications for India's energy transition and climate goals. While renewable energy remains central to India's long-term energy strategy, and as global renewables top 30% of electricity generation worldwide, the persistence of coal-fired power plants complicates efforts to reduce carbon emissions and mitigate climate change impacts. Balancing economic development, energy security, and environmental sustainability remains a complex challenge for policymakers.

Challenges and Opportunities

Addressing the challenges facing India's solar sector requires concerted efforts to streamline regulatory processes, improve grid infrastructure, and enhance financial mechanisms to attract investment. Encouraging greater private sector participation, promoting technology innovation, and expanding renewable energy storage capacity are essential to overcoming barriers and accelerating solar power deployment, as wind and solar have doubled their global share in recent years, demonstrating the pace possible.

Policy and Regulatory Framework

India's government plays a crucial role in fostering a conducive policy and regulatory framework to support renewable energy growth and phase out coal dependence, particularly as renewable power is set to shatter records worldwide. This includes implementing renewable energy targets, providing incentives for solar and other clean energy technologies, and addressing systemic barriers that hinder renewable energy adoption.

Path Forward

To accelerate India's energy transition and achieve its renewable energy targets, stakeholders must prioritize integrated energy planning, grid modernization, and sustainable development practices. Investing in renewable energy infrastructure, promoting energy efficiency measures, and fostering international collaboration on technology transfer and capacity building are key to unlocking India's renewable energy potential.

Conclusion

India stands at a crossroads in its energy transition journey, balancing the need to expand renewable energy capacity while managing the challenges associated with coal dependence. By addressing regulatory barriers, enhancing grid reliability, and promoting sustainable energy practices, India can navigate towards a more diversified and resilient energy future. Embracing innovation, strengthening policy frameworks, and fostering public-private partnerships will be essential in realizing India's vision of a cleaner, more sustainable energy landscape for generations to come.


Related News

View more

A resilient Germany is weathering the energy crunch

German Energy Price Brakes harness price signals in a market-based policy, cutting gas consumption, preserving industrial output, and supporting CO2 reduction, showcasing Germany's resilience and adaptation while protecting households and businesses across Europe.


Key Points

Fixed-amount subsidies preserving price signals to curb gas use, shield consumers, and sustain industrial output.

✅ Maintains incentives via market-based price signals

✅ Cuts gas consumption without distorting EU markets

✅ Protects households and industry while curbing CO2


German industry and society are once again proving much more resilient and adaptable than certain people feared. Horror scenarios of a dangerous energy rationing or a massive slump in our economy have often been bandied about. But we are nowhere near that. With a challenging year just behind us, this is good news — not only for Germany, but also for Europe, where France-Germany energy cooperation has strengthened solidarity.

Companies and households reacted swiftly to the sharp increases in energy prices, in line with momentum in the global energy transition seen across markets. They installed more efficient heating or production facilities, switched to alternatives and imported intermediate products. The results are encouraging: German households and businesses have reduced gas consumption significantly, despite recent cold weather. From the start of the war in Ukraine to mid-December industrial gas consumption in Germany was (temperature-adjusted) around 20 per cent lower than the average level for the preceding three years. Even if some firms have cut back production, especially in energy-intensive sectors, industrial output as a whole has only fallen by about 1 per cent since the start of 2022. Added to this, in a survey released by the Ifo institute in November, over a third of German companies saw the potential to reduce gas consumption further without endangering output.

Instead of imposing excessive laws and regulations, we have relied on price signals and the prudence of market participants to create the right incentives and reduce gas consumption, as falling costs like record-low solar power prices continue to reinforce those signals across sectors.

We will follow this approach in coming months, when energy savings will remain important, even as the EU electricity outlook anticipates sharply higher demand by 2050. Our latest relief measures will not distort price signals. To this end, the Bundestag approved gas and electricity price brakes in its final session in 2022. They are designed to function without any intervention in markets or prices. This system will pay out a fixed amount relative to previous years’ consumption and the current difference to a reference price — regardless of current consumption.

Energy price brakes are the main component of Germany’s “protective shield”, which makes up to €200bn available for measures in 2022 to 2024. Seen in relation to the German economy’s size, its past heavy reliance on Russian energy imports and the fact that the measures will expire in 2024, these are balanced and expedient mechanisms. In contrast to instruments used in other countries, our new arrangements will not affect the price formation process driven by supply and demand, or on incentives to save gas. Companies and households will continue to save the full market price when they reduce consumption by a unit of gas or electricity. In this way, the price brakes also avoid the creation of additional demand for gas at the expense of consumers in other European countries, even as Europe’s Big Oil turning electric signals broader structural shifts in energy markets. No one need fear that competition will be distorted or that gas will be bought up. Indeed, a recent IMF working paper on cushioning the impact of high energy prices on households explicitly praises the German energy price brakes.

Current developments confirm the effectiveness of a market-based approach — and show that we should also rely on price signals when it comes to reducing CO₂ emissions, as suggested by IEA CO2 trends in recent years. Last year, households and companies had only a few weeks to adapt, yet we have already seen a strong response. The effect of CO₂ prices can be even stronger, as adaptation is possible over a much longer time and they additionally affect expectations and long-term decisions. Regulatory interventions and subsidy schemes, even if well targeted, cannot compete with market co-ordination and incentives that support individual decision-making and promote innovation.

Europe and Germany can weather this crisis without a collapse in industrial production. We also have an opportunity to deal efficiently with the move to climate neutrality, aligned with Germany’s hydrogen strategy for imported low-carbon fuels. In both cases, we should have confidence in price signals as well as in the power of people and business to innovate and adapt.


Related News

View more

During this Pandemic, Save Money - How To Better Understand Your Electricity Bill

Commercial Electric Tariffs explain utility rate structures, peak demand charges, kWh vs kW pricing, time-of-use periods, voltage, delivery, capacity ratchets, and riders, guiding facility managers in tariff analysis for accurate energy savings.


Key Points

Commercial electric tariffs define utility pricing for energy, demand, delivery, time-of-use periods, riders, and ratchet charges.

✅ Separate kWh charges from kW peak demand fees.

✅ Verify time-of-use windows and demand interval length.

✅ Review riders, capacity ratchets, and minimum demand clauses.


Especially during these tough economic times, as major changes to electric bills are debated in some states, facility executives who don’t understand how their power is priced have been disappointed when their energy projects failed to produce expected dollar savings. Here’s how not to be one of them.

Your electric rate is spelled out in a document called a “tariff” that can be downloaded from your utility’s web page. A tariff should clearly spell out the costs for each component that is part of your rate, reflecting cost allocation practices in your region. Don’t be surprised to learn that it contains a bunch of them. Unlike residential electric rates, commercial electric bills are not based solely on the quantity of kilowatt-hours (kWh) consumed in a billing period (in the United States, that’s a month). Instead, different rates may apply to how your power is supplied, how it is delivered via electricity delivery charges, when it was consumed, its voltage, how fast it was used (in kW), and other factors.

If a tariff’s lingo and word structure are too opaque, spend some time with a utility account rep to translate it. Many state utility commissions also have customer advocates that may assist as they explore new utility rate designs that affect customers. Alternatively, for a fee, facility managers can privately chat with an energy consultant.

Common mistakes

Many facility managers try to estimate savings based on an averaged electric rate, i.e., annual electric spend divided by annual kWh. However, in markets where electricity demand is flat, such a number may obscure the fastest rising cost component: monthly peak demand charges, measured in dollars per kW (or kilo-volt-amperes, kVA).

This charge is like a monthly speeding ticket, based solely on the highest speed you drove during that time. In some areas, peak demand charges now account for 30 to 60 percent of a facility’s annual electric spend. When projecting energy cost savings, failing to separately account for kW peak demand and kWh consumption may result in erroneous results, and a lot of questions from the C-suite.

How peak demand charges are calculated varies among utilities. Some base it on the highest average speed of use across one hour in a month, while others may use the highest average speed during a 15- or 30-minute period. Others may average several of the highest speeds within a defined time period (for example, 8 a.m. to 6 p.m. on weekdays). It is whatever your tariff says it is.

Because some power-consuming (or producing) devices, including those tied to smart home electricity networks, vary in their operation or abilities, they may save money on a few — but not all — of those rate components. If an equipment vendor calculates savings from its product by using an average electric rate, take pause. Tell the vendor to return after the proposal has been redone using tariff-based numbers.

When a vendor is the only person calculating potential savings from using a product, there’s also a built-in conflict of interest: The person profiting from an equipment sale should not also be the one calculating its expected financial return. Before signing any energy project contracts, it’s essential that someone independent of the deal reviews projected savings. That person (typically an energy or engineering consultant) should be quite familiar with your facility’s electric tariff, including any special provisions, riders, discounts, etc., that may pertain. When this doesn’t happen, savings often don’t occur as planned. 

For example, some utilities add another form of demand charge, based on the highest kW in a year. It has various names: capacity, contract demand, or the generic term “ratchet charge.” Some utilities also have a minimum ratchet charge which may be based on a percent of a facility’s annual kW peak. It ensures collection of sufficient utility revenue to cover the cost of installed transmission and distribution even when a customer significantly cuts its peak demand.


Related News

View more

Website Providing Electricity Purchase Options Offered Fewer Choices For Spanish-speakers

Texas PUC Spanish Power to Choose mandates bilingual parity in deregulated electricity markets, ensuring equal access to plans, transparent pricing, consumer protection, and provider listings for Spanish speakers, mirroring the English site offerings statewide.


Key Points

PUC mandate requiring identical Spanish and English plan listings for fair access in the deregulated power market.

✅ Orders parity across English and Spanish plan listings

✅ Increases transparency in a deregulated electricity market

✅ Deadline set for providers to post on both sites


The state’s Public Utility Commission has ordered that the Spanish-language version of the Power to Choose website provide the same options available on the English version of the site, a move that comes as shopping for electricity is getting cheaper statewide.

Texas is one of a handful of states with a deregulated electricity market, with ongoing market reforms under consideration to avoid blackouts. The idea is to give consumers the option to pick power plans that they think best fit their needs. Customers can find available plans on the state’s Power To Choose website, or its Spanish-language counterpart, Poder de Escoger. In theory, those two sites should have the exact same offerings, so no one is disadvantaged. But the Texas Public Utility Commission found that wasn’t the case.

Houston Chronicle business reporter Lynn Sixel has been covering this story. She says the Power to Choose website is important for consumers facing the difficult task of choosing an electric provider in a deregulated state, where electricity complaints have recently reached a three-year high for Texans.

“There are about 57 providers listed on the [English] Power to Choose website, and news about retailers like Griddy underscores how varied the offerings can be across providers. [Last week] there were only 23 plans on the Spanish Power to Choose site,” Sixel says. “If you speak Spanish and you’re looking for a low-cost plan, as of last week, it would have been difficult to find some of the really great offers.”

Mustafa Tameez, managing director of Outreach Strategists, a Houston firm that consults with companies and nonprofits on diversity, described this issue as a type of redlining.

“He’s referring to a practice that banks would use to circle areas on maps in which the bank decided they did not want to lend money or would charge higher rates,” Sixel says. “Typically it was poor minority neighborhoods. Those folks would not get the same great deals that their Anglo neighbors would get.”

DeAnn Walker, chairman of the Public Utility Commission, said she was not at all happy about the plans listings in a meeting Friday, against a backdrop where Texas utilities have recently backed out of a plan to create smart home electricity networks.

“She gave a deadline of 8 a.m. Monday morning for any providers who wanted to put their plans on the Power to Choose website, must put them on both the Spanish language and the English language versions,” Sixel says. “All the folks that I talked to really had no idea that there were different plans on both sites and I think that there was sort of an assumption.”


Related News

View more

Sign Up for Electricity Forum’s Newsletter

Stay informed with our FREE Newsletter — get the latest news, breakthrough technologies, and expert insights, delivered straight to your inbox.

Electricity Today T&D Magazine Subscribe for FREE

Stay informed with the latest T&D policies and technologies.
  • Timely insights from industry experts
  • Practical solutions T&D engineers
  • Free access to every issue

Download the 2025 Electrical Training Catalog

Explore 50+ live, expert-led electrical training courses –

  • Interactive
  • Flexible
  • CEU-cerified