WPL to reduce carbon footprint

By PR Newswire


Substation Relay Protection Training

Our customized live online or in‑person group training can be delivered to your staff at your location.

  • Live Online
  • 12 hours Instructor-led
  • Group Training Available
Regular Price:
$699
Coupon Price:
$599
Reserve Your Seat Today
Wisconsin Power and Light Company (WPL), a subsidiary of Alliant Energy Corporation, proposed to reduce its generation fleet's greenhouse gas emissions by retiring a coal-fired generating unit, dramatically increasing its wind power portfolio, doubling its commitment to utilizing biomass, and aggressively building upon its energy efficiency measures, when its proposed expansion at the Nelson Dewey Generating Station becomes operable in 2013.

The proposed changes to WPL's generation fleet will be filed with the Public Service Commission of Wisconsin (PSCW) as part of WPL's testimony filing related to the proposed expansion of the Nelson Dewey Generating Station, in Cassville, Wisconsin, and are subject to the approval of the PSCW. The details of the proposal are included in WPL's testimony, being filed with the PSCW.

"Alliant Energy is committed to reducing greenhouse gas emissions, in Wisconsin and throughout our service territory," states Barbara Swan, President-WPL. "We believe our proposal addresses the critical balance of meeting important environmental objectives with the equally important goal of providing reliable and affordable power to our customers."

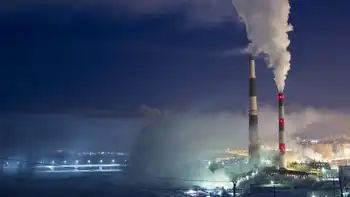
As part of its greenhouse gas emissions reduction proposal, WPL would retire Edgewater Generating Station's coal-fired unit 3. The facility is the oldest coal plant in WPL's generation fleet. The company would also increase its commitment to develop new wind power resources.

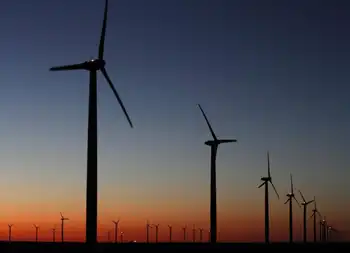
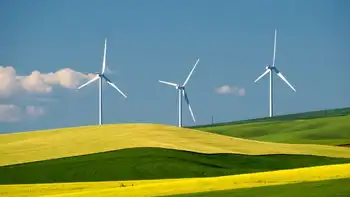
Previously the company had announced plans for approximately 300 megawatts of new wind by the end of 2010. Upon approval of the Nelson Dewey expansion, the company would add 200 megawatts to that total by the time the new facility begins commercial operation. While the sites for the future wind farms have not yet been determined, it is possible that one of the sites could be located in southwestern Wisconsin.

WPL would also double the amount of renewable resource fuels to be used at the new third unit of Nelson Dewey, to twenty percent. As a result of utilizing fuels such as switch grass, waste wood, or corn stalks, not only are CO2 emissions reduced by offsetting the use of coal at the facility, but Wisconsin farmers and foresters will have access to new economic markets, an ecologically friendly crop and better land and forest management practices.

Analysis by researchers from the University of Wisconsin has shown that the 20 percent biomass at Nelson Dewey unit 3 could create economic development revenues for the State of Wisconsin to exceed an estimated $50 million annually.

This proposal, along with a fifty percent increase in WPL energy efficiency savings, is projected to more than offset the carbon emissions from the new Nelson Dewey unit. The potential increased capital costs associated with these changes in WPL's generation fleet are expected to be $500-$550 million, and are contingent upon the company receiving all applicable regulatory approvals related to the expansion of the Nelson Dewey Generating Station.

"We spend a lot of time reaching out to our customers, listening to what they want and what they can afford," adds Swan. "Their two main concerns: protecting the environment while at the same time keeping the cost of electricity affordable. These are challenges we embrace as we head down a path to a greener future."

Related News

Can Europe's atomic reactors bridge the gap to an emissions-free future?

EU Nuclear Reactor Life Extension focuses on energy security, carbon-free electricity, and safety as ageing reactors face gas shortages, high power prices, and regulatory approvals across the UK and EU amid winter supply risks.


Key Points

EU Nuclear Reactor Life Extension is the policy to keep ageing reactors safely generating affordable, low-carbon power.

✅ Extends reactor operation via inspections and component upgrades

✅ Addresses gas shortages, price volatility, and winter supply risks

✅ Requires national regulator approval and cost-benefit analysis


Shaken by the loss of Russian natural gas since the invasion of Ukraine, European countries are questioning whether they can extend the lives of their ageing nuclear reactors to maintain the supply of affordable, carbon-free electricity needed for net-zero across the bloc — but national regulators, companies and governments disagree on how long the atomic plants can be safely kept running.

Europe avoided large-scale blackouts last winter despite losing its largest supplier of natural gas, and as Germany temporarily extended nuclear operations to bolster stability, but industry is still grappling with high electricity prices and concerns about supply.

Given warnings from the International Energy Agency that the coming winters will be particularly at risk from a global gas shortage, governments have turned their attention to another major energy source — even as some officials argue nuclear would do little to solve the gas issue in the near term — that would exacerbate the problem if it too is disrupted: Europe’s ageing fleet of nuclear power plants.

Nuclear accounts for nearly 10% of energy consumed in the European Union, with transport, industry, heating and cooling traditionally relying on coal, oil and natural gas.

Historically nuclear has provided about a quarter of EU electricity and 15% of British power, even as Germany shut down its last three nuclear plants recently, underscoring diverging national paths.

Taken together, the UK and EU have 109 nuclear reactors running, even as Europe is losing nuclear power in several markets, most of which were built in the 1970s and 1980s and were commissioned to last about 30 years.

That means 95 of those reactors — nearly 90% of the fleet — have passed or are nearing the end of their original lifespan, igniting debates over how long they can safely continue to be granted operating extensions, with some arguing it remains a needed nuclear option for climate goals despite age-related concerns.

Regulations differ across borders, with some countries such as Germany turning its back on nuclear despite an ongoing energy crisis, but life extension discussions are usually a once-a-decade affair involving physical inspections, cost/benefit estimates for replacing major worn-out parts, legislative amendments, and approval from the national nuclear safety authority.


Related News

View more

During this Pandemic, Save Money - How To Better Understand Your Electricity Bill

Commercial Electric Tariffs explain utility rate structures, peak demand charges, kWh vs kW pricing, time-of-use periods, voltage, delivery, capacity ratchets, and riders, guiding facility managers in tariff analysis for accurate energy savings.


Key Points

Commercial electric tariffs define utility pricing for energy, demand, delivery, time-of-use periods, riders, and ratchet charges.

✅ Separate kWh charges from kW peak demand fees.

✅ Verify time-of-use windows and demand interval length.

✅ Review riders, capacity ratchets, and minimum demand clauses.


Especially during these tough economic times, as major changes to electric bills are debated in some states, facility executives who don’t understand how their power is priced have been disappointed when their energy projects failed to produce expected dollar savings. Here’s how not to be one of them.

Your electric rate is spelled out in a document called a “tariff” that can be downloaded from your utility’s web page. A tariff should clearly spell out the costs for each component that is part of your rate, reflecting cost allocation practices in your region. Don’t be surprised to learn that it contains a bunch of them. Unlike residential electric rates, commercial electric bills are not based solely on the quantity of kilowatt-hours (kWh) consumed in a billing period (in the United States, that’s a month). Instead, different rates may apply to how your power is supplied, how it is delivered via electricity delivery charges, when it was consumed, its voltage, how fast it was used (in kW), and other factors.

If a tariff’s lingo and word structure are too opaque, spend some time with a utility account rep to translate it. Many state utility commissions also have customer advocates that may assist as they explore new utility rate designs that affect customers. Alternatively, for a fee, facility managers can privately chat with an energy consultant.

Common mistakes

Many facility managers try to estimate savings based on an averaged electric rate, i.e., annual electric spend divided by annual kWh. However, in markets where electricity demand is flat, such a number may obscure the fastest rising cost component: monthly peak demand charges, measured in dollars per kW (or kilo-volt-amperes, kVA).

This charge is like a monthly speeding ticket, based solely on the highest speed you drove during that time. In some areas, peak demand charges now account for 30 to 60 percent of a facility’s annual electric spend. When projecting energy cost savings, failing to separately account for kW peak demand and kWh consumption may result in erroneous results, and a lot of questions from the C-suite.

How peak demand charges are calculated varies among utilities. Some base it on the highest average speed of use across one hour in a month, while others may use the highest average speed during a 15- or 30-minute period. Others may average several of the highest speeds within a defined time period (for example, 8 a.m. to 6 p.m. on weekdays). It is whatever your tariff says it is.

Because some power-consuming (or producing) devices, including those tied to smart home electricity networks, vary in their operation or abilities, they may save money on a few — but not all — of those rate components. If an equipment vendor calculates savings from its product by using an average electric rate, take pause. Tell the vendor to return after the proposal has been redone using tariff-based numbers.

When a vendor is the only person calculating potential savings from using a product, there’s also a built-in conflict of interest: The person profiting from an equipment sale should not also be the one calculating its expected financial return. Before signing any energy project contracts, it’s essential that someone independent of the deal reviews projected savings. That person (typically an energy or engineering consultant) should be quite familiar with your facility’s electric tariff, including any special provisions, riders, discounts, etc., that may pertain. When this doesn’t happen, savings often don’t occur as planned. 

For example, some utilities add another form of demand charge, based on the highest kW in a year. It has various names: capacity, contract demand, or the generic term “ratchet charge.” Some utilities also have a minimum ratchet charge which may be based on a percent of a facility’s annual kW peak. It ensures collection of sufficient utility revenue to cover the cost of installed transmission and distribution even when a customer significantly cuts its peak demand.


Related News

View more

Nevada on track to reach RPS mandate of 50% renewable electricity by 2030: report

Nevada Renewable Portfolio Standard 2030 targets 50% clean energy, advancing solar, geothermal, and wind, cutting GHG emissions, phasing out coal, and expanding storage, EV infrastructure, and in-state renewables under PUCN oversight and tax abatements.


Key Points

A state mandate requiring 50% of electricity from renewables by 2030, driving solar, geothermal, wind, and storage.

✅ 50% clean power by 2030; 100% carbon-free target by 2050

✅ Growth in solar, geothermal, wind; coal phase-out; natural gas remains

✅ RETA incentives spur 6.1 GW capacity, jobs, and in-state investment


Nevada is on track to meet its Renewable Portfolio Standard of 50% of electricity generated by renewable energy sources by 2030, according to the Governor's Office of Energy's annual Status of Energy Report.

Based on compliance reports the Public Utilities Commission of Nevada has received, across all providers, about 20% of power is currently generated by renewable resources, and, nationally, renewables ranked second in 2020 as filings show Nevada's investor-owned utility and other power providers have plans to reach the state's ambitious RPS of 50% by 2030, according to the report released Jan. 28.

"Because transportation and electricity generation are Nevada's two largest contributors to greenhouse gas emissions, GOE's program work in 2021 underscored our focus on transportation electrification and reaching the state's legislatively required renewable portfolio standard," GOE Director David Bobzien said in a statement Jan. 28. "While electricity generated from renewable resources currently accounts for about 25% of the state's electricity, a share similar to projections that renewables will soon provide about one-fourth of U.S. electricity overall, we continue to collaborate with the Public Utilities Commission of Nevada, electricity providers, the renewable energy industry and conservation organizations to ensure Nevada reaches our target of 50% clean energy by 2030."

The state's RPS, enacted in 1997 and last modified in 2019, requires an increase in renewable energy, starting with 22% in 2020 and increasing to 50% by 2030. The increase in renewables will reduce GHG emissions and help the state reach its goal of 100% carbon-free power by 2050, while states like Rhode Island have a 100% by 2030 plan, highlighting varying timelines.

Renewable additions
The state added 1.332 GW of renewable capacity in 2021 as part of the Renewable Energy Tax Abatement program, at a time when U.S. renewable energy hit a record 28% in April, for a total renewable capacity of 6.117 GW, according to the report.

The RETA program awards partial sales and use tax and partial property-tax abatements to eligible renewable energy facilities, which increase Nevada's tax revenue and create jobs in a growing industry. Eligible projects must employ at least 50% Nevada workers, pay 175% of Nevada's average wage during construction, and offer health care benefits to workers and their dependents.

Since its adoption in 2010, the GOE has approved 60 projects, including large-scale solar PV, solar thermal, biomass, geothermal and wind projects throughout the state, according to the report. Projects granted abatements in 2021 include:

  • 100-MW Citadel Solar Project
  • 150-MW Dry Lake Solar + Storage Project
  • 714-MW Gemini Solar Project
  • 55-MW North Valley Power Geothermal Project
  • 113-MW Boulder Flats Solar Project
  • 200-MW Arrow Canyon Solar Project

"Nevada does not produce fossil fuels of any significant amount, and gasoline, jet fuel and natural gas for electricity or direct use must be imported," according to the report. "Transitioning to domestically produced renewable resources and electrified transportation can provide cost savings to Nevada residents and businesses, as seen in Idaho's largely renewable mix today, while reducing GHG emissions. About 86% of the fuel for energy that Nevada consumes comes from outside the state."

Phasing out coal plants
Currently, more than two-thirds of the state's electricity is produced by natural gas-fired power plants, with renewables covering most of the remaining generation, according to the report. Nevada continues to phase out its remaining coal power plants, as renewables surpassed coal nationwide in 2022, which provide less than 10% of produced electricity.

"Nevada has seen a significant increase in capturing its abundant renewable energy resources such as solar and geothermal," according to the report. "Renewable energy production continues to grow, powering Nevada homes and business and serves to diversify the state's economy by exporting solar and geothermal to neighboring states, as California neared 100% renewable electricity for the first time. Nevada has more than tripled its renewable energy production since 2011."


Related News

View more

Wind and Solar Energy Surpass Coal in U.S. Electricity Generation

Wind and Solar Surpass Coal in U.S. power generation, as EIA data cites falling LCOE, clean energy incentives, grid upgrades, and battery storage driving renewables growth, lower emissions, jobs, and less fossil fuel reliance.


Key Points

An EIA-noted milestone where U.S. renewables outproduce coal, driven by lower LCOE, policy credits, and grid upgrades.

✅ EIA data shows wind and solar exceed coal generation

✅ Falling LCOE boosts project viability across the grid

✅ Policies and storage advances strengthen reliability


In a landmark shift for the energy sector, wind and solar power have recently surpassed coal in electricity generation in the United States. This milestone, reported by Warp News, marks a significant turning point in the country’s energy landscape and underscores the growing dominance of renewable energy sources.

A Landmark Achievement

The achievement of wind and solar energy generating more electricity than coal is a landmark moment in the U.S. energy sector. Historically, coal has been a cornerstone of electricity production, providing a substantial portion of the nation's power needs. However, recent data reveals a transformative shift, with renewables surpassing coal for the first time in 130 years, as renewable energy sources, particularly wind and solar, have begun to outpace coal in terms of electricity generation.

The U.S. Energy Information Administration (EIA) reported that in recent months, wind and solar combined produced more electricity than coal, including a record 28% share in April, reflecting a broader trend towards cleaner energy sources. This development is driven by several factors, including advancements in renewable technology, decreasing costs, and a growing commitment to reducing greenhouse gas emissions.

Technological Advancements and Cost Reductions

One of the key drivers behind this shift is the rapid advancement in wind and solar technologies, as wind power surges in the U.S. electricity mix across regions. Improvements in turbine and panel efficiency have significantly increased the amount of electricity that can be generated from these sources. Additionally, technological innovations have led to lower production costs, making wind and solar energy more competitive with traditional fossil fuels.

The cost of solar panels and wind turbines has decreased dramatically over the past decade, making renewable energy projects more economically viable. According to Warp News, the levelized cost of electricity (LCOE) from solar and wind has fallen to levels that are now comparable to or lower than coal-fired power. This trend has been pivotal in accelerating the transition to renewable energy sources.

Policy Support and Investment

Government policies and incentives have also played a crucial role in supporting the growth of wind and solar energy, with wind now the most-used renewable electricity source in the U.S. helping drive deployment. Federal and state-level initiatives, such as tax credits, subsidies, and renewable energy mandates, have encouraged investment in clean energy technologies. These policies have provided the financial and regulatory support necessary for the expansion of renewable energy infrastructure.

The Biden administration’s focus on addressing climate change and promoting clean energy has further bolstered the transition. The Infrastructure Investment and Jobs Act and the Inflation Reduction Act, among other legislative efforts, have allocated significant funding for renewable energy projects, grid modernization, and research into advanced technologies.

Environmental and Economic Implications

The surpassing of coal by wind and solar energy has significant environmental and economic implications, building on the milestone when renewables became the second-most prevalent U.S. electricity source in 2020 and set the stage for further gains. Environmentally, it represents a major step forward in reducing carbon emissions and mitigating climate change. Coal-fired power plants are among the largest sources of greenhouse gases, and transitioning to cleaner energy sources is essential for meeting climate targets and improving air quality.

Economically, the shift towards wind and solar energy is creating new opportunities and industries. The growth of the renewable energy sector is generating jobs in manufacturing, installation, and maintenance. Additionally, the decreased reliance on imported fossil fuels enhances energy security and stabilizes energy prices.

Challenges and Future Outlook

Despite the progress, there are still challenges to address. The intermittency of wind and solar power requires advancements in energy storage and grid management to ensure a reliable electricity supply. Investments in battery storage technologies and smart grid infrastructure are crucial for overcoming these challenges and integrating higher shares of renewable energy into the grid.

Looking ahead, the trend towards renewable energy is expected to continue, with renewables projected to soon provide about one-fourth of U.S. electricity as deployment accelerates, driven by ongoing technological advancements, supportive policies, and a growing commitment to sustainability. As wind and solar power become increasingly cost-competitive and efficient, their role in the U.S. energy mix will likely expand, further displacing coal and other fossil fuels.

Conclusion

The surpassing of coal by wind and solar energy in U.S. electricity generation is a significant milestone in the transition to a cleaner, more sustainable energy future. This achievement highlights the growing importance of renewable energy sources and the success of technological advancements and supportive policies in driving this transition. As the U.S. continues to invest in and develop renewable energy infrastructure, the move away from coal represents a crucial step towards achieving environmental goals and fostering economic growth in the clean energy sector.


Related News

View more

Canada in top 10 for hydropower jobs, but doesn't rank on other renewables

Canada Renewable Energy Jobs rank top 10 in hydropower, says IRENA, but trail in solar PV, wind power, and liquid biofuels; clean tech growth, EV manufacturing, and Canada Infrastructure Bank funding signal broader carbon-neutral opportunities.


Key Points

Canada counts 61,130 clean energy roles, top 10 in hydropower, with potential in solar, wind, biofuels, and EV manufacturing.

✅ 61,130 clean energy jobs in Canada per IRENA

✅ Top 10 share in hydropower employment

✅ Growth expected in solar, wind, biofuels, and EVs


Canada has made the top 10 list of countries for the number of jobs in hydropower, but didn’t rank in three other key renewable energy technologies, according to new international figures.

Although Canada has only two per cent of the global workforce, it had one of the 10 largest slices of the world’s jobs in hydropower in 2019, says the Abu Dhabi-based International Renewable Energy Agency (IRENA)

Canada didn’t make IRENA’s other top-10 employment lists, for solar photovoltaic (PV) technology, where solar power lags by international standards, liquid biofuels or wind power, released Sept. 30. Figures from the agency show the whole sector represents 61,130 jobs across Canada, or 0.5 per cent of the world’s 11.5 million jobs in renewables.

The numbers show Canada needs to move faster to minimize the climate crisis, including by joining trade blocs that put tariffs on high-carbon goods, argued the Victoria-based BC Sustainable Energy Association after reviewing IRENA’s report. The Canadian Renewable Energy Association also said it showed the country has untapped job creation potential, even as growth projections were scaled back after Ontario scrapped a clean energy program.

But other clean tech advocates say there’s more to the story. When tallying clean energy jobs, it's worth a broader look, Clean Energy Canada argued, pointing to the recent Ford-Unifor deal that includes a $1.8-billion commitment to produce electric vehicles in Oakville, Ont.

Natural Resources Minister Seamus O'Regan’s office also pointed out the renewables employment figures from IRENA are proportional to global population. “While Canada's share of the global clean energy job market is in line with our population size, we produce almost 2.7 per cent of the world’s total primary renewable energy supply. As only 0.5 per cent of the global population, we punch above our weight,” said O'Regan's press secretary, Ian Cameron.

Canada joined IRENA in January 2019 and the country has been described by the association as an “important market” for renewables over the long term.

On Thursday, Prime Minister Justin Trudeau announced a new $10-billion “Growth Plan” to be run by the Canada Infrastructure Bank that would include “$2.5 billion for clean power to support renewable generation and storage and to transmit clean electricity between provinces, territories, and regions, including to northern and Indigenous communities.” The infrastructure bank's plan is expected to create 60,000 jobs, the government said, and in Alberta an Alberta renewables surge could power 4,500 jobs as projects scale up.

World ‘building the renewable energy revolution now’

A powerful renewables sector is not just about job creation. It is also imperative if we are to meet global climate objectives, according to the Intergovernmental Panel on Climate Change. Renewable energy sources have to make up at least a 63 per cent share of the global electricity market by mid-century to battle the more extreme effects of climate change, it said.

“The IRENA report shows that people all over of the world are building the renewable energy revolution now,” said Tom Hackney, policy adviser for the BC Sustainable Energy Association.

“Many people in Canada are doing so, too. But we need to move faster to minimize climate change. For example, at the level of trade policy, a great idea would be to develop low-carbon trading blocs that put tariffs on goods with high embodied carbon emissions.”

Canadian Renewable Energy Association president and CEO Robert Hornung said the IRENA jobs review highlights “significant job creation potential” in Canada. As governments explore how to stimulate economic recovery from the impact of the COVID-19 pandemic, said Hornung, it's important to “capitalize on Canada's untapped renewable energy resources.”

In Canada, 82 per cent of the electricity grid is already non-emitting, noted Sarah Petrevan, policy director for Clean Energy Canada.

With the federal government committing to a 90 per cent non-emitting grid by 2030, said Petrevan, more wind and solar deployment can be expected, even though solar demand has lagged in recent years, especially in the Prairies where renewables are needed to help with Canada’s coal-fired power plant phase out.

One example of renewables in the Prairies, where the provinces are poised to lead growth, is the Travers Solar project, which is expected to be constructed in Alberta through 2021, and is being touted as “Canada's largest solar farm.”

But renewables are only “one part of the broader clean energy sector,” said Petrevan. Clean Energy Canada has outlined how Canada could be electric and clean with the right choices, and has calculated clean tech supports around 300,000 jobs, projected to grow to half a million by 2030.

“We’re talking about a transition of our energy system in every sense — not just in the power we produce. So while the IRENA figures provide global context, they reflect only a portion of both our current reality and the opportunity for Canada,” she said.

The organization’s research has shown that manufacturing of electric vehicles would be one of the fastest-growing job creators over the next decade. Putting a punctuation mark on that is a recent $1.8-billion deal with Ford Motor Company of Canada to produce five models of electric vehicles in Oakville, Ont.

China ‘remains the clear leader’ in renewables jobs

With 4.3 million renewable energy jobs in 2019, or 38 per cent of all renewables jobs, China “remains the clear leader in renewable energy employment worldwide,” the IRENA report states. China has the world's largest population and the second-largest GDP.

The country is also by far the world’s largest emitter of carbon pollution, at 28 per cent of global greenhouse gas emissions, and has significant fossil fuel interests. Chinese President Xi Jinping called for a “green revolution” last month, and pledged to “achieve carbon neutrality before 2060.”

China holds the largest proportion of jobs in hydropower, with 29 per cent of all jobs, followed by India at 19 per cent, Brazil at 11 per cent and Pakistan at five per cent, said IRENA.

Canada, with 32,359 jobs in the industry, and Turkey and Colombia hold two per cent each of the world’s hydropower jobs, while Myanmar and Russia hold three per cent each and Vietnam has four per cent.

China also dominates the global solar PV workforce, with 59 per cent of all jobs, followed by Japan, the United States, India, Bangladesh, Vietnam, Malaysia, Brazil, Germany and the Philippines. There are 4,261 jobs in solar PV in Canada, IRENA calculated, and the country is set to hit a 5 GW solar milestone as capacity expands, out of a global workforce of 3.8 million jobs.

In wind power, China again leads, with 44 per cent of all jobs. Germany, the United States and India come after, with the United Kingdom, Denmark, Mexico, Spain, the Philippines and Brazil following suit. Canada has 6,527 jobs in wind power out of 1.17 million worldwide.

As for liquid biofuels, Brazil leads that industry, with 34 per cent of all jobs. Indonesia, the United States, Colombia, Thailand, Malaysia, China, Poland, Romania and the Philippines fill out the top 10. There are 17,691 jobs in Canada in liquid biofuels.


Related News

View more

Europe's stunted hydro & nuclear output may hobble recovery drive

Europe 2023 Energy Shortfall underscores how weak hydro and nuclear offset record solar and wind, tightening grids as natural gas supplies shrink and demand rebounds, heightening risks of electricity shortages across key economies.


Key Points

A regional gap as weak hydro and nuclear offset record solar and wind, straining supply as gas stays tight.

✅ Hydro and nuclear output fell sharply in early 2023

✅ Record solar and wind could not offset the deficit

✅ Industrial demand rebound pressures limited gas supplies


Shortfalls in Europe's hydro and nuclear output have more than offset record electricity generation from wind and solar power sites over the first quarter of 2023, leaving the region vulnerable to acute energy shortages for the second straight year.

European countries fast-tracked renewable energy capacity development in 2022 in the wake of Russia's invasion of Ukraine last February, which upended natural gas flows to the region and sent power prices soaring.

Europe lifted renewable energy supply capacity by a record 57,290 megawatts in 2022, or by nearly 9%, according to the International Energy Agency (IRENA), amid a scramble to replace imported Russian gas with cleaner, home-grown energy.

However, steep drops in both hydro and nuclear output - two key sources of non-emitting energy - mean Europe's power producers have limited ways to lift overall electricity generation, as the region is losing nuclear power at a critical moment, just as the region's economies start to reboot after last year's energy shock.

POWER PLATEAU
Europe's total electricity generation over the first quarter of 2023 hit 1,213 terawatt hours, or roughly 6.4% less than during the same period in 2022, according to data from think tank Ember.

At the same time, European power hits records during extreme heat as plants struggle to cool, exacerbating supply risks.

As Europe's total electricity demand levels were in post-COVID-19 expansion mode in early 2022 before Russia's so-called special operation sent power costs to record highs amid debates over how electricity is priced in Europe, it makes sense that overall electricity use was comparatively stunted in early 2023.

However, efforts are now underway to revive activity at scores of European factories, industrial plants and production lines that were shuttered or curtailed in 2022, so Europe's collective electricity consumption totals are set to trend steadily higher over the remainder of 2023.

With Russian natural gas unavailable in the previous quantities due to sanctions and supply issues, Europe's power producers will need to deploy alternative energy sources, including renewables poised to eclipse coal globally, to feed that increase in power demand.

And following the large jump in renewable capacity brought online in 2022, utilities can deploy more low-emissions energy than ever before across Europe's electricity grids.


Related News

View more

Sign Up for Electricity Forum’s Newsletter

Stay informed with our FREE Newsletter — get the latest news, breakthrough technologies, and expert insights, delivered straight to your inbox.

Electricity Today T&D Magazine Subscribe for FREE

Stay informed with the latest T&D policies and technologies.
  • Timely insights from industry experts
  • Practical solutions T&D engineers
  • Free access to every issue

Download the 2025 Electrical Training Catalog

Explore 50+ live, expert-led electrical training courses –

  • Interactive
  • Flexible
  • CEU-cerified